In Vehicles Payment Market
Market Insights on In Vehicles Payment Market covering sales outlook, demand forecast & up-to-date key trends
In Vehicles Payment Market by Mode of Payment, Application & Region - Forecast 2022 - 2032
In Vehicles Payment Market Outlook (2022-2032)
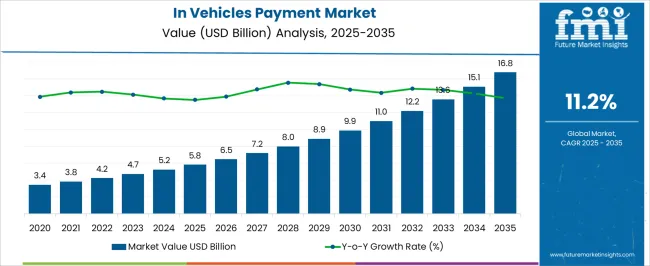
[328 Pages Report] The In Vehicles Payment Market is projected to have a significant CAGR of 11.6% during the period of 2022-2032.
The In Vehicles Payment Market is predicted to grow from US$ 4.2 Bn in 2022 to US$ 12.6 Bn in 2032. Previously, the market grew at a faster rate of 16.6% per year from 2015 to 2021, culminating in a market worth US$ 3.6 Bn in 2021.
“Owing to the growing need for more interactive in-vehicle entertainment systems, automakers are now able to integrate payment and shopping features into their dashboards.”
The market is expected to increase due to rising demand from vehicle owners for ordering food and coffee, as well as paying bills at gas stations and restaurants. Also expected to support market demand are technology improvements, such as connected car technologies and the Internet of Things (IoT). Another element driving industry statistics is the growing emphasis on contactless payments.
Attributes |
Details |
In Vehicles Payment Market CAGR (2022-2032) |
11.6% |
In Vehicles Payment Market Size (2022) |
US$ 4.2 Bn |
In Vehicles Payment Market Size (2032) |
US$ 12.6 Bn |
How Covid-19 Impacts the In Vehicles Payment Market?
As the COVID-19 pandemic reduces the life expectancy of major economies by limiting leisure activities and discouraging travel and commuting, government-imposed lockdowns have limited the usage of passenger cars and public transportation. As a result, in-vehicle systems can see market growth disruption in 2020, comparable to the global automotive sector.
However, due to the boom in demand for contactless payment solutions around the world, the market recovered fast and lockdown restrictions were eased in the following years. Furthermore, prominent corporations began to roll out contactless payment solutions for their in-vehicle payment services, resulting in a market resurgence.
Mercedes, for example, launched contactless in-vehicle fuel payment services in Germany in March 2021 to meet the growing need for contactless payment solutions in the face of pandemics.
The growing demand among individuals for contactless payments to avoid any potential coronavirus exposure is likely to contribute to the market's growth during the forecast period, as are social distancing rules promoted by various governments.
Let us know your requirement to get
100% FREE customization
Which Factors lead to the Growth of the In Vehicles Payment Market?
Widespread social distancing measures imposed by the government in response to the pandemic and growing public safety concerns are projected to drive demand for contactless payment solutions, boosting the implementation of in-vehicle payment services.
Furthermore, the market is expected to increase due to the emphasis of major key players such as Mercedes-Benz, General Motors, Honda, Mercedes-Benz, Hyundai, and others on creating contactless linked vehicle payment solutions. Congestion on roads, petrol stations, toll plazas, parking spots, and other locations encourages people to use these payment methods.
The adoption of this payment technology in these apps can save time and make it easier for customers to order and pay. As a result, infrastructural development of these locations for in-car payment compatibility is likely to drive in vehicle payment market growth in the near future.
What Restrains the In Vehicles Payment Market?
During the projection period, the high cost of embedded systems compared to integrated systems is likely to stifle market growth. Furthermore, cybersecurity and vulnerability hazards connected with using in-vehicle payment services, such as security difficulties relating to personal data, card numbers, CVV, PIN, and others, are expected to limit in-vehicle payment system adoption throughout the projected period.
Find your sweet spots for generating winning opportunities in this market.
Talk to AnalystWhat are the Trends in the In Vehicles Payment Market?
Global demand for in vehicle payment systems is likely to be fueled by increased digitization in autos, rising usage of IoT, and maturing 5G connection. Furthermore, increased awareness of various in-vehicle services in underdeveloped and developing economies, as well as expanded uses of these services, are expected to drive market expansion throughout the forecast period.
Vehicles having technology integrated into the user's daily life, allowing the vehicle to interface with external technologies, are known as connected automobiles. Connected automobiles use their connectivity to provide passengers with in-vehicle payment options.
As a result, the global demand for in-vehicle payment systems is likely to rise as connected automobiles become more widely adopted and developed. Furthermore, major corporations such as Mastercard, Visa, and others are investing in linked auto payment technology, which is expected to have an impact on in vehicle payment market growth in the near future.
Comparative View of Adjacent In Vehicles Payment Market
In Vehicles Payment Market:
Attributes |
In Vehicles Payment Market |
CAGR (2022-2032) |
11.6% |
Market Value (2026) |
US$ 6.5 Bn |
Growth Factor |
Demand is high due to adoption of technology in apps that make it easy to use and save time. |
Opportunity |
Increased R&D and investing in technology opens up a lucrative market. |
Key Trends |
Higher potential due to increased digitalization. |
ePayment system market:
Attributes |
ePayment system market |
CAGR (2022-2032) |
17.7% |
Market Value (2026) |
US$ 206.8 Bn |
Growth Factor |
Higher dependency for safe and secure contactless payments is majorly driving the market |
Opportunity |
Consumer tastes are trending toward internet buying and cashless transactions. |
Key Trends |
Vendors are making the cashless transaction more accessible for better market prospects. |
Contactless Payment Market
Attributes |
Contactless Payment Market |
CAGR (2022-2032) |
11.7% |
Market Value (2026) |
US$ 17.9 Bn |
Growth Factor |
With touch-and-go payments, improved technologies ensure speedier transactions. |
Opportunity |
The introduction of HCE technology for mobile phones will open up even more prospects for growth. |
Key Trends |
Contactless payment is further evolving, making itself a useful interface between the consumers and retailers, advertiser, and marketers. |
Over the projected period, advances in Internet of Things (IoT) technology and strong efforts by various automakers to integrate new, advanced infotainment solutions into their vehicle models are expected to fuel in vehicle payment market expansion. The rising use of contactless payment methods in the aftermath of the COVID-19 pandemic, as well as further advancements in smart vehicles, augur well for the in vehicle payment market's growth.
Automobile makers are concentrating their efforts on developing built-in technology, such as voice-based controls, that might allow drivers to shop while on the road without jeopardizing road safety, improving technologies for the in vehicle payment market.
Given the potential for a voice-activated dashboard to divert the driver's attention, drivers must always prioritize road safety when shopping while driving, it creates opportunities for the in vehicle payment market.
According to a study conducted at the University of Utah, speech-to-text technology can create significant cognitive disruption, as conversing with a dashboard requires more effort than conversing with a person.
At this point, advancements in self-driving and connected automobile technologies is critical in propelling the in vehicle payment market forward over the forecast year. Over the forecast period, the market for in-vehicle payment services is expected to rise due to the increasing usage of driver assistance systems.
Driver assistance systems assist drivers in a variety of ways, including hassle-free parking and making purchases directly from the control panel without the use of any extra devices or cards. Due to all the aforementioned factors, the vehicle payment market is expected to reach US$ 12.6 Bn by 2032, from US$ 1.4 Bn in 2015.

An unified Market Research Subscription Platform, built for today’s disparate research needs.
Segmentation Outlook
Which is the leading Segment in the In Vehicles Payment Market by Mode of Payment?
In vehicle payment market, is segmented into mode of payment, application, and region.
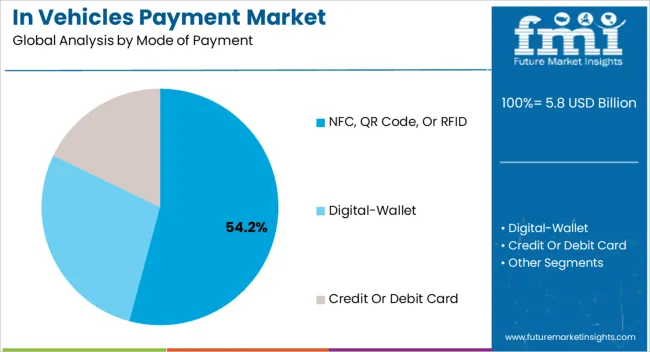
Based on mode of payment, credit/debit card is the leading segment in the in vehicle payment market, with the anticipated CAGR of 11.6%. The segment's growth is being driven by consumer preference for using credit and debit cards for contactless payments.
Furthermore, the segment's high adoption rate among people of various ages in established and developing economies for safe and quick transactions is expected to fuel growth throughout the forecast period.
Over the forecast period, the app/e-wallet segment is expected to increase at the fastest rate. Due to their high convenience and fast transaction capability, app and e-wallet payment mechanisms have seen a boom in popularity in recent years.
The expanding popularity of digital payment apps and e-wallets, such as Apple Pay, Google Pay, Amazon Pay, and others, as well as the ability to pay via mobile devices and on-demand apps, are likely to propel the segment forward throughout the forecast period.
Which is the leading Segment in the In Vehicles Payment Market by Application?
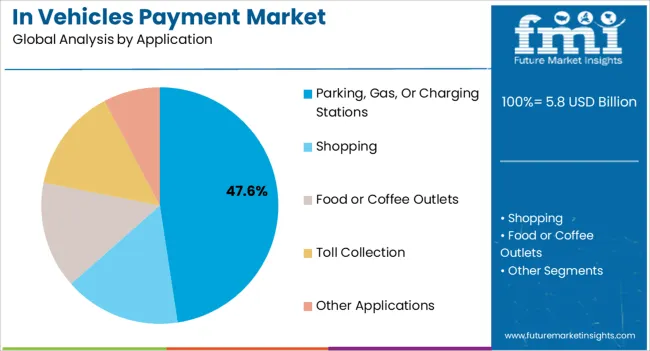
Based on application, toll collection is the leading segment in the in vehicle payment market, with the anticipated CAGR of 11.2%. Due to toll plaza infrastructure development to be compatible with many ways of payment and consumer inclination for contactless delivery, toll plazas have become more infrastructural.
Additionally, increased customer desire for purchasing through multiple online marketplaces for convenience, combined with significant social distancing guidelines during the pandemic, has influenced the shopping segment growth positively.
During the predicted period, the food and coffee segment also experienced a significant increase. The segment is expected to rise due to rising demand for on-the-go snacks and beverages among drivers and passengers. Furthermore, if traffic congestion worsens, people are more likely to use in-vehicle payment technologies for food and coffee purchases.
Which is the Leading Region in the In Vehicles Payment Market?
Regions |
CAGR (2022-2032) |
United States |
11.4% |
United Kingdom |
10.6% |
China |
11.1% |
Japan |
10.3% |
South Korea |
10.1% |
By 2032, North America had dominated the global market, with a projected market size of US$ 4.5 billion, and it is predicted to continue to do so in the years ahead. The existence of technological advancement in North America is expected to promote the region's market growth.
The market is primarily driven by the rising penetration of connected automobiles in the United States. Furthermore, the presence of the leading payment service providers, such as Mastercard, Visa, and others, as well as their collaboration with automakers like General Motors, Honda, and others to create in-vehicle payment systems, are projected to drive market expansion throughout the projection period.
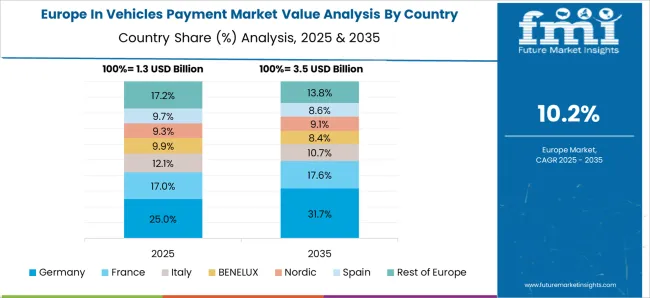
Europe had the second-largest proportion of the in vehicle payment market. During the projected period, the market is expected to increase due to the presence of a robust automotive sector and the increasing penetration of next generation connected vehicles. France, Germany, and the United Kingdom have the highest penetration of linked automobiles in Europe.
In addition, manufacturers' efforts to roll out in-vehicle payment facilities in major European nations are expected to boost in vehicle payment market growth. Mercedes, for example, announced ambitions to expand its in vehicle payment services across Europe by the end of 2021 in March 2021.
How Competition Influences the In Vehicles Payment Market?
The players are concentrating their efforts on building payment solutions in association with a variety of payment solution suppliers. Meanwhile, Google and Amazon have created gadgets that can be connected to a vehicle's console and used with voice commands to assist with shopping, navigation, and other chores, as well as paying for services through various payment methods.
- Mercedes-Benz and Visa announced a global cooperation in November 2021 to provide in-vehicle payment services that include a secure fingerprint scanner for safe contactless transactions.
- Honda and Visa partnered in January 2019 to launch Honda Dream Drive, a fully integrated in-car experience.
- In August 2018, GM announced a cooperation with Shell, a Dutch oil company, to roll out embedded, in-dash fuel payment systems.
- Visa and SiriusXM Linked Vehicles Services Inc. established a cooperation in January 2019 to improve the in-car customer experience and offer the SiriusXM e-wallet to manufacturers who use SiriusXM's connected vehicle services.
Key players
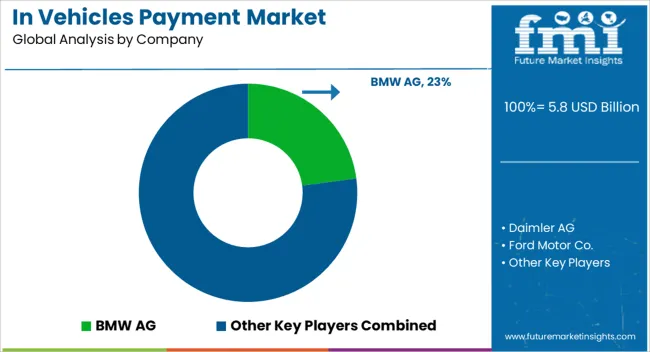
- BMW AG
- Daimler AG
- Ford Motor Co.
- General Motors Co.
- Honda Motor Co. Ltd.
Key Segments
By Mode of Payment
- NFC, QR Code/RFID
- Apple- Wallet
- Credit/Debit Card
By Application
- Parking, Gas/Charging Stations
- Shopping
- Food/Coffee
- Toll Collection
- Others
By Region
- North America
- Latin America
- Europe
- Asia Pacific
- Middle East & Africa
Frequently Asked Questions
The in vehicle payment is projected to have a CAGR of 11.6% in 2032.
North America is the leading region, with an anticipated CAGR of 11.4% by 2032.
Credit/debit card is the leading segment in the market, with the projected CAGR of 11.6% by 2032.
The in vehicle payment is predicted to grow US$ 12.6 Bn by 2032.
Toll Collection leads the market with the projected CAGR of 11.2% in 2032.
1. Executive Summary
1.1. Global Market Outlook
1.2. Summary of Statistics
1.3. Key Market Characteristics & Attributes
1.4. FMI Analysis and Recommendations
2. Market Overview
2.1. Market Coverage / Taxonomy
2.2. Market Definition / Scope / Limitations
3. Market Risks and Trends Assessment
3.1. Risk Assessment
3.1.1. COVID-19 Crisis and Impact on In-vehicle Payments Demand
3.1.2. COVID-19 Impact Benchmark with Previous Crisis
3.1.3. Impact on Market Value (US$ Mn)
3.1.4. Assessment by Key Countries
3.1.5. Assessment by Key Market Segments
3.1.6. Action Points and Recommendation for Suppliers
3.2. Key Trends Impacting the Market
3.3. Formulation and Product Development Trends
4. Market Background and Foundation Data Points
4.1. Global In-vehicle Payments Market (US$ Mn)
4.2. In-vehicle Payments Market Opportunity Assessment (US$ Mn)
4.2.1. Total Available Market
4.2.2. Serviceable Addressable Market
4.2.3. Serviceable Obtainable Market
4.3. Market Scenario Forecast
4.3.1. Demand in optimistic Scenario
4.3.2. Demand in Likely Scenario
4.3.3. Demand in Conservative Scenario
4.4. Investment Feasibility Analysis
4.4.1. Investment in Established Markets
4.4.1.1. In Short Term
4.4.1.2. In Long Term
4.4.2. Investment in Emerging Markets
4.4.2.1. In Short Term
4.4.2.2. In Long Term
4.5. Forecast Factors - Relevance & Impact
4.5.1. Top Companies Historical Growth
4.5.2. Global In-vehicle Payments Market Growth
4.5.3. In-vehicle Payments Adoption Rate, By Country
4.6. Market Dynamics
4.6.1. Market Driving Factors and Impact Assessment
4.6.2. Prominent Market Challenges and Impact Assessment
4.6.3. In-vehicle Payments Market Opportunities
4.6.4. Prominent Trends in the Global Market & Their Impact Assessment
5. Key Success Factors
5.1. Manufacturers’ Focus on Low Penetration High Growth Markets
5.2. Banking on with Segments High Incremental Opportunity
5.3. Peer Benchmarking
6. Global In-vehicle Payments Market Demand Analysis 2015-2021 and Forecast, 2022-2032
6.1. Historical Market Analysis, 2015-2021
6.2. Current and Future Market Projections, 2022-2032
6.3. Y-o-Y Growth Trend Analysis
7. Global In-vehicle Payments Market Value Analysis 2015-2021 and Forecast, 2022-2032
7.1. Historical Market Value (US$ Mn) Analysis, 2015-2021
7.2. Current and Future Market Value (US$ Mn) Projections, 2022-2032
7.2.1. Y-o-Y Growth Trend Analysis
7.2.2. Absolute $ Opportunity Analysis
8. Global In-vehicle Payments Market Analysis 2015-2021 and Forecast 2022-2032, By Mode of Payment
8.1. Introduction / Key Findings
8.2. Historical Market Size (US$ Mn) Analysis By Mode of Payment, 2015-2021
8.3. Current and Future Market Size (US$ Mn) Analysis and Forecast By Mode of Payment, 2022-2032
8.3.1. NFC
8.3.2. QR Code/RFID
8.3.3. App/e-wallet
8.3.4. Credit/Debit Card
8.4. Market Attractiveness Analysis By Mode of Payment
9. Global In-vehicle Payments Market Analysis 2015-2021 and Forecast 2022-2032, By Application
9.1. Introduction / Key Findings
9.2. Historical Market Size (US$ Mn) Analysis By Application, 2015-2021
9.3. Current and Future Market Size (US$ Mn) Analysis and Forecast By Application, 2022-2032
9.3.1. Parking
9.3.2. Gas/Charging Stations
9.3.3. Shopping
9.3.4. Food/Coffee
9.3.5. Toll Collection
9.3.6. Others
9.4. Market Attractiveness Analysis By Application
10. Global In-vehicle Payments Market Analysis 2015-2021 and Forecast 2022-2032, By Region
10.1. Introduction
10.2. Historical Market Size (US$ Mn) Analysis By Region, 2015-2021
10.3. Current Market Size (US$ Mn) & Analysis and Forecast By Region, 2022-2032
10.3.1. North America
10.3.2. Latin America
10.3.3. Europe
10.3.4. Asia Pacific
10.3.5. Middle East and Africa (MEA)
10.4. Market Attractiveness Analysis By Region
11. North America In-vehicle Payments Market Analysis 2015-2021 and Forecast 2022-2032
11.1. Introduction
11.2. Pricing Analysis
11.3. Historical Market Value (US$ Mn) Trend Analysis By Market Taxonomy, 2015-2021
11.4. Market Value (US$ Mn) & Forecast By Market Taxonomy, 2022-2032
11.4.1. By Country
11.4.1.1. U.S.
11.4.1.2. Canada
11.4.1.3. Rest of North America
11.4.2. By Mode of Payment
11.4.3. By Application
11.5. Market Attractiveness Analysis
11.5.1. By Country
11.5.2. By Mode of Payment
11.5.3. By Application
12. Latin America In-vehicle Payments Market Analysis 2015-2021 and Forecast 2022-2032
12.1. Introduction
12.2. Pricing Analysis
12.3. Historical Market Value (US$ Mn) Trend Analysis By Market Taxonomy, 2015-2021
12.4. Market Value (US$ Mn) & Forecast By Market Taxonomy, 2022-2032
12.4.1. By Country
12.4.1.1. Brazil
12.4.1.2. Mexico
12.4.1.3. Rest of Latin America
12.4.2. By Mode of Payment
12.4.3. By Application
12.5. Market Attractiveness Analysis
12.5.1. By Country
12.5.2. By Mode of Payment
12.5.3. By Application
13. Europe In-vehicle Payments Market Analysis 2015-2021 and Forecast 2022-2032
13.1. Introduction
13.2. Pricing Analysis
13.3. Historical Market Value (US$ Mn) Trend Analysis By Market Taxonomy, 2015-2021
13.4. Market Value (US$ Mn) & Forecast By Market Taxonomy, 2022-2032
13.4.1. By Country
13.4.1.1. Germany
13.4.1.2. France
13.4.1.3. U.K.
13.4.1.4. Italy
13.4.1.5. Benelux
13.4.1.6. Nordic Countries
13.4.1.7. Rest of Europe
13.4.2. By Mode of Payment
13.4.3. By Application
13.5. Market Attractiveness Analysis
13.5.1. By Country
13.5.2. By Mode of Payment
13.5.3. By Application
14. Asia Pacific In-vehicle Payments Market Analysis 2015-2021 and Forecast 2022-2032
14.1. Introduction
14.2. Pricing Analysis
14.3. Historical Market Value (US$ Mn) Trend Analysis By Market Taxonomy, 2015-2021
14.4. Market Value (US$ Mn) & Forecast By Market Taxonomy, 2022-2032
14.4.1. By Country
14.4.1.1. China
14.4.1.2. Japan
14.4.1.3. South Korea
14.4.1.4. Rest of Asia Pacific
14.4.2. By Mode of Payment
14.4.3. By Application
14.5. Market Attractiveness Analysis
14.5.1. By Country
14.5.2. By Mode of Payment
14.5.3. By Application
15. Middle East and Africa In-vehicle Payments Market Analysis 2015-2021 and Forecast 2022-2032
15.1. Introduction
15.2. Pricing Analysis
15.3. Historical Market Value (US$ Mn) Trend Analysis By Market Taxonomy, 2015-2021
15.4. Market Value (US$ Mn) & Forecast By Market Taxonomy, 2022-2032
15.4.1. By Country
15.4.1.1. GCC Countries
15.4.1.2. South Africa
15.4.1.3. Turkey
15.4.1.4. Rest of Middle East and Africa
15.4.2. By Mode of Payment
15.4.3. By Application
15.5. Market Attractiveness Analysis
15.5.1. By Country
15.5.2. By Mode of Payment
15.5.3. By Application
16. Key Countries In-vehicle Payments Market Analysis 2015-2021 and Forecast 2022-2032
16.1. Introduction
16.1.1. Market Value Proportion Analysis, By Key Countries
16.1.2. Global Vs. Country Growth Comparison
16.2. US In-vehicle Payments Market Analysis
16.2.1. Value Proportion Analysis by Market Taxonomy
16.2.2. Value & Analysis and Forecast by Market Taxonomy, 2015-2032
16.2.2.1. By Mode of Payment
16.2.2.2. By Application
16.3. Canada In-vehicle Payments Market Analysis
16.3.1. Value Proportion Analysis by Market Taxonomy
16.3.2. Value & Analysis and Forecast by Market Taxonomy, 2015-2032
16.3.2.1. By Mode of Payment
16.3.2.2. By Application
16.4. Mexico In-vehicle Payments Market Analysis
16.4.1. Value Proportion Analysis by Market Taxonomy
16.4.2. Value & Analysis and Forecast by Market Taxonomy, 2015-2032
16.4.2.1. By Mode of Payment
16.4.2.2. By Application
16.5. Brazil In-vehicle Payments Market Analysis
16.5.1. Value Proportion Analysis by Market Taxonomy
16.5.2. Value & Analysis and Forecast by Market Taxonomy, 2015-2032
16.5.2.1. By Mode of Payment
16.5.2.2. By Application
16.6. Germany In-vehicle Payments Market Analysis
16.6.1. Value Proportion Analysis by Market Taxonomy
16.6.2. Value & Analysis and Forecast by Market Taxonomy, 2015-2032
16.6.2.1. By Mode of Payment
16.6.2.2. By Application
16.7. France In-vehicle Payments Market Analysis
16.7.1. Value Proportion Analysis by Market Taxonomy
16.7.2. Value & Analysis and Forecast by Market Taxonomy, 2015-2032
16.7.2.1. By Mode of Payment
16.7.2.2. By Application
16.8. Italy In-vehicle Payments Market Analysis
16.8.1. Value Proportion Analysis by Market Taxonomy
16.8.2. Value & Analysis and Forecast by Market Taxonomy, 2015-2032
16.8.2.1. By Mode of Payment
16.8.2.2. By Application
16.9. BENELUX In-vehicle Payments Market Analysis
16.9.1. Value Proportion Analysis by Market Taxonomy
16.9.2. Value & Analysis and Forecast by Market Taxonomy, 2015-2032
16.9.2.1. By Mode of Payment
16.9.2.2. By Application
16.10. UK In-vehicle Payments Market Analysis
16.10.1. Value Proportion Analysis by Market Taxonomy
16.10.2. Value & Analysis and Forecast by Market Taxonomy, 2015-2032
16.10.2.1. By Mode of Payment
16.10.2.2. By Application
16.11. Nordic Countries In-vehicle Payments Market Analysis
16.11.1. Value Proportion Analysis by Market Taxonomy
16.11.2. Value & Analysis and Forecast by Market Taxonomy, 2015-2032
16.11.2.1. By Mode of Payment
16.11.2.2. By Application
16.12. China In-vehicle Payments Market Analysis
16.12.1. Value Proportion Analysis by Market Taxonomy
16.12.2. Value & Analysis and Forecast by Market Taxonomy, 2015-2032
16.12.2.1. By Mode of Payment
16.12.2.2. By Application
16.13. Japan In-vehicle Payments Market Analysis
16.13.1. Value Proportion Analysis by Market Taxonomy
16.13.2. Value & Analysis and Forecast by Market Taxonomy, 2015-2032
16.13.2.1. By Mode of Payment
16.13.2.2. By Application
16.14. South Korea In-vehicle Payments Market Analysis
16.14.1. Value Proportion Analysis by Market Taxonomy
16.14.2. Value & Analysis and Forecast by Market Taxonomy, 2015-2032
16.14.2.1. By Mode of Payment
16.14.2.2. By Application
16.15. GCC Countries In-vehicle Payments Market Analysis
16.15.1. Value Proportion Analysis by Market Taxonomy
16.15.2. Value & Analysis and Forecast by Market Taxonomy, 2015-2032
16.15.2.1. By Mode of Payment
16.15.2.2. By Application
16.16. South Africa In-vehicle Payments Market Analysis
16.16.1. Value Proportion Analysis by Market Taxonomy
16.16.2. Value & Analysis and Forecast by Market Taxonomy, 2015-2032
16.16.2.1. By Mode of Payment
16.16.2.2. By Application
16.17. Turkey In-vehicle Payments Market Analysis
16.17.1. Value Proportion Analysis by Market Taxonomy
16.17.2. Value & Analysis and Forecast by Market Taxonomy, 2015-2032
16.17.2.1. By Mode of Payment
16.17.2.2. By Application
16.17.3. Competition Landscape and Player Concentration in the Country
17. Market Structure Analysis
17.1. Market Analysis by Tier of Companies
17.2. Market Concentration
17.3. Market Share Analysis of Top Players
17.4. Market Presence Analysis
17.4.1. By Regional footprint of Players
17.4.2. Product footprint by Players
18. Competition Analysis
18.1. Competition Dashboard
18.2. Competition Benchmarking
18.3. Competition Deep Dive
18.3.1. BMW AG
18.3.1.1. Overview
18.3.1.2. Product Portfolio
18.3.1.3. Sales Footprint
18.3.1.4. Strategy Overview
18.3.2. Daimler AG
18.3.2.1. Overview
18.3.2.2. Product Portfolio
18.3.2.3. Sales Footprint
18.3.2.4. Strategy Overview
18.3.3. Ford Motor Co.
18.3.3.1. Overview
18.3.3.2. Product Portfolio
18.3.3.3. Sales Footprint
18.3.3.4. Strategy Overview
18.3.4. General Motors Co.
18.3.4.1. Overview
18.3.4.2. Product Portfolio
18.3.4.3. Sales Footprint
18.3.4.4. Strategy Overview
18.3.5. Honda Motor Co. Ltd.
18.3.5.1. Overview
18.3.5.2. Product Portfolio
18.3.5.3. Sales Footprint
18.3.5.4. Strategy Overview
18.3.6. Hyundai Motor Co.
18.3.6.1. Overview
18.3.6.2. Product Portfolio
18.3.6.3. Sales Footprint
18.3.6.4. Strategy Overview
18.3.7. Volkswagen AG
18.3.7.1. Overview
18.3.7.2. Product Portfolio
18.3.7.3. Sales Footprint
18.3.7.4. Strategy Overview
18.3.8. Amazon
18.3.8.1. Overview
18.3.8.2. Product Portfolio
18.3.8.3. Sales Footprint
18.3.8.4. Strategy Overview
18.3.9. Google
18.3.9.1. Overview
18.3.9.2. Product Portfolio
18.3.9.3. Sales Footprint
18.3.9.4. Strategy Overview
18.3.10. International Business Machines Corporation
18.3.10.1. Overview
18.3.10.2. Product Portfolio
18.3.10.3. Sales Footprint
18.3.10.4. Strategy Overview
19. Assumptions and Acronyms Used
20. Research Methodology
Let us know your requirement to get
100% FREE customization
Table 1: Global In-vehicle Payments Market Value (US$ Mn), By Mode of Payment, 2015 – 2021
Table 2: Global In-vehicle Payments Market Value (US$ Mn), By Mode of Payment, 2022 – 2032
Table 3: Global In-vehicle Payments Market Value (US$ Mn), By Application, 2015 – 2021
Table 4: Global In-vehicle Payments Market Value (US$ Mn), By Application, 2022 – 2032
Table 5: Global In-vehicle Payments Market, By Region, 2015 – 2021
Table 6: Global In-vehicle Payments Market, By Region, 2022 – 2032
Table 7: North America In-vehicle Payments Market Value (US$ Mn), By Mode of Payment, 2015 – 2021
Table 8: North America In-vehicle Payments Market Value (US$ Mn), By Mode of Payment, 2022 – 2032
Table 9: North America In-vehicle Payments Market Value (US$ Mn), By Application, 2015 – 2021
Table 10: North America In-vehicle Payments Market Value (US$ Mn), By Application, 2022 – 2032
Table 11: North America In-vehicle Payments Market, By Country, 2015 – 2021
Table 12: North America In-vehicle Payments Market, By Country, 2022 – 2032
Table 13: Latin America In-vehicle Payments Market Value (US$ Mn), By Mode of Payment, 2015 – 2021
Table 14: Latin America In-vehicle Payments Market Value (US$ Mn), By Mode of Payment, 2022 – 2032
Table 15: Latin America In-vehicle Payments Market Value (US$ Mn), By Application, 2015 – 2021
Table 16: Latin America In-vehicle Payments Market Value (US$ Mn), By Application, 2022 – 2032
Table 17: Latin America In-vehicle Payments Market, By Country, 2015 – 2021
Table 18: Latin America In-vehicle Payments Market, By Country, 2022 – 2032
Table 19: Europe In-vehicle Payments Market Value (US$ Mn), By Mode of Payment, 2015 – 2021
Table 20: Europe In-vehicle Payments Market Value (US$ Mn), By Mode of Payment, 2022 – 2032
Table 21: Europe In-vehicle Payments Market Value (US$ Mn), By Application, 2015 – 2021
Table 22: Europe In-vehicle Payments Market Value (US$ Mn), By Application, 2022 – 2032
Table 23: Europe In-vehicle Payments Market, By Country, 2015 – 2021
Table 24: Europe In-vehicle Payments Market, By Country, 2022 – 2032
Table 25: Asia Pacific In-vehicle Payments Market Value (US$ Mn), By Mode of Payment, 2015 – 2021
Table 26: Asia Pacific In-vehicle Payments Market Value (US$ Mn), By Mode of Payment, 2022 – 2032
Table 27: Asia Pacific In-vehicle Payments Market Value (US$ Mn), By Application, 2015 – 2021
Table 28: Asia Pacific In-vehicle Payments Market Value (US$ Mn), By Application, 2022 – 2032
Table 29: Asia Pacific In-vehicle Payments Market, By Country, 2015 – 2021
Table 30: Asia Pacific In-vehicle Payments Market, By Country, 2022 – 2032
Table 31: MEA In-vehicle Payments Market Value (US$ Mn), By Mode of Payment, 2015 – 2021
Table 32: MEA In-vehicle Payments Market Value (US$ Mn), By Mode of Payment, 2022 – 2032
Table 33: MEA In-vehicle Payments Market Value (US$ Mn), By Application, 2015 – 2021
Table 34: MEA In-vehicle Payments Market Value (US$ Mn), By Application, 2022 – 2032
Table 35: MEA In-vehicle Payments Market, By Country, 2015 – 2021
Table 36: MEA In-vehicle Payments Market, By Country, 2022 – 2032
Table 37: Global In-vehicle Payments Market Incremental $ Opportunity, By Mode of Payment, 2015 - 2021
Table 38: Global In-vehicle Payments Market Incremental $ Opportunity, By Application, 2022 – 2032
Table 39: Global In-vehicle Payments Market Incremental $ Opportunity, By Region, 2022 – 2032
Table 40: North America In-vehicle Payments Market Incremental $ Opportunity, By Mode of Payment, 2015 - 2021
Table 41: North America In-vehicle Payments Market Incremental $ Opportunity, By Application, 2022 – 2032
Table 42: North America In-vehicle Payments Market Incremental $ Opportunity, By Country, 2022 – 2032
Table 43: Latin America In-vehicle Payments Market Incremental $ Opportunity, By Mode of Payment, 2015 - 2021
Table 44: Latin America In-vehicle Payments Market Incremental $ Opportunity, By Application, 2022 – 2032
Table 45: Latin America In-vehicle Payments Market Incremental $ Opportunity, By Country, 2022 – 2032
Table 46: Europe In-vehicle Payments Market Incremental $ Opportunity, By Mode of Payment, 2015 - 2021
Table 47: Europe In-vehicle Payments Market Incremental $ Opportunity, By Application, 2022 – 2032
Table 48: Europe In-vehicle Payments Market Incremental $ Opportunity, By Country, 2022 - 2032
Table 49: Asia Pacific In-vehicle Payments Market Incremental $ Opportunity, By Mode of Payment, 2015 - 2021
Table 50: Asia Pacific In-vehicle Payments Market Incremental $ Opportunity, By Application, 2022 – 2032
Table 51: Asia Pacific In-vehicle Payments Market Incremental $ Opportunity, By Country, 2022 – 2032
Table 52: MEA In-vehicle Payments Market Incremental $ Opportunity, By Mode of Payment, 2015 - 2021
Table 53: MEA In-vehicle Payments Market Incremental $ Opportunity, By Application, 2022 – 2032
Table 54: MEA In-vehicle Payments Market Incremental $ Opportunity, By Country, 2022 - 2032
Find your sweet spots for generating winning opportunities in this market.
Talk to AnalystFigure 1: Global In-vehicle Payments Market Value (US$ Mn) and Year-on-Year Growth, 2015-2032
Figure 2: Global In-vehicle Payments Market Absolute $ Historical Gain (2015 - 2021) and Opportunity (2022 – 2032), US$ Mn
Figure 3: Global In-vehicle Payments Market Share, By Mode of Payment, 2022 & 2032
Figure 4: Global In-vehicle Payments Market Y-o-Y Growth Projections, By Mode of Payment – 2022-2032
Figure 5: Global In-vehicle Payments Market Attractiveness Index, By Mode of Payment – 2022-2032
Figure 6: Global In-vehicle Payments Market Share, By Application, 2022 & 2032
Figure 7: Global In-vehicle Payments Market Y-o-Y Growth Projections, By Application – 2022-2032
Figure 8: Global In-vehicle Payments Market Attractiveness Index, By Application – 2022-2032
Figure 9: Global In-vehicle Payments Market Share, By Region, 2022 & 2032
Figure 10: Global In-vehicle Payments Market Y-o-Y Growth Projections, By Region – 2022-2032
Figure 11: Global In-vehicle Payments Market Attractiveness Index, By Region – 2022-2032
Figure 12: North America In-vehicle Payments Market Value (US$ Mn) and Year-on-Year Growth, 2015-2032
Figure 13: North America In-vehicle Payments Market Absolute $ Opportunity Historical (2015 - 2021) and Forecast Period (2022 – 2032), US$ Mn
Figure 14: North America In-vehicle Payments Market Share, By Mode of Payment, 2022 & 2032
Figure 15: North America In-vehicle Payments Market Y-o-Y Growth Projections, By Mode of Payment – 2022-2032
Figure 16: North America In-vehicle Payments Market Attractiveness Index, By Mode of Payment – 2022-2032
Figure 17: North America In-vehicle Payments Market Share, By Application, 2022 & 2032
Figure 18: North America In-vehicle Payments Market Y-o-Y Growth Projections, By Application – 2022-2032
Figure 19: North America In-vehicle Payments Market Attractiveness Index, By Application – 2022-2032
Figure 20: North America In-vehicle Payments Market Share, By Country, 2022 & 2032
Figure 21: North America In-vehicle Payments Market Y-o-Y Growth Projections, By Country – 2022-2032
Figure 22: North America In-vehicle Payments Market Attractiveness Index, By Country – 2022-2032
Figure 23: Latin America In-vehicle Payments Market Value (US$ Mn) and Year-on-Year Growth, 2015-2032
Figure 24: Latin America In-vehicle Payments Market Absolute $ Opportunity Historical (2015 - 2021) and Forecast Period (2022 – 2032), US$ Mn
Figure 25: Latin America In-vehicle Payments Market Share, By Mode of Payment, 2022 & 2032
Figure 26: Latin America In-vehicle Payments Market Y-o-Y Growth Projections, By Mode of Payment – 2022-2032
Figure 27: Latin America In-vehicle Payments Market Attractiveness Index, By Mode of Payment – 2022-2032
Figure 28: Latin America In-vehicle Payments Market Share, By Application, 2022 & 2032
Figure 29: Latin America In-vehicle Payments Market Y-o-Y Growth Projections, By Application – 2022-2032
Figure 30: Latin America In-vehicle Payments Market Attractiveness Index, By Application – 2022-2032
Figure 31: Latin America In-vehicle Payments Market Share, By Country, 2022 & 2032
Figure 32: Latin America In-vehicle Payments Market Y-o-Y Growth Projections, By Country – 2022-2032
Figure 33: Latin America In-vehicle Payments Market Attractiveness Index, By Country – 2022-2032
Figure 34: Europe In-vehicle Payments Market Value (US$ Mn) and Year-on-Year Growth, 2015-2032
Figure 35: Europe In-vehicle Payments Market Absolute $ Opportunity Historical (2015 - 2021) and Forecast Period (2022 – 2032), US$ Mn
Figure 36: Europe In-vehicle Payments Market Share, By Mode of Payment, 2022 & 2032
Figure 37: Europe In-vehicle Payments Market Y-o-Y Growth Projections, By Mode of Payment – 2022-2032
Figure 38: Europe In-vehicle Payments Market Attractiveness Index, By Mode of Payment – 2022-2032
Figure 39: Europe In-vehicle Payments Market Share, By Application, 2022 & 2032
Figure 40: Europe In-vehicle Payments Market Y-o-Y Growth Projections, By Application – 2022-2032
Figure 41: Europe In-vehicle Payments Market Attractiveness Index, By Application – 2022-2032
Figure 42: Europe In-vehicle Payments Market Share, By Country, 2022 & 2032
Figure 43: Europe In-vehicle Payments Market Y-o-Y Growth Projections, By Country – 2022-2032
Figure 44: Europe In-vehicle Payments Market Attractiveness Index, By Country – 2022-2032
Figure 45: MEA In-vehicle Payments Market Value (US$ Mn) and Year-on-Year Growth, 2015-2032
Figure 46: MEA In-vehicle Payments Market Absolute $ Opportunity Historical (2015 - 2021) and Forecast Period (2022 – 2032), US$ Mn
Figure 47: MEA In-vehicle Payments Market Share, By Mode of Payment, 2022 & 2032
Figure 48: MEA In-vehicle Payments Market Y-o-Y Growth Projections, By Mode of Payment – 2022-2032
Figure 49: MEA In-vehicle Payments Market Attractiveness Index, By Mode of Payment – 2022-2032
Figure 50: MEA In-vehicle Payments Market Share, By Application, 2022 & 2032
Figure 51: MEA In-vehicle Payments Market Y-o-Y Growth Projections, By Application – 2022-2032
Figure 52: MEA In-vehicle Payments Market Attractiveness Index, By Application – 2022-2032
Figure 53: MEA In-vehicle Payments Market Share, By Country, 2022 & 2032
Figure 54: MEA In-vehicle Payments Market Y-o-Y Growth Projections, By Country – 2022-2032
Figure 55: MEA In-vehicle Payments Market Attractiveness Index, By Country – 2022-2032
Figure 56: Asia Pacific In-vehicle Payments Market Value (US$ Mn) and Year-on-Year Growth, 2015-2032
Figure 57: Asia Pacific In-vehicle Payments Market Absolute $ Opportunity Historical (2015 - 2021) and Forecast Period (2022 – 2032), US$ Mn
Figure 58: Asia Pacific In-vehicle Payments Market Share, By Mode of Payment, 2022 & 2032
Figure 59: Asia Pacific In-vehicle Payments Market Y-o-Y Growth Projections, By Mode of Payment – 2022-2032
Figure 60: Asia Pacific In-vehicle Payments Market Attractiveness Index, By Mode of Payment – 2022-2032
Figure 61: Asia Pacific In-vehicle Payments Market Share, By Application, 2022 & 2032
Figure 62: Asia Pacific In-vehicle Payments Market Y-o-Y Growth Projections, By Application – 2022-2032
Figure 63: Asia Pacific In-vehicle Payments Market Attractiveness Index, By Application – 2022-2032
Figure 64: Asia Pacific In-vehicle Payments Market Share, By Country, 2022 & 2032
Figure 65: Asia Pacific In-vehicle Payments Market Y-o-Y Growth Projections, By Country – 2022-2032
Figure 66: Asia Pacific In-vehicle Payments Market Attractiveness Index, By Country – 2022-2032
Figure 67: US In-vehicle Payments Market Value (US$ Mn) and Forecast, 2022 - 2032
Figure 68: US In-vehicle Payments Market Share, By Mode of Payment, 2021
Figure 69: US In-vehicle Payments Market Share, By Application, 2021
Figure 70: Canada In-vehicle Payments Market Value (US$ Mn) and Forecast, 2022 - 2032
Figure 71: Canada In-vehicle Payments Market Share, By Mode of Payment, 2021
Figure 72: Canada In-vehicle Payments Market Share, By Application, 2021
Figure 73: Brazil In-vehicle Payments Market Value (US$ Mn) and Forecast, 2022 - 2032
Figure 74: Brazil In-vehicle Payments Market Share, By Mode of Payment, 2021
Figure 75: Brazil In-vehicle Payments Market Share, By Application, 2021
Figure 76: Mexico In-vehicle Payments Market Value (US$ Mn) and Forecast, 2022 - 2032
Figure 77: Mexico In-vehicle Payments Market Share, By Mode of Payment, 2021
Figure 78: Mexico In-vehicle Payments Market Share, By Application, 2021
Figure 79: Germany In-vehicle Payments Market Value (US$ Mn) and Forecast, 2022 - 2032
Figure 80: Germany In-vehicle Payments Market Share, By Mode of Payment, 2021
Figure 81: Germany In-vehicle Payments Market Share, By Application, 2021
Figure 82: U.K. In-vehicle Payments Market Value (US$ Mn) and Forecast, 2022 - 2032
Figure 83: U.K. In-vehicle Payments Market Share, By Mode of Payment, 2021
Figure 84: U.K. In-vehicle Payments Market Share, By Application, 2021
Figure 85: France In-vehicle Payments Market Value (US$ Mn) and Forecast, 2022 - 2032
Figure 86: France In-vehicle Payments Market Share, By Mode of Payment, 2021
Figure 87: France In-vehicle Payments Market Share, By Application, 2021
Figure 88: Italy In-vehicle Payments Market Value (US$ Mn) and Forecast, 2022 - 2032
Figure 89: Italy In-vehicle Payments Market Share, By Mode of Payment, 2021
Figure 90: Italy In-vehicle Payments Market Share, By Application, 2021
Figure 91: BENELUX In-vehicle Payments Market Value (US$ Mn) and Forecast, 2022 - 2032
Figure 92: BENELUX In-vehicle Payments Market Share, By Mode of Payment, 2021
Figure 93: BENELUX In-vehicle Payments Market Share, By Application, 2021
Figure 94: Nordic Countries In-vehicle Payments Market Value (US$ Mn) and Forecast, 2022 - 2032
Figure 95: Nordic Countries In-vehicle Payments Market Share, By Mode of Payment, 2021
Figure 96: Nordic Countries In-vehicle Payments Market Share, By Application, 2021
Figure 97: China In-vehicle Payments Market Value (US$ Mn) and Forecast, 2022 - 2032
Figure 98: China In-vehicle Payments Market Share, By Mode of Payment, 2021
Figure 99: China In-vehicle Payments Market Share, By Application, 2021
Figure 100: Japan In-vehicle Payments Market Value (US$ Mn) and Forecast, 2022 - 2032
Figure 101: Japan In-vehicle Payments Market Share, By Mode of Payment, 2021
Figure 102: Japan In-vehicle Payments Market Share, By Application, 2021
Figure 103: South Korea In-vehicle Payments Market Value (US$ Mn) and Forecast, 2022 - 2032
Figure 104: South Korea In-vehicle Payments Market Share, By Mode of Payment, 2021
Figure 105: South Korea In-vehicle Payments Market Share, By Application, 2021
Figure 106: GCC Countries In-vehicle Payments Market Value (US$ Mn) and Forecast, 2022 - 2032
Figure 107: GCC Countries In-vehicle Payments Market Share, By Mode of Payment, 2021
Figure 108: GCC Countries In-vehicle Payments Market Share, By Application, 2021
Figure 109: South Africa In-vehicle Payments Market Value (US$ Mn) and Forecast, 2022 - 2032
Figure 110: South Africa In-vehicle Payments Market Share, By Mode of Payment, 2021
Figure 111: South Africa In-vehicle Payments Market Share, By Application, 2021
Figure 112: Turkey In-vehicle Payments Market Value (US$ Mn) and Forecast, 2022 - 2032
Figure 113: Turkey In-vehicle Payments Market Share, By Mode of Payment, 2021
Figure 114: Turkey In-vehicle Payments Market Share, By Application, 2021
Need specific information?
Request CustomizationExplore Technology Insights
View Reports