Infant Incubators Market Size and Share Forecast Outlook 2025 to 2035

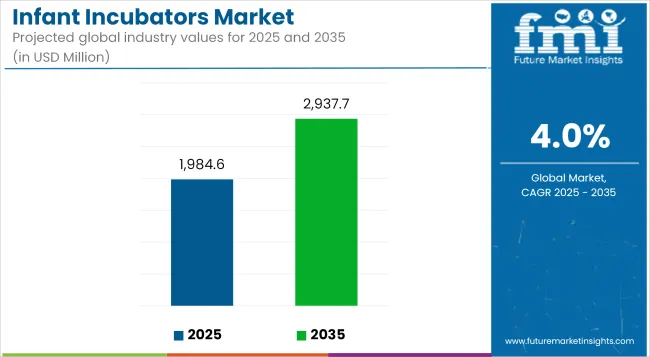
The global Infant Incubators Market is estimated to be valued at USD 1,984.6 million in 2025 and is projected to reach USD 2,937.7 million by 2035, registering a compound annual growth rate of 4.0% over the forecast period.
Quick Stats for Infant Incubators Market

  • Industry Value (2025):  USD 1,984.6 million
  • - Forecast Value (2035):  USD 2,937.7 million
  • Forecast CAGR: 4.0%
  • Leading Segment in 2025:  Standard Incubators
  • Key Growth Region: North America and Asia-Pacific
  • Top Key Players:  GE HealthCare, Advanced Instrumentations, LEEX LLC, International Biomedical, Fanem Ltda., Olidef Medical, Avante Health Solutions, Lionex GmbH, Drägerwerk AG & Co. KGaA, mOm Incubators Ltd, Weyer GmbH, Dixion, TSE MEDICAL, MedCare Visions® GmbH.

Infant Incubators Market Industry Value Analysis

Metric Value
Market Size in 2025 USD 1,984.6 Million
Projected Market Size in 2035 USD 2,937.7 Million
CAGR (2025 to 2035) 4.0%

The infant incubators market is advancing due to rising preterm birth rates, greater neonatal care investments, and increasing awareness in both developed and emerging economies. Key growth enablers include technological innovation particularly AI, IoT, and smart monitoring enhancing precision and care quality.

The shift toward portable and energy-efficient incubators is expanding access in underserved regions. However, high device costs and a shortage of trained staff limit widespread adoption, especially in low-resource settings. Despite these challenges, the market outlook remains strong, supported by public-private partnerships, improved healthcare infrastructure and policy-level focus on neonatal health. Future growth depends on scalable, affordable solutions that ensure accessibility and equity across global healthcare ecosystems.

Analyzing Infant Incubators Market by Top Investment Segments

Standard Incubators Lead Due to Widespread Clinical Integration and Ease of Use

The dominance of standard incubators accounting for 55.2% of the market in 2025 has been attributed to their universal adoption across neonatal intensive care units (NICUs). Their clinical reliability and versatility in managing a wide range of neonatal complications have been highly favored by healthcare professionals. In particular, closed-box and double-wall configurations have been integrated into standard care protocols due to their effectiveness in maintaining thermal stability and minimizing external contamination.

Standard incubators have also been supported by established procurement frameworks in both public and private hospitals, where budget-friendly options and reliable supplier relationships have fostered high-volume acquisition. Additionally, their compatibility with various neonatal monitoring systems has contributed to increased preference across developed and emerging economies.

Regulatory compliance and consistent performance outcomes in multi-center trials have further reinforced trust in their deployment. As neonatal care guidelines continue to emphasize stability and infection control, the standard incubator segment is expected to maintain its leadership role.
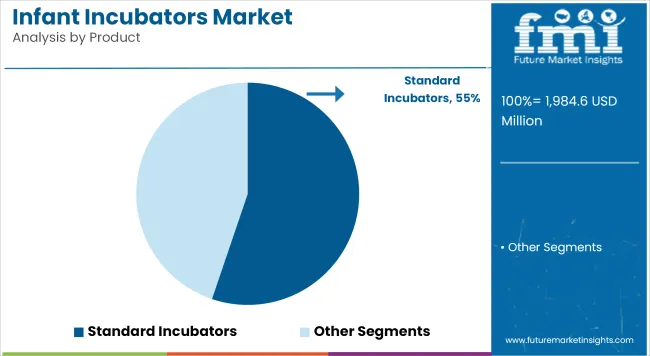
Infant Incubators Market Analysis By Product

Height Adjustable Incubators Gain Popularity Due to Ergonomic and Operational Flexibility

In 2025, height adjustable infant incubators holding a 35.2% revenue share has grown primarily due to improved ergonomic design and clinical workflow efficiency. These incubators have been preferred for their ability to reduce physical strain on healthcare professionals, particularly during frequent interventions and prolonged neonatal handling.

Their use has been associated with better staff compliance and reduced musculoskeletal stress, especially in high-acuity NICU environments. The enhanced mobility and adjustment features have also supported integration in diverse settings, including emergency rooms, specialized pediatric wards, and mobile NICU units.

Moreover, the adaptability of these incubators to different healthcare settings has enabled their deployment in both high- and mid-resource hospitals. Hospitals have increasingly prioritized ergonomic safety for clinical staff, and height-adjustable solutions have aligned with occupational safety mandates.
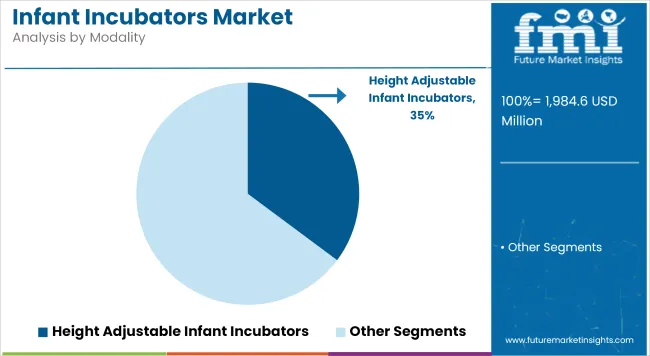
Infant Incubators Market Analysis By Modality

Patient Monitors Attached Incubators Lead the Market Due to Increasing Demand for Patient Safety and Real-Time Monitoring

Patient monitor integrated incubators dominate the market with 60.2% revenue share in 2025. This dominance is driven by rising demand for continuous physiological assessment of neonates. These incubators have enabled real-time monitoring of vital signs such as heart rate, oxygen saturation, and respiratory patterns parameters that are critical for timely clinical interventions.

Patient monitors have been embedded to reduce the latency of response in emergency situations and to enable closed-loop neonatal care systems. This integration has also been supported by regulatory agencies and hospital accreditation bodies, which increasingly mandate high-resolution patient surveillance in neonatal care. The deployment of such incubators has been linked with improved neonatal outcomes, particularly in premature infants or those requiring ventilatory support.

Challenges and Opportunities

Challenges

High Costs and Limited Access in Low-Income Regions

The infant incubators market's challenges include high equipment, maintenance costs, and lesser neonatal facilities in low-resource & rural populations. Most services in developing economies have unreliable electricity, qualified health workers and no funds to pay for advanced incubator technology that affects infant death rates. Stricter regulatory control and long processes for medical equipment manufacturers acts as a hindrance for the growth hurdle in industry.

Opportunities

Growth in Smart, Portable, and AI-Enabled Incubator Technology

Increasing interest in neonatal care developments, survival rates of preterm neonates, and AI-connected health services are driving demand for smart incubators with features like live monitoring and connectivity to remote networks. Emerging low-cost, portable, solar-powered, and AI-based incubators are widening access to neonatal care in low-resource contexts. In addition, government grants, non-profit healthcare programs, and smart hospital penetrations are fueling market expansion.
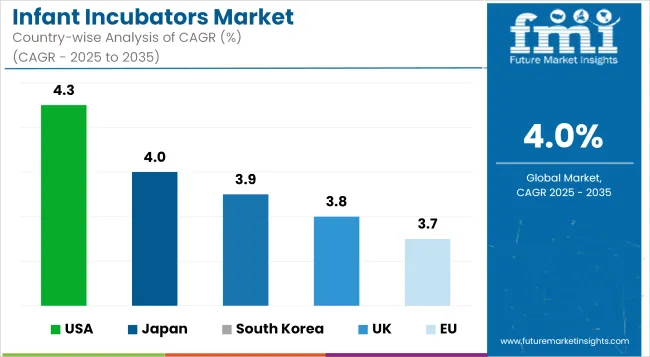
Country-wise Outlook

Infant Incubators Market Cagr Analysis By Country

United States

The United States infant incubators market is consistently growing due to innovative engineering in neonatal care, increasing preterm birth rates, and increasing investment in pediatric healthcare infrastructure. Market growth is driven by an increase in the demand for advanced incubators, such as with temperature control, humidity control, and built-in monitoring systems.

Presence of large medical device manufacturers and strong government support for neonatal health are also aiding the growth of the market. Moreover, increasing use of mobile and transport incubators for emergency neonatal care is further propelling market growth.

Country CAGR (2025 to 2035)
USA 4.3%

United Kingdom

The UK infant incubators market is spurred by the rising emphasis on enhancing neonatal care services along with the increasing prevalence of premature births. NHS: Ministry of Health in the UK is building neonatal units with advanced incubators to increase infant survival.

In addition, the market is driven by technological innovation in incubator technology, such as the introduction of AI-based monitoring and non-invasive respiratory treatment. Increasing demand for home-use neonatal care products is also shaping the market.

Country CAGR (2025 to 2035)
UK 3.8%

European Union

The Europe infant incubators market is expanding at a slow pace, owing to rising expenditures on healthcare, advances in neonatal intensive care units (NICUS), and growing awareness about neonatal health.

Germany, France, and Italy are leading markets in the region, registering good adoption with high-performance incubators with smart temperature control and oxygen therapy integration. In addition, EU medical device regulations around safety and quality are driving innovation in new-born baby care equipment.

Region CAGR (2025 to 2035)
EU 3.7%

Japan

The Japanese market for infant incubators is expanding on account of the country's advanced health care system and the importance to them of neonatal care. The increasing use of artificial intelligence-based monitoring, wireless technology, and automation in incubators is further driving the market.

Moreover, the rising elderly population in the country, coupled with the government's focus towards the provision of improved maternal & child health care services, is anticipated to drive market growth. Even now, Japan's effort to establish highly accurate medical instrument technology is affecting the next-gen neonatal incubators.

Country CAGR (2025 to 2035)
Japan 4.0%

South Korea

South Korea Infant Incubators Market is witnessing steady growth and is expected to progress further due to increased investments in the infrastructure of neonatal healthcare and a rising demand for technologically advanced incubators. Growing number of cases of adherence to infant mortality and improving NICU facilities in the country are driving the market growth

Government programs that encourage maternal and child well-being and increasing studies related to neonatal treatment also contribute to the market growth. In addition, mobile and portable incubators for emergency transport are also aiding the expansion of the market.

Country CAGR (2025 to 2035)
South Korea 3.9%

Competitive Outlook

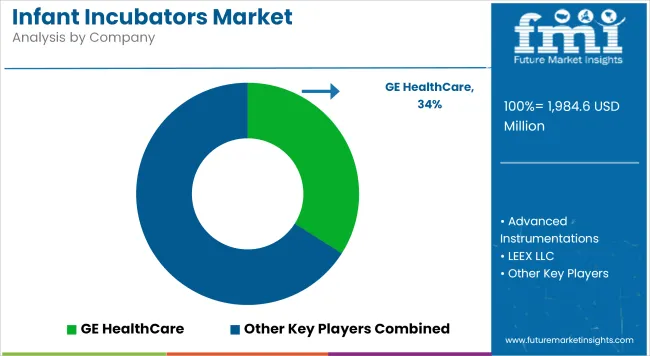
Infant Incubators Market Analysis By Company

The infant incubators market is witnessing growing competition, fueled by rapid innovation and rising demand for advanced neonatal care solutions. Companies are focusing on integrating features like smart monitoring, remote access, and AI-based alert systems to enhance clinical outcomes and differentiate their offerings.

With a clear shift toward compact, energy-efficient and modular designs that cater to diverse healthcare environments, from high-end NICUs to rural clinics. Players are also prioritizing regulatory approvals and clinical trials to fast-track product launches in developed markets.

Strategic collaborations with hospitals and public health agencies are further strengthening market presence. Additionally, bundled service contracts and flexible pricing models are being adopted to secure long-term institutional partnerships and improve retention in an increasingly price-sensitive landscape.

Key Development:

  • In 2025, The FDA has determined that all new neonatal incubators currently supplied in the USA do not release concerning levels of airborne chemicals, thus eliminating the previous recommendation to run them for a week before clinical use, following extensive testing and collaboration with manufacturers like GE HealthCare to mitigate chemical emissions.
  • In 2024, JW Pharmaceutical announced its three "Hi-Mami" childcare devices (incubators) received European Medical Device Certification (CEMDR). This makes Hi-Mami the first Korean incubator brand to achieve CEMDR, a stricter EU medical device regulation. The certification enables JW Pharmaceutical to actively expand its domestic and global market share for its incubators, including a hybrid model that maintains temperature even when open.

Companies

  • GE HealthCare
  • Advanced Instrumentations
  • LEEX LLC
  • International Biomedical
  • Fanem Ltda.
  • Olidef Medical
  • Avante Health Solutions
  • Lionex GmbH
  • Drägerwerk AG & Co. KGaA
  • mOm Incubators Ltd
  • Weyer GmbH
  • Dixion
  • TSE MEDICAL
  • MedCare Visions® GmbH
  • GINEVRI srl
  • KALSTEIN FRANCE
  • Beijing Julongsanyou Technology Co., Ltd.
  • Bistos Co., Ltd.
  • JW Bioscience
  • Jiangsu Aegean Technology Co., Ltd
  • SUZHOU BEING MEDICAL DEVICE CO., LTD
  • Medi Waves Inc.
  • Ningbo David Medical Device Co., Ltd.
  • Heal Force Bio-Meditech Holdings Limited
  • Shenzhen Comen Medical Instruments Co., Ltd
  • Atom Medical Corp
  • XINDRAY International Corp.
  • GPC Medical Ltd.
  • BPL Medical Technologies
  • IndoSurgicals Private Limited
  • S S Technomed (P) Ltd
  • Phoenix Medical Systems
  • AVI Healthcare
  • DELUXE SCIENTIFIC SURGICO PVT LTD
  • Narang Medical Limited
  • TALI MEDICAL
  • ERTUNÇ ÖZCAN
  • Trimpeks
  • Okuman Medikal Sistemler A.Ş
  • Tende

Top Segments Studied in the Infant Incubators Market Research Report

By Product:

  • Standard Incubators
    • Open-Box Incubator
    • Closed-Box Incubator
    • Double-Wall Incubator
  • Transport Incubators

By Modality:

  • Height Adjustable Infant Incubators
  • Fixed Height Infant Incubators

By Technology:

  • Patient Monitors attached Incubators
  • Incubators without Patient Monitors

By End User:

  • Hospital NICU
    • Level 1 NICU
    • Level 2 NICU
    • Level 3 NICU
    • Level 4 NICU
  • Birth Centers
  • Independent Maternity Care Centers
  • Emergency Medical Services

By Region:

  • North America
  • Latin America
  • East Asia
  • South Asia & Pacific
  • Europe
  • Oceania
  • Middle East & Africa

Table of Content

  1. Executive Summary
  2. Industry Introduction, including Taxonomy and Market Definition
  3. Market Trends and Success Factors, including Macro-economic Factors, Market Dynamics, and Recent Industry Developments
  4. Global Market Demand Analysis 2020 to 2024 and Forecast 2025 to 2035, including Historical Analysis and Future Projections
  5. Global Market Analysis 2020 to 2024 and Forecast 2025 to 2035
    • Product
    • End User
  6. Global Market Analysis 2020 to 2024 and Forecast 2025 to 2035, By Product
    • Intensive Care
    • Transport
  7. Global Market Analysis 2020 to 2024 and Forecast 2025 to 2035, By End User
    • Hospitals
    • Pediatric and Neonatal Intensive Care
    • Others
  8. Global Market Analysis 2020 to 2024 and Forecast 2025 to 2035, By Region
    • North America
    • Latin America
    • East Asia
    • South Asia & Pacific
    • Eastern Europe
    • Western Europe
    • Middle East & Africa
  9. North America Sales Analysis 2020 to 2024 and Forecast 2025 to 2035, by Key Segments and Countries
  10. Latin America Sales Analysis 2020 to 2024 and Forecast 2025 to 2035, by Key Segments and Countries
  11. East Asia Sales Analysis 2020 to 2024 and Forecast 2025 to 2035, by Key Segments and Countries
  12. South Asia & Pacific Sales Analysis 2020 to 2024 and Forecast 2025 to 2035, by Key Segments and Countries
  13. Eastern Europe Sales Analysis 2020 to 2024 and Forecast 2025 to 2035, by Key Segments and Countries
  14. Western Europe Sales Analysis 2020 to 2024 and Forecast 2025 to 2035, by Key Segments and Countries
  15. Middle East & Africa Sales Analysis 2020 to 2024 and Forecast 2025 to 2035, by Key Segments and Countries
  16. Sales Forecast 2025 to 2035 by Product and End User for 30 Countries
  17. Competition Outlook, including Market Structure Analysis, Company Share Analysis by Key Players, and Competition Dashboard
  18. Company Profile
    • GE Healthcare
    • Natus Medical Incorporated
    • Inspiration Healthcare Group plc
    • Koninklijke Philips N.V.
    • Drägerwerk AG & Co. KGaA
    • Fisher & Paykel Healthcare
    • International Biomedical Ltd.
    • Atom Medical Corporation
    • Fanem Ltda
    • Novos Medical Systems

List of Tables

  • Table 1: Global Market Value (USD Million) Forecast by Region, 2020 to 2035
  • Table 2: Global Market Volume (Units) Forecast by Region, 2020 to 2035
  • Table 3: Global Market Value (USD Million) Forecast by Product, 2020 to 2035
  • Table 4: Global Market Volume (Units) Forecast by Product, 2020 to 2035
  • Table 5: Global Market Value (USD Million) Forecast by End User, 2020 to 2035
  • Table 6: Global Market Volume (Units) Forecast by End User, 2020 to 2035
  • Table 7: North America Market Value (USD Million) Forecast by Country, 2020 to 2035
  • Table 8: North America Market Volume (Units) Forecast by Country, 2020 to 2035
  • Table 9: North America Market Value (USD Million) Forecast by Product, 2020 to 2035
  • Table 10: North America Market Volume (Units) Forecast by Product, 2020 to 2035
  • Table 11: North America Market Value (USD Million) Forecast by End User, 2020 to 2035
  • Table 12: North America Market Volume (Units) Forecast by End User, 2020 to 2035
  • Table 13: Latin America Market Value (USD Million) Forecast by Country, 2020 to 2035
  • Table 14: Latin America Market Volume (Units) Forecast by Country, 2020 to 2035
  • Table 15: Latin America Market Value (USD Million) Forecast by Product, 2020 to 2035
  • Table 16: Latin America Market Volume (Units) Forecast by Product, 2020 to 2035
  • Table 17: Latin America Market Value (USD Million) Forecast by End User, 2020 to 2035
  • Table 18: Latin America Market Volume (Units) Forecast by End User, 2020 to 2035
  • Table 19: Western Europe Market Value (USD Million) Forecast by Country, 2020 to 2035
  • Table 20: Western Europe Market Volume (Units) Forecast by Country, 2020 to 2035
  • Table 21: Western Europe Market Value (USD Million) Forecast by Product, 2020 to 2035
  • Table 22: Western Europe Market Volume (Units) Forecast by Product, 2020 to 2035
  • Table 23: Western Europe Market Value (USD Million) Forecast by End User, 2020 to 2035
  • Table 24: Western Europe Market Volume (Units) Forecast by End User, 2020 to 2035
  • Table 25: Eastern Europe Market Value (USD Million) Forecast by Country, 2020 to 2035
  • Table 26: Eastern Europe Market Volume (Units) Forecast by Country, 2020 to 2035
  • Table 27: Eastern Europe Market Value (USD Million) Forecast by Product, 2020 to 2035
  • Table 28: Eastern Europe Market Volume (Units) Forecast by Product, 2020 to 2035
  • Table 29: Eastern Europe Market Value (USD Million) Forecast by End User, 2020 to 2035
  • Table 30: Eastern Europe Market Volume (Units) Forecast by End User, 2020 to 2035
  • Table 31: South Asia and Pacific Market Value (USD Million) Forecast by Country, 2020 to 2035
  • Table 32: South Asia and Pacific Market Volume (Units) Forecast by Country, 2020 to 2035
  • Table 33: South Asia and Pacific Market Value (USD Million) Forecast by Product, 2020 to 2035
  • Table 34: South Asia and Pacific Market Volume (Units) Forecast by Product, 2020 to 2035
  • Table 35: South Asia and Pacific Market Value (USD Million) Forecast by End User, 2020 to 2035
  • Table 36: South Asia and Pacific Market Volume (Units) Forecast by End User, 2020 to 2035
  • Table 37: East Asia Market Value (USD Million) Forecast by Country, 2020 to 2035
  • Table 38: East Asia Market Volume (Units) Forecast by Country, 2020 to 2035
  • Table 39: East Asia Market Value (USD Million) Forecast by Product, 2020 to 2035
  • Table 40: East Asia Market Volume (Units) Forecast by Product, 2020 to 2035
  • Table 41: East Asia Market Value (USD Million) Forecast by End User, 2020 to 2035
  • Table 42: East Asia Market Volume (Units) Forecast by End User, 2020 to 2035
  • Table 43: Middle East and Africa Market Value (USD Million) Forecast by Country, 2020 to 2035
  • Table 44: Middle East and Africa Market Volume (Units) Forecast by Country, 2020 to 2035
  • Table 45: Middle East and Africa Market Value (USD Million) Forecast by Product, 2020 to 2035
  • Table 46: Middle East and Africa Market Volume (Units) Forecast by Product, 2020 to 2035
  • Table 47: Middle East and Africa Market Value (USD Million) Forecast by End User, 2020 to 2035
  • Table 48: Middle East and Africa Market Volume (Units) Forecast by End User, 2020 to 2035

List of Figures

  • Figure 1: Global Market Value (USD Million) by Product, 2025 to 2035
  • Figure 2: Global Market Value (USD Million) by End User, 2025 to 2035
  • Figure 3: Global Market Value (USD Million) by Region, 2025 to 2035
  • Figure 4: Global Market Value (USD Million) Analysis by Region, 2020 to 2035
  • Figure 5: Global Market Volume (Units) Analysis by Region, 2020 to 2035
  • Figure 6: Global Market Value Share (%) and BPS Analysis by Region, 2025 to 2035
  • Figure 7: Global Market Y-o-Y Growth (%) Projections by Region, 2025 to 2035
  • Figure 8: Global Market Value (USD Million) Analysis by Product, 2020 to 2035
  • Figure 9: Global Market Volume (Units) Analysis by Product, 2020 to 2035
  • Figure 10: Global Market Value Share (%) and BPS Analysis by Product, 2025 to 2035
  • Figure 11: Global Market Y-o-Y Growth (%) Projections by Product, 2025 to 2035
  • Figure 12: Global Market Value (USD Million) Analysis by End User, 2020 to 2035
  • Figure 13: Global Market Volume (Units) Analysis by End User, 2020 to 2035
  • Figure 14: Global Market Value Share (%) and BPS Analysis by End User, 2025 to 2035
  • Figure 15: Global Market Y-o-Y Growth (%) Projections by End User, 2025 to 2035
  • Figure 16: Global Market Attractiveness by Product, 2025 to 2035
  • Figure 17: Global Market Attractiveness by End User, 2025 to 2035
  • Figure 18: Global Market Attractiveness by Region, 2025 to 2035
  • Figure 19: North America Market Value (USD Million) by Product, 2025 to 2035
  • Figure 20: North America Market Value (USD Million) by End User, 2025 to 2035
  • Figure 21: North America Market Value (USD Million) by Country, 2025 to 2035
  • Figure 22: North America Market Value (USD Million) Analysis by Country, 2020 to 2035
  • Figure 23: North America Market Volume (Units) Analysis by Country, 2020 to 2035
  • Figure 24: North America Market Value Share (%) and BPS Analysis by Country, 2025 to 2035
  • Figure 25: North America Market Y-o-Y Growth (%) Projections by Country, 2025 to 2035
  • Figure 26: North America Market Value (USD Million) Analysis by Product, 2020 to 2035
  • Figure 27: North America Market Volume (Units) Analysis by Product, 2020 to 2035
  • Figure 28: North America Market Value Share (%) and BPS Analysis by Product, 2025 to 2035
  • Figure 29: North America Market Y-o-Y Growth (%) Projections by Product, 2025 to 2035
  • Figure 30: North America Market Value (USD Million) Analysis by End User, 2020 to 2035
  • Figure 31: North America Market Volume (Units) Analysis by End User, 2020 to 2035
  • Figure 32: North America Market Value Share (%) and BPS Analysis by End User, 2025 to 2035
  • Figure 33: North America Market Y-o-Y Growth (%) Projections by End User, 2025 to 2035
  • Figure 34: North America Market Attractiveness by Product, 2025 to 2035
  • Figure 35: North America Market Attractiveness by End User, 2025 to 2035
  • Figure 36: North America Market Attractiveness by Country, 2025 to 2035
  • Figure 37: Latin America Market Value (USD Million) by Product, 2025 to 2035
  • Figure 38: Latin America Market Value (USD Million) by End User, 2025 to 2035
  • Figure 39: Latin America Market Value (USD Million) by Country, 2025 to 2035
  • Figure 40: Latin America Market Value (USD Million) Analysis by Country, 2020 to 2035
  • Figure 41: Latin America Market Volume (Units) Analysis by Country, 2020 to 2035
  • Figure 42: Latin America Market Value Share (%) and BPS Analysis by Country, 2025 to 2035
  • Figure 43: Latin America Market Y-o-Y Growth (%) Projections by Country, 2025 to 2035
  • Figure 44: Latin America Market Value (USD Million) Analysis by Product, 2020 to 2035
  • Figure 45: Latin America Market Volume (Units) Analysis by Product, 2020 to 2035
  • Figure 46: Latin America Market Value Share (%) and BPS Analysis by Product, 2025 to 2035
  • Figure 47: Latin America Market Y-o-Y Growth (%) Projections by Product, 2025 to 2035
  • Figure 48: Latin America Market Value (USD Million) Analysis by End User, 2020 to 2035
  • Figure 49: Latin America Market Volume (Units) Analysis by End User, 2020 to 2035
  • Figure 50: Latin America Market Value Share (%) and BPS Analysis by End User, 2025 to 2035
  • Figure 51: Latin America Market Y-o-Y Growth (%) Projections by End User, 2025 to 2035
  • Figure 52: Latin America Market Attractiveness by Product, 2025 to 2035
  • Figure 53: Latin America Market Attractiveness by End User, 2025 to 2035
  • Figure 54: Latin America Market Attractiveness by Country, 2025 to 2035
  • Figure 55: Western Europe Market Value (USD Million) by Product, 2025 to 2035
  • Figure 56: Western Europe Market Value (USD Million) by End User, 2025 to 2035
  • Figure 57: Western Europe Market Value (USD Million) by Country, 2025 to 2035
  • Figure 58: Western Europe Market Value (USD Million) Analysis by Country, 2020 to 2035
  • Figure 59: Western Europe Market Volume (Units) Analysis by Country, 2020 to 2035
  • Figure 60: Western Europe Market Value Share (%) and BPS Analysis by Country, 2025 to 2035
  • Figure 61: Western Europe Market Y-o-Y Growth (%) Projections by Country, 2025 to 2035
  • Figure 62: Western Europe Market Value (USD Million) Analysis by Product, 2020 to 2035
  • Figure 63: Western Europe Market Volume (Units) Analysis by Product, 2020 to 2035
  • Figure 64: Western Europe Market Value Share (%) and BPS Analysis by Product, 2025 to 2035
  • Figure 65: Western Europe Market Y-o-Y Growth (%) Projections by Product, 2025 to 2035
  • Figure 66: Western Europe Market Value (USD Million) Analysis by End User, 2020 to 2035
  • Figure 67: Western Europe Market Volume (Units) Analysis by End User, 2020 to 2035
  • Figure 68: Western Europe Market Value Share (%) and BPS Analysis by End User, 2025 to 2035
  • Figure 69: Western Europe Market Y-o-Y Growth (%) Projections by End User, 2025 to 2035
  • Figure 70: Western Europe Market Attractiveness by Product, 2025 to 2035
  • Figure 71: Western Europe Market Attractiveness by End User, 2025 to 2035
  • Figure 72: Western Europe Market Attractiveness by Country, 2025 to 2035
  • Figure 73: Eastern Europe Market Value (USD Million) by Product, 2025 to 2035
  • Figure 74: Eastern Europe Market Value (USD Million) by End User, 2025 to 2035
  • Figure 75: Eastern Europe Market Value (USD Million) by Country, 2025 to 2035
  • Figure 76: Eastern Europe Market Value (USD Million) Analysis by Country, 2020 to 2035
  • Figure 77: Eastern Europe Market Volume (Units) Analysis by Country, 2020 to 2035
  • Figure 78: Eastern Europe Market Value Share (%) and BPS Analysis by Country, 2025 to 2035
  • Figure 79: Eastern Europe Market Y-o-Y Growth (%) Projections by Country, 2025 to 2035
  • Figure 80: Eastern Europe Market Value (USD Million) Analysis by Product, 2020 to 2035
  • Figure 81: Eastern Europe Market Volume (Units) Analysis by Product, 2020 to 2035
  • Figure 82: Eastern Europe Market Value Share (%) and BPS Analysis by Product, 2025 to 2035
  • Figure 83: Eastern Europe Market Y-o-Y Growth (%) Projections by Product, 2025 to 2035
  • Figure 84: Eastern Europe Market Value (USD Million) Analysis by End User, 2020 to 2035
  • Figure 85: Eastern Europe Market Volume (Units) Analysis by End User, 2020 to 2035
  • Figure 86: Eastern Europe Market Value Share (%) and BPS Analysis by End User, 2025 to 2035
  • Figure 87: Eastern Europe Market Y-o-Y Growth (%) Projections by End User, 2025 to 2035
  • Figure 88: Eastern Europe Market Attractiveness by Product, 2025 to 2035
  • Figure 89: Eastern Europe Market Attractiveness by End User, 2025 to 2035
  • Figure 90: Eastern Europe Market Attractiveness by Country, 2025 to 2035
  • Figure 91: South Asia and Pacific Market Value (USD Million) by Product, 2025 to 2035
  • Figure 92: South Asia and Pacific Market Value (USD Million) by End User, 2025 to 2035
  • Figure 93: South Asia and Pacific Market Value (USD Million) by Country, 2025 to 2035
  • Figure 94: South Asia and Pacific Market Value (USD Million) Analysis by Country, 2020 to 2035
  • Figure 95: South Asia and Pacific Market Volume (Units) Analysis by Country, 2020 to 2035
  • Figure 96: South Asia and Pacific Market Value Share (%) and BPS Analysis by Country, 2025 to 2035
  • Figure 97: South Asia and Pacific Market Y-o-Y Growth (%) Projections by Country, 2025 to 2035
  • Figure 98: South Asia and Pacific Market Value (USD Million) Analysis by Product, 2020 to 2035
  • Figure 99: South Asia and Pacific Market Volume (Units) Analysis by Product, 2020 to 2035
  • Figure 100: South Asia and Pacific Market Value Share (%) and BPS Analysis by Product, 2025 to 2035
  • Figure 101: South Asia and Pacific Market Y-o-Y Growth (%) Projections by Product, 2025 to 2035
  • Figure 102: South Asia and Pacific Market Value (USD Million) Analysis by End User, 2020 to 2035
  • Figure 103: South Asia and Pacific Market Volume (Units) Analysis by End User, 2020 to 2035
  • Figure 104: South Asia and Pacific Market Value Share (%) and BPS Analysis by End User, 2025 to 2035
  • Figure 105: South Asia and Pacific Market Y-o-Y Growth (%) Projections by End User, 2025 to 2035
  • Figure 106: South Asia and Pacific Market Attractiveness by Product, 2025 to 2035
  • Figure 107: South Asia and Pacific Market Attractiveness by End User, 2025 to 2035
  • Figure 108: South Asia and Pacific Market Attractiveness by Country, 2025 to 2035
  • Figure 109: East Asia Market Value (USD Million) by Product, 2025 to 2035
  • Figure 110: East Asia Market Value (USD Million) by End User, 2025 to 2035
  • Figure 111: East Asia Market Value (USD Million) by Country, 2025 to 2035
  • Figure 112: East Asia Market Value (USD Million) Analysis by Country, 2020 to 2035
  • Figure 113: East Asia Market Volume (Units) Analysis by Country, 2020 to 2035
  • Figure 114: East Asia Market Value Share (%) and BPS Analysis by Country, 2025 to 2035
  • Figure 115: East Asia Market Y-o-Y Growth (%) Projections by Country, 2025 to 2035
  • Figure 116: East Asia Market Value (USD Million) Analysis by Product, 2020 to 2035
  • Figure 117: East Asia Market Volume (Units) Analysis by Product, 2020 to 2035
  • Figure 118: East Asia Market Value Share (%) and BPS Analysis by Product, 2025 to 2035
  • Figure 119: East Asia Market Y-o-Y Growth (%) Projections by Product, 2025 to 2035
  • Figure 120: East Asia Market Value (USD Million) Analysis by End User, 2020 to 2035
  • Figure 121: East Asia Market Volume (Units) Analysis by End User, 2020 to 2035
  • Figure 122: East Asia Market Value Share (%) and BPS Analysis by End User, 2025 to 2035
  • Figure 123: East Asia Market Y-o-Y Growth (%) Projections by End User, 2025 to 2035
  • Figure 124: East Asia Market Attractiveness by Product, 2025 to 2035
  • Figure 125: East Asia Market Attractiveness by End User, 2025 to 2035
  • Figure 126: East Asia Market Attractiveness by Country, 2025 to 2035
  • Figure 127: Middle East and Africa Market Value (USD Million) by Product, 2025 to 2035
  • Figure 128: Middle East and Africa Market Value (USD Million) by End User, 2025 to 2035
  • Figure 129: Middle East and Africa Market Value (USD Million) by Country, 2025 to 2035
  • Figure 130: Middle East and Africa Market Value (USD Million) Analysis by Country, 2020 to 2035
  • Figure 131: Middle East and Africa Market Volume (Units) Analysis by Country, 2020 to 2035
  • Figure 132: Middle East and Africa Market Value Share (%) and BPS Analysis by Country, 2025 to 2035
  • Figure 133: Middle East and Africa Market Y-o-Y Growth (%) Projections by Country, 2025 to 2035
  • Figure 134: Middle East and Africa Market Value (USD Million) Analysis by Product, 2020 to 2035
  • Figure 135: Middle East and Africa Market Volume (Units) Analysis by Product, 2020 to 2035
  • Figure 136: Middle East and Africa Market Value Share (%) and BPS Analysis by Product, 2025 to 2035
  • Figure 137: Middle East and Africa Market Y-o-Y Growth (%) Projections by Product, 2025 to 2035
  • Figure 138: Middle East and Africa Market Value (USD Million) Analysis by End User, 2020 to 2035
  • Figure 139: Middle East and Africa Market Volume (Units) Analysis by End User, 2020 to 2035
  • Figure 140: Middle East and Africa Market Value Share (%) and BPS Analysis by End User, 2025 to 2035
  • Figure 141: Middle East and Africa Market Y-o-Y Growth (%) Projections by End User, 2025 to 2035
  • Figure 142: Middle East and Africa Market Attractiveness by Product, 2025 to 2035
  • Figure 143: Middle East and Africa Market Attractiveness by End User, 2025 to 2035
  • Figure 144: Middle East and Africa Market Attractiveness by Country, 2025 to 2035

Frequently Asked Questions

What was the overall size of the infant incubators market in 2025?

The overall market size for infant incubators market was USD 1,984.6 million in 2025.

How big the infant incubators market is expected in 2035?

The infant incubators market is expected to reach USD 2,937.7 million in 2035.

What will drive the demand for infant incubators market during the forecast period?

Increasing preterm birth rates, advancements in neonatal care technology, and rising investments in healthcare infrastructure will drive market growth.

List the top 5 countries contributing in infant incubators market?

The top 5 countries which drives the development of infant incubators market are USA, European Union, Japan, South Korea and UK.

Which segment in type is expected to lead infant incubators market?

Pediatric & neonatal intensive care units (NICUs) expected to grow to command significant share over the assessment period.

Explore Similar Insights

Future Market Insights

Infant Incubators Market