Interleave Paper Market Size and Share Forecast Outlook 2025 to 2035

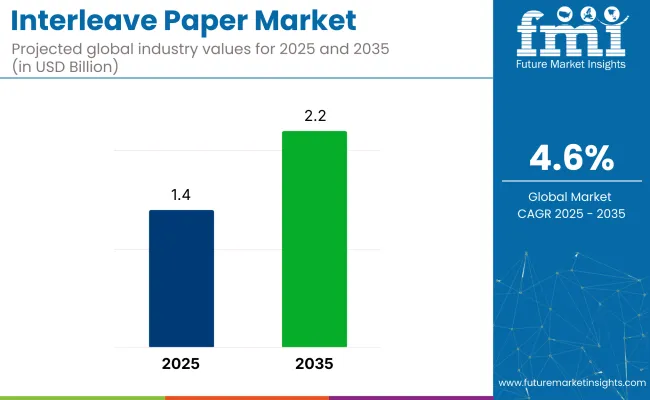
The interleave paper market is forecast to grow from USD 1.4 billion in 2025 to USD 2.2 billion by 2035, reflecting a 4.6% CAGR. Used across food, electronics, and automotive sectors, interleave paper protects goods from abrasion and contamination.
Quick stats of Interleave Paper

  • Market Value (2025): USD 1.4 billion
  • Forecast Value (2035): USD 2.2 billion
  • Forecast CAGR: 4.6%
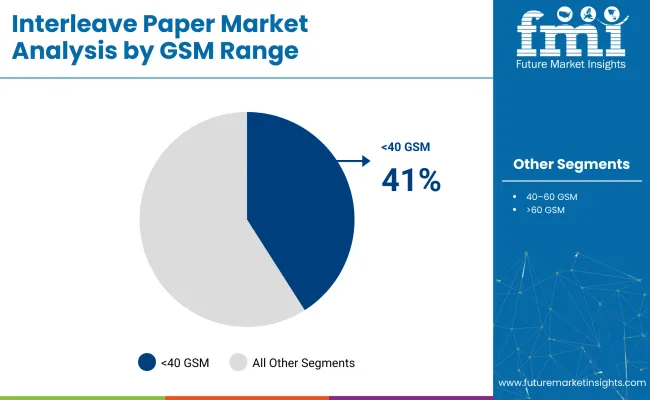
  • Product leader in 2025: <40 GSM interleave paper (41% share)
  • Top distribution channel: B2B industrial converters and direct OEM supply
  • Key growth region: India (fastest-growing country with 4.8% CAGR)
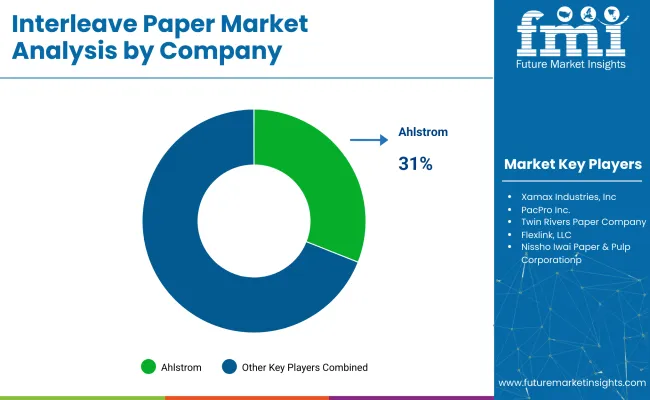
  • Leading player: Ahlstrom (31% share)

Interleave Paper Market

Attribute Detail
Market Size (2025) USD 1.4 billion
Market Size (2035) USD 2.2 billion
CAGR (2025 to 2035) 4.6%

Rising demand for packaged meat, frozen foods, and bakery items has fueled adoption. Increased reliance on recyclable, biodegradable materials, especially paper-based barriers, has aligned with packaging trends that prioritize material efficiency and reduced plastic use. In industrial applications, interleave paper is gaining traction for component wrapping. As processed food consumption and regulatory pressure on plastic grow, interleave paper adoption continues to accelerate globally.

Interleave paper accounts for modest shares across its parent industries due to its specialized use in protective layering and product separation. Within the packaging materials market, it captures around 1.5-2.0%, primarily driven by its role in food, electronics, and metal sheet packaging. In the industrial paper products market, it contributes approximately 2.2%, used in high-volume manufacturing sectors requiring surface protection.

The specialty paper market sees a 3.8% share, as interleave paper falls under customized paper solutions with niche functionality. In the food packaging market, its share reaches about 2.5%, supporting meat, bakery, and frozen food applications. Lastly, within the broader pulp and paper market, interleave paper constitutes less than 1%, given its narrow scope compared to printing, tissue, and containerboard segments.

The interleave paper market is experiencing significant changes as manufacturers enhance product offerings. Mondi has expanded its range of protective interleave films for food packaging with improved durability. Stora Enso now provides specialized papers that meet strict food safety requirements. UPM Specialty Papers offers temperature-resistant options for baked goods, while Ahlstrom and Glatfelter produce medical-grade papers with protective properties.

E-commerce companies increasingly utilize these papers for safeguarding delicate items. The sector faces ongoing challenges from material cost variations and competition from synthetic alternatives. Companies are concentrating on developing stronger, more adaptable paper solutions to address diverse packaging needs in foodservice, healthcare, and industrial applications.

Analyzing Interleave Paper Market by Top Investment Segments

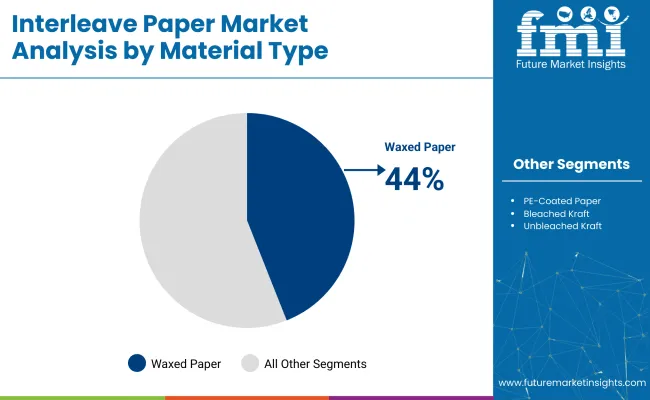
High-speed automation has driven the adoption of low-GSM interleave papers for lamination, wrapping, and separation across sectors. Waxed paper will comprise 44% of usage due to its moisture and grease resistance. Surface protection leads applications with a 58% share, while the metal and glass industries account for 47% of total consumption.

Lightweight Variants Drive Preference for <40 GSM Papers in 2025

Papers below 40 GSM are projected to account for 41% of the global market in 2025, driven by their use in automated lamination, wrapping, and separation of high-volume items. These variants offer easy stackability and facilitate clean detachment in conveyor systems.

In food processing and electronics, such formats enable speed without compromising material integrity. Xamax Industries, Twin Rivers Paper Company, and Hankuk Paper Co. have commercialized low-GSM grades that are compatible with high-speed lines.
  • Twin Rivers offers <40 GSM bakery interleaves for high-speed lines
  • Used in glass and semiconductor interleaving across East Asia
  • Reduces reel weight and storage footprint for bulk packaging converters

Interleave Paper Market Analysis By Gsm Range

Waxed Paper Sees Uptick Due to 44% Material Demand.

Waxed paper is expected to represent 44% of interleave material consumption in 2025. Its appeal lies in its barrier properties-moisture resistance, grease repellence, and temperature stability-making it a go-to option in food, mechanical, and electronic packaging.

Manufacturers such as Kanemo Shoji Co., Nagara Paper Mfg. Co., and Ahlstrom have increased the output of wax-coated grades suited for vacuum packing and manual layering. The non-stick nature also supports repetitive use in automated systems.
  • Ahlstrom supplies waxed paper for deli and frozen applications
  • Kanemo Shoji serves Japan’s seafood packaging sector with waxed liners
  • Waxed formats adopted in electronic product packaging in Southeast Asia

Interleave Paper Market Analysis By Material Type

Surface Protection Will Command 58% of Application Demand

Surface protection is projected to dominate applications with a 58% share in 2025. This demand stems from the need to safeguard processed metals, coated sheets, and precision optics during handling and transit. Interleave paper in this segment ensures the prevention of scratches, dust, and pressure marks.

Companies such as Flexlink LLC, Papierverarbeitungswerk Franz Veit GmbH, and Daio Paper have refined anti-abrasive coatings and anti-static formats tailored to sheet separation tasks. Cold-rolled steel, automotive parts, and laminated glass remain core end-use areas.

  • Flexlink serves European steel distributors with industrial-grade interleave sheets
  • Anti-static surface protection variants are used in South Korean optic exports
  • Glass processing firms in India use protective liners for architectural panels

Metal & Glass Industry Remains Largest End-Use at 47%

Metal and glass applications are expected to make up 47% of interleave paper consumption in 2025. These sectors rely on interleaves for layering polished aluminum, mirror-finished steel, and annealed glass sheets during processing, storage, and shipment.

Suppliers such as Nissho Iwai Paper, PacPro Inc., and RHEINMAGNET deliver format-specific rolls that resist curling and dust adhesion. In the steel industry, papers prevent weld spatter and oxidation, while in the glass sector, they reduce static buildup and breakage during transit.

  • PacPro Inc. exports coil-ready interleaves to North American steel service centers
  • Float glass manufacturers in China deploy layered paper to avoid micro-scratches
  • Used in reflective coating facilities where dust transfer can impact yield

Top Interleave Paper Market Dynamics

The interleave paper sector has been shaped by automation demands, format miniaturization, and coating technology upgrades. Trends reflect rising customization for food, glass, and electronics use cases. Suppliers now focus on thinner gauges, recyclable coatings, and anti-static variants to meet evolving downstream performance expectations.

Coated Variants and Format Customization Define Innovation in 2025

  • Nissho Iwai Paper introduced anti-static papers for high-end optical interleaving.
  • Ahlstrom launched dual-layer waxed sheets for chilled bakery applications
  • PacPro Inc. rolled out pre-sized interleaves for robotic sheet-feeders
  • Papierverarbeitungswerk Franz Veit GmbH developed anti-curl papers for automated stackers
  • Hankuk Paper released reinforced <40 GSM kraft with wet-strength polymers
  • Kanemo Shoji tested soy-wax interleaves for eco-labeled food wraps
  • SDM Magnetics Co. sourced interleave paper with heat-stable coatings for magnet separation.

Format Inconsistency and Moisture Control Challenge Quality Compliance
  • Thickness variation hinders alignment in roll-fed automation
  • Fiber bleed in uncoated sheets impacts food and metal packaging
  • Humidity-induced warping reduces utility in precision stacking systems

Top Countries Manufacturing, Synthesizing, Distributing, and Generating Demand for Interleave Paper

Country Wise Analysis Of Interleave Paper Market

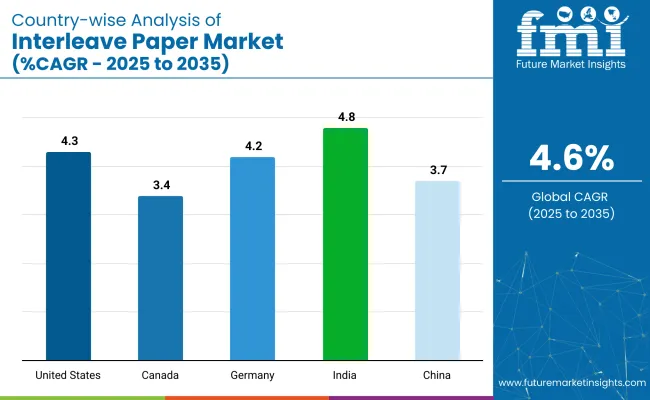
Countries CAGR (2025 to 2035)
United States 4.3%
Canada 3.4%
Germany 4.2%
China 3.7%
India 4.8%

Global demand for interleave paper is projected to grow at a 4.2% CAGR from 2025 to 2035. Among the five profiled markets out of 40 covered, India leads at 4.8%, followed by the United States at 4.3%, Germany at 4.2%, China at 3.7%, and Canada at 3.4%. These growth rates translate to a +14% premium for India, +2% for the United States, and 0% for Germany as the baseline.

China shows a -12% deficit and Canada a -19% deficit compared to the baseline. Divergence in growth is driven by factors such as the fast-growing retail and food sectors in India, strong demand for packaging in the United States, and steady but moderate growth in China and Canada, with Germany exhibiting slow growth due to a more mature market.

The report covers detailed analysis of 40+ countries, with the top five countries shared as a reference.

Growth Outlook of Interleave Paper Market in the United States

A CAGR of 4.3% has been projected for the United States from 2025 to 2035. Demand stems from widespread use in precision packaging, especially for foodservice, meat processing, and electronics. Interleaving in frozen meat processing has been favored due to USDA-sanctioned materials meeting direct-contact safety norms.

Paper converters in the Midwest have scaled operations to serve regional protein-processing clusters. Stainless steel fabricators and optics manufacturers have increased procurement of wax-coated interleaving rolls for scratch-free shipping. Equipment upgrades in secondary packaging lines have been aligned to match interleaving widths.

  • Midwest food processors preferring FDA-compliant bleached interleaving rolls
  • Laser-cut optics protected by silicone-coated interleave for abrasion resistance
  • Contract packagers using auto-sheeting interleaves for frozen meat patties

Future Outlook for Interleave Paper Market in Canada

Canada’s market is forecast to grow at 3.4% CAGR by 2035. Usage has remained concentrated in processed food and pharmaceutical interpackaging, with rising penetration into printing and metal sheet dispatch. Canadian food safety regulations continue to push adoption of food-contact safe interleaving paper, particularly in the poultry and seafood sectors.

Bleached and wax-laminated grades are being used for cheese portioning by Quebec-based dairies. Western Canada’s print media units have shifted to bleached paper interleaves to prevent ink smearing during transport.

  • Seafood exporters deploying interleaves for fillet stacking and ice retention
  • Quebec cheese producers using waxed sheets for cube segmentation
  • Print shops switching to slip-sheeted paper rolls for dry ink handling

In-Depth Analysis of the Interleave Paper Market in Germany

Germany is projected to expand at a CAGR of 4.2% over the forecast period. Interleave paper demand has remained firm across automotive metal coils, consumer electronics, and artisanal meat packaging. With REACH-driven material compliance, usage of acid-free and neutral pH interleaves has increased.

Sheet metal dispatch centers in Bavaria and Saxony have standardized poly-coated paper for coil protection. Small-format food vendors and organic butchers prefer food-grade interleave rolls for contact packaging. Domestic manufacturers are focusing on cellulose-purified substrates to align with EU chemical regulations.

  • Stainless steel coil makers adopting wax-laminated interleave for rust prevention
  • Artisanal butchers favoring food-safe interleaves for direct meat contact
  • Precision machinery parts packed with anti-scuff silicone interleave layers

Demand Forecast for Interleave Paper Market in China

China’s interleave paper market is forecast to grow at 3.7% CAGR through 2035. Packaging of smartphone components, ceramic parts, and printed electronics is driving conversion across eastern manufacturing zones. Guangdong-based auto electronics clusters are sourcing wax-coated interleaves for multi-layer packaging.

Growth in food processing and fresh meat exports has also prompted higher usage of food-grade bleached interleave sheets. Large-format interleave paper rolls have gained traction in metal dispatch, with eastern steel service centers installing precision unwinding systems.

  • Electronics firms in Shenzhen using silicone interleaves for touchscreens
  • Coil exporters wrapping stainless sheets with thick kraft interleave rolls
  • Food processors in Anhui adopting bleached paper for fish fillet layering

Analysis of Interleave Paper Market in India

India is expected to post a 4.8% CAGR by 2035-fastest among profiled countries. Expansion is driven by its processed food sector and rising usage in automotive sheet packaging. Bengaluru and Pune’s electronics hubs have adopted silicone interleave sheets in LED and PCB logistics. Meat processors are using anti-grease kraft interleave rolls for regional and institutional supply chains. Small-format printers and textile exporters have shifted to interleaved rolls to prevent abrasion during shipment.
  • Chennai-based meat units using food-grade kraft sheets for kebab packaging
  • Electronics contract manufacturers integrating silicone rolls for PCB trays
  • Cotton exporters deploying bleached interleave for fabric protection during transit

Leading Interleave Paper Supplier

Interleave Paper Market Analysis By Company

Leading Player - Ahlstrom 31% Market Share

The interleave paper industry is shaped by a fragmented supplier landscape, with established players like Ahlstrom, Xamax Industries, and Twin Rivers Paper Company driving product development. Ahlstrom has launched dual-layer wax-coated sheets designed for food-grade wrapping. Twin Rivers has expanded capacity for lightweight kraft interleaves targeting bakery and glass industries. Nissho Iwai Paper & Pulp Corporation has introduced static-control grades tailored for optics and electronics packaging in Asia.

Emerging suppliers such as Kanemo Shoji, Nagara Paper, and Hankuk Paper are scaling moisture-resistant paper formats through direct collaborations with manufacturers in precision industries. Flexlink and Papierverarbeitungswerk Franz Veit GmbH support European steel clients with dimension-specific formats. Entry barriers include pulp sourcing, coating infrastructure, and regulatory compliance, keeping the interleave paper market regionally fragmented.

Recent Interleave Paper Industry News

  • In January 2025-International Paper secured EU approval to acquire DS Smith for USD 7.2 billion, expanding its specialty and protective paper footprint across Europe. The deal consolidates operations in coated and corrugated substrates for industrial clients.
  • In May 2025-Evonik unveiled its AERODISP® dispersion series, introducing SiO₂/Al₂O₃-based primers that enhance ink adhesion and clarity on coated interleave sheets-targeting food packaging and electronics applications.

Leading Players

  • Xamax Industries, Inc.
  • PacPro Inc.
  • Twin Rivers Paper Company
  • Flexlink, LLC
  • Nissho Iwai Paper & Pulp Corporation
  • Kanemo Shoji Co., Ltd.
  • Nagara Paper Mfg. Co., Ltd.
  • Hankuk Paper Co., Ltd.
  • Ahlstrom
  • Papierverarbeitungswerk Franz Veit GmbH

Interleave Paper Market-Report Scope

Report Attributes Details
Market Size (2025) USD 1.4 billion
Projected Market Size (2035) USD 2.2 billion
CAGR (2025 to 2035) 4.6%
Base Year for Estimation 2024
Historical Period 2020 to 2024
Projections Period 2025 to 2035
Quantitative Units USD billion for value
Material Types Analyzed Waxed Paper, PE-Coated Paper, Bleached Kraft, Unbleached Kraft
GSM Range Analyzed <40 GSM, 40-60 GSM, >60 GSM
Applications Analyzed Metal & Glass Industry (Sheet Separators, Surface Protection), Food Packaging (Meat Interleaves, Bakery Sheets), Electronics (Static Shielding Paper)
End-Use Industries Analyzed Metal Processing, Food Industry, Electronics, Automotive
Regions Covered North America, Europe, Asia-Pacific, Latin America, Middle East & Africa
Countries Covered United States, Canada, Germany, United Kingdom, France, China, India, Japan, South Korea, Brazil, Mexico, UAE, South Africa
Leading Players Xamax Industries, Inc., PacPro Inc., Twin Rivers Paper Company, Flexlink, LLC, Nissho Iwai Paper & Pulp Corporation, Kanemo Shoji Co., Ltd., Nagara Paper Mfg. Co., Ltd., Hankuk Paper Co., Ltd., Ahlstrom, Papierverarbeitungswerk Franz Veit GmbH
Additional Attributes Dollar sales growth by material type, regional demand trends, competitive landscape, pricing strategies, packaging innovations, and supply chain insights.

Key Segments

By Material Type:

The segment includes Waxed Paper, PE-Coated Paper, Bleached Kraft, and Unbleached Kraft.

By GSM Range:

This is categorized into <40 GSM, 40-60 GSM, and >60 GSM.

By Application:

The market includes Metal & Glass Industry (Sheet Separators, Surface Protection), Food Packaging (Meat Interleaves, Bakery Sheets), Electronics (Static Shielding Paper).

By End-Use Industry:

Segmented into Metal Processing, Food Industry, Electronics, and Automotive.

By Region:

Industry dynamics evaluated across North America, Europe, Asia-Pacific, Latin America, and the Middle East & Africa.

Table of Content

  1. Executive Summary
    • Global Market Outlook
    • Demand-side Trends
    • Supply-side Trends
    • Technology Roadmap Analysis
    • Analysis and Recommendations
  2. Market Overview
    • Market Coverage/Taxonomy
    • Market Definition/Scope/Limitations
  3. Market Background
    • Market Dynamics
      • Drivers
      • Restraints
      • Opportunity
      • Trends
    • Scenario Forecast
      • Demand in Optimistic Scenario
      • Demand in Likely Scenario
      • Demand in Conservative Scenario
    • Opportunity Map Analysis
    • Product Life Cycle Analysis
    • Supply Chain Analysis
      • Supply Side Participants and their Roles
        • Producers
        • Mid-Level Participants (Traders/ Agents/ Brokers)
        • Wholesalers and Distributors
      • Value Added and Value Created at Node in the Supply Chain
      • List of Raw Material Suppliers
      • List of Existing and Potential Buyer’s
    • Investment Feasibility Matrix
    • Value Chain Analysis
      • Profit Margin Analysis
      • Wholesalers and Distributors
      • Retailers
    • PESTLE and Porter’s Analysis
    • Regulatory Landscape
      • By Key Regions
      • By Key Countries
    • Regional Parent Market Outlook
    • Production and Consumption Statistics
    • Import and Export Statistics
  4. Global Market Analysis 2020 to 2024 and Forecast, 2025 to 2035
    • Historical Market Size Value (USD Billion) & Volume (KT) Analysis, 2020 to 2024
    • Current and Future Market Size Value (USD Billion) & Volume (KT) Projections, 2025 to 2035
      • Y-o-Y Growth Trend Analysis
      • Absolute $ Opportunity Analysis
  5. Global Market Pricing Analysis 2020 to 2024 and Forecast 2025 to 2035
  6. Global Market Analysis 2020 to 2024 and Forecast 2025 to 2035, By Material Type
    • Introduction/Key Findings
    • Historical Market Size Value (USD Billion) & Volume (KT) Analysis By Material Type, 2020 to 2024
    • Current and Future Market Size Value (USD Billion) & Volume (KT) Analysis and Forecast By Material Type, 2025 to 2035
      • Waxed Paper
      • PE-Coated Paper
      • Carbon Aerogel Films
      • Bleached Kraft
      • Unbleached Kraft
    • Y-o-Y Growth Trend Analysis By Material Type, 2020 to 2024
    • Absolute $ Opportunity Analysis By Material Type, 2025 to 2035
  7. Global Market Analysis 2020 to 2024 and Forecast 2025 to 2035, By GSM Range
    • Introduction/Key Findings
    • Historical Market Size Value (USD Billion) & Volume (KT) Analysis By GSM Range, 2020 to 2024
    • Current and Future Market Size Value (USD Billion) & Volume (KT) Analysis and Forecast By GSM Range, 2025 to 2035
      • <40 GSM
      • 40-60 GSM
      • >60 GSM
    • Y-o-Y Growth Trend Analysis By GSM Range, 2020 to 2024
    • Absolute $ Opportunity Analysis By GSM Range, 2025 to 2035
  8. Global Market Analysis 2020 to 2024 and Forecast 2025 to 2035, By End-use Industry
    • Introduction/Key Findings
    • Historical Market Size Value (USD Billion) & Volume (KT) Analysis By End-use Industry, 2020 to 2024
    • Current and Future Market Size Value (USD Billion) & Volume (KT) Analysis and Forecast By End-use Industry, 2025 to 2035
      • Aerospace & Defense
      • Automotive
      • Construction
      • Electronics
      • Energy & Power
      • Others
    • Y-o-Y Growth Trend Analysis By End-use Industry, 2020 to 2024
    • Absolute $ Opportunity Analysis By End-use Industry, 2025 to 2035
  9. Global Market Analysis 2020 to 2024 and Forecast 2025 to 2035, By Application
    • Introduction/Key Findings
    • Historical Market Size Value (USD Billion) & Volume (KT) Analysis By Application, 2020 to 2024
    • Current and Future Market Size Value (USD Billion) & Volume (KT) Analysis and Forecast By Application, 2025 to 2035
      • Metal & Glass Industry
        • Sheet Separators
        • Surface Protection
      • Food Packaging
        • Meat Interleaves
        • Bakery Sheets
      • Electronics
        • Static Shielding Paper
    • Y-o-Y Growth Trend Analysis By Application, 2020 to 2024
    • Absolute $ Opportunity Analysis By Application, 2025 to 2035
  10. Global Market Analysis 2020 to 2024 and Forecast 2025 to 2035, By End-Use Industry
    • Introduction/Key Findings
    • Historical Market Size Value (USD Billion) & Volume (KT) Analysis By End-Use Industry, 2020 to 2024
    • Current and Future Market Size Value (USD Billion) & Volume (KT) Analysis and Forecast By End-Use Industry, 2025 to 2035
      • Metal Processing
      • Food Industry
      • Electronics
      • Automotive
    • Y-o-Y Growth Trend Analysis By End-Use Industry, 2020 to 2024
    • Absolute $ Opportunity Analysis By End-Use Industry, 2025 to 2035
  11. Global Market Analysis 2020 to 2024 and Forecast 2025 to 2035, By Region
    • Introduction
    • Historical Market Size Value (USD Billion) & Volume (KT) Analysis By Region, 2020 to 2024
    • Current Market Size Value (USD Billion) & Volume (KT) Analysis and Forecast By Region, 2025 to 2035
      • North America
      • Latin America
      • Western Europe
      • Eastern Europe
      • East Asia
      • South Asia & Pacific
      • Middle East and Africa
    • Market Attractiveness Analysis By Region
  12. North America Market Analysis 2020 to 2024 and Forecast 2025 to 2035, By Country
    • Historical Market Size Value (USD Billion) & Volume (KT) Trend Analysis By Market Taxonomy, 2020 to 2024
    • Market Size Value (USD Billion) & Volume (KT) Forecast By Market Taxonomy, 2025 to 2035
      • By Country
        • USA
        • Canada
        • Mexico
      • By Material Type
      • By GSM Range
      • By End-use Industry
      • By Application
      • By End-Use Industry
    • Market Attractiveness Analysis
      • By Country
      • By Material Type
      • By GSM Range
      • By End-use Industry
      • By Application
      • By End-Use Industry
    • Key Takeaways
  13. Latin America Market Analysis 2020 to 2024 and Forecast 2025 to 2035, By Country
    • Historical Market Size Value (USD Billion) & Volume (KT) Trend Analysis By Market Taxonomy, 2020 to 2024
    • Market Size Value (USD Billion) & Volume (KT) Forecast By Market Taxonomy, 2025 to 2035
      • By Country
        • Brazil
        • Argentina
        • Rest of LATAM
      • By Material Type
      • By GSM Range
      • By End-use Industry
      • By Application
      • By End-Use Industry
    • Market Attractiveness Analysis
      • By Country
      • By Material Type
      • By GSM Range
      • By End-use Industry
      • By Application
      • By End-Use Industry
    • Key Takeaways
  14. Western Europe Market Analysis 2020 to 2024 and Forecast 2025 to 2035, By Country
    • Historical Market Size Value (USD Billion) & Volume (KT) Trend Analysis By Market Taxonomy, 2020 to 2024
    • Market Size Value (USD Billion) & Volume (KT) Forecast By Market Taxonomy, 2025 to 2035
      • By Country
        • Germany
        • Italy
        • France
        • UK
        • Spain
        • BENELUX
        • Nordic
        • Rest of W.Europe
      • By Material Type
      • By GSM Range
      • By End-use Industry
      • By Application
      • By End-Use Industry
    • Market Attractiveness Analysis
      • By Country
      • By Material Type
      • By GSM Range
      • By End-use Industry
      • By Application
      • By End-Use Industry
    • Key Takeaways
  15. Eastern Europe Market Analysis 2020 to 2024 and Forecast 2025 to 2035, By Country
    • Historical Market Size Value (USD Billion) & Volume (KT) Trend Analysis By Market Taxonomy, 2020 to 2024
    • Market Size Value (USD Billion) & Volume (KT) Forecast By Market Taxonomy, 2025 to 2035
      • By Country
        • Russia
        • Hungary
        • Poland
        • Balkan & Baltics
        • Rest of E. Europe
      • By Material Type
      • By GSM Range
      • By End-use Industry
      • By Application
      • By End-Use Industry
    • Market Attractiveness Analysis
      • By Country
      • By Material Type
      • By GSM Range
      • By End-use Industry
      • By Application
      • By End-Use Industry
    • Key Takeaways
  16. East Asia Market Analysis 2020 to 2024 and Forecast 2025 to 2035, By Country
    • Historical Market Size Value (USD Billion) & Volume (KT) Trend Analysis By Market Taxonomy, 2020 to 2024
    • Market Size Value (USD Billion) & Volume (KT) Forecast By Market Taxonomy, 2025 to 2035
      • By Country
        • China
        • Japan
        • South Korea
      • By Material Type
      • By GSM Range
      • By End-use Industry
      • By Application
      • By End-Use Industry
    • Market Attractiveness Analysis
      • By Country
      • By Material Type
      • By GSM Range
      • By End-use Industry
      • By Application
      • By End-Use Industry
    • Key Takeaways
  17. South Asia & Pacific Market Analysis 2020 to 2024 and Forecast 2025 to 2035, By Country
    • Historical Market Size Value (USD Billion) & Volume (KT) Trend Analysis By Market Taxonomy, 2020 to 2024
    • Market Size Value (USD Billion) & Volume (KT) Forecast By Market Taxonomy, 2025 to 2035
      • By Country
        • India
        • Australia & New Zealand
        • ASEAN
        • Rest of SAP
      • By Material Type
      • By GSM Range
      • By End-use Industry
      • By Application
      • By End-Use Industry
    • Market Attractiveness Analysis
      • By Country
      • By Material Type
      • By GSM Range
      • By End-use Industry
      • By Application
      • By End-Use Industry
    • Key Takeaways
  18. Middle East and Africa Market Analysis 2020 to 2024 and Forecast 2025 to 2035, By Country
    • Historical Market Size Value (USD Billion) & Volume (KT) Trend Analysis By Market Taxonomy, 2020 to 2024
    • Market Size Value (USD Billion) & Volume (KT) Forecast By Market Taxonomy, 2025 to 2035
      • By Country
        • GCC Countries
        • Northern Africa
        • South Africa
        • Turkiye
        • Rest of MEA
      • By Material Type
      • By GSM Range
      • By End-use Industry
      • By Application
      • By End-Use Industry
    • Market Attractiveness Analysis
      • By Country
      • By Material Type
      • By GSM Range
      • By End-use Industry
      • By Application
      • By End-Use Industry
    • Key Takeaways
  19. Key Countries Market Analysis
    • USA
      • Pricing Analysis
      • Market Share Analysis, 2024
        • By Material Type
        • By GSM Range
        • By End-use Industry
        • By Application
        • By End-Use Industry
    • Canada
      • Pricing Analysis
      • Market Share Analysis, 2024
        • By Material Type
        • By GSM Range
        • By End-use Industry
        • By Application
        • By End-Use Industry
    • Brazil
      • Pricing Analysis
      • Market Share Analysis, 2024
        • By Material Type
        • By GSM Range
        • By End-use Industry
        • By Application
        • By End-Use Industry
    • Mexico
      • Pricing Analysis
      • Market Share Analysis, 2024
        • By Material Type
        • By GSM Range
        • By End-use Industry
        • By Application
        • By End-Use Industry
    • Argentina
      • Pricing Analysis
      • Market Share Analysis, 2024
        • By Material Type
        • By GSM Range
        • By End-use Industry
        • By Application
        • By End-Use Industry
  20. Market Structure Analysis
    • Competition Dashboard
    • Competition Benchmarking
    • Market Share Analysis of Top Players
      • By Regional
      • By Material Type
      • By GSM Range
      • By End-use Industry
      • By Application
      • By End-Use Industry
  21. Competition Analysis
    • Competition Deep Dive
      • PacPro Inc.
        • Overview
        • Product Portfolio
        • Profitability by Market Segments (Product/Age /Sales Channel/Region)
        • Sales Footprint
        • Strategy Overview
          • Marketing Strategy
          • Product Strategy
          • Channel Strategy
      • Twin Rivers Paper Company
        • Overview
        • Product Portfolio
        • Profitability by Market Segments (Product/Age /Sales Channel/Region)
        • Sales Footprint
        • Strategy Overview
          • Marketing Strategy
          • Product Strategy
          • Channel Strategy
      • Xamax Industries, Inc.
        • Overview
        • Product Portfolio
        • Profitability by Market Segments (Product/Age /Sales Channel/Region)
        • Sales Footprint
        • Strategy Overview
          • Marketing Strategy
          • Product Strategy
          • Channel Strategy
      • Flexlink, LLC
        • Overview
        • Product Portfolio
        • Profitability by Market Segments (Product/Age /Sales Channel/Region)
        • Sales Footprint
        • Strategy Overview
          • Marketing Strategy
          • Product Strategy
          • Channel Strategy
      • Nissho Iwai Paper & Pulp Corporation
        • Overview
        • Product Portfolio
        • Profitability by Market Segments (Product/Age /Sales Channel/Region)
        • Sales Footprint
        • Strategy Overview
          • Marketing Strategy
          • Product Strategy
          • Channel Strategy
      • Kanemo Shoji Co., Ltd.
        • Overview
        • Product Portfolio
        • Profitability by Market Segments (Product/Age /Sales Channel/Region)
        • Sales Footprint
        • Strategy Overview
          • Marketing Strategy
          • Product Strategy
          • Channel Strategy
      • Nagara Paper Mfg. Co., Ltd.
        • Overview
        • Product Portfolio
        • Profitability by Market Segments (Product/Age /Sales Channel/Region)
        • Sales Footprint
        • Strategy Overview
          • Marketing Strategy
          • Product Strategy
          • Channel Strategy
      • Hankuk Paper Co., Ltd.
        • Overview
        • Product Portfolio
        • Profitability by Market Segments (Product/Age /Sales Channel/Region)
        • Sales Footprint
        • Strategy Overview
          • Marketing Strategy
          • Product Strategy
          • Channel Strategy
      • Ahlstrom
        • Overview
        • Product Portfolio
        • Profitability by Market Segments (Product/Age /Sales Channel/Region)
        • Sales Footprint
        • Strategy Overview
          • Marketing Strategy
          • Product Strategy
          • Channel Strategy
      • Papierverarbeitungswerk Franz Veit GmbH
        • Overview
        • Product Portfolio
        • Profitability by Market Segments (Product/Age /Sales Channel/Region)
        • Sales Footprint
        • Strategy Overview
          • Marketing Strategy
          • Product Strategy
          • Channel Strategy
  22. Assumptions & Acronyms Used
  23. Research Methodology

List of Tables

  • Table 1: Global Value (USD Billion) Forecast by Region, 2020-2035
  • Table 2: Global Volume (KT) Forecast by Region, 2020-2035
  • Table 3: Global Value (USD Billion) Forecast by Material Type, 2020-2035
  • Table 4: Global Volume (KT) Forecast by Material Type, 2020-2035
  • Table 5: Global Value (USD Billion) Forecast by GSM Range, 2020-2035
  • Table 6: Global Volume (KT) Forecast by GSM Range, 2020-2035
  • Table 7: Global Value (USD Billion) Forecast by End-use Industry, 2020-2035
  • Table 8: Global Volume (KT) Forecast by End-use Industry, 2020-2035
  • Table 9: Global Value (USD Billion) Forecast by Application, 2020-2035
  • Table 10: Global Volume (KT) Forecast by Application, 2020-2035
  • Table 11: Global Value (USD Billion) Forecast by End-Use Industry, 2020-2035
  • Table 12: Global Volume (KT) Forecast by End-Use Industry, 2020-2035
  • Table 13: North America Value (USD Billion) Forecast by Country, 2020-2035
  • Table 14: North America Volume (KT) Forecast by Country, 2020-2035
  • Table 15: North America Value (USD Billion) Forecast by Material Type, 2020-2035
  • Table 16: North America Volume (KT) Forecast by Material Type, 2020-2035
  • Table 17: North America Value (USD Billion) Forecast by GSM Range, 2020-2035
  • Table 18: North America Volume (KT) Forecast by GSM Range, 2020-2035
  • Table 19: North America Value (USD Billion) Forecast by End-use Industry, 2020-2035
  • Table 20: North America Volume (KT) Forecast by End-use Industry, 2020-2035
  • Table 21: North America Value (USD Billion) Forecast by Application, 2020-2035
  • Table 22: North America Volume (KT) Forecast by Application, 2020-2035
  • Table 23: North America Value (USD Billion) Forecast by End-Use Industry, 2020-2035
  • Table 24: North America Volume (KT) Forecast by End-Use Industry, 2020-2035
  • Table 25: Latin America Value (USD Billion) Forecast by Country, 2020-2035
  • Table 26: Latin America Volume (KT) Forecast by Country, 2020-2035
  • Table 27: Latin America Value (USD Billion) Forecast by Material Type, 2020-2035
  • Table 28: Latin America Volume (KT) Forecast by Material Type, 2020-2035
  • Table 29: Latin America Value (USD Billion) Forecast by GSM Range, 2020-2035
  • Table 30: Latin America Volume (KT) Forecast by GSM Range, 2020-2035
  • Table 31: Latin America Value (USD Billion) Forecast by End-use Industry, 2020-2035
  • Table 32: Latin America Volume (KT) Forecast by End-use Industry, 2020-2035
  • Table 33: Latin America Value (USD Billion) Forecast by Application, 2020-2035
  • Table 34: Latin America Volume (KT) Forecast by Application, 2020-2035
  • Table 35: Latin America Value (USD Billion) Forecast by End-Use Industry, 2020-2035
  • Table 36: Latin America Volume (KT) Forecast by End-Use Industry, 2020-2035
  • Table 37: Western Europe Value (USD Billion) Forecast by Country, 2020-2035
  • Table 38: Western Europe Volume (KT) Forecast by Country, 2020-2035
  • Table 39: Western Europe Value (USD Billion) Forecast by Material Type, 2020-2035
  • Table 40: Western Europe Volume (KT) Forecast by Material Type, 2020-2035
  • Table 41: Western Europe Value (USD Billion) Forecast by GSM Range, 2020-2035
  • Table 42: Western Europe Volume (KT) Forecast by GSM Range, 2020-2035
  • Table 43: Western Europe Value (USD Billion) Forecast by End-use Industry, 2020-2035
  • Table 44: Western Europe Volume (KT) Forecast by End-use Industry, 2020-2035
  • Table 45: Western Europe Value (USD Billion) Forecast by Application, 2020-2035
  • Table 46: Western Europe Volume (KT) Forecast by Application, 2020-2035
  • Table 47: Western Europe Value (USD Billion) Forecast by End-Use Industry, 2020-2035
  • Table 48: Western Europe Volume (KT) Forecast by End-Use Industry, 2020-2035
  • Table 49: Eastern Europe Value (USD Billion) Forecast by Country, 2020-2035
  • Table 50: Eastern Europe Volume (KT) Forecast by Country, 2020-2035
  • Table 51: Eastern Europe Value (USD Billion) Forecast by Material Type, 2020-2035
  • Table 52: Eastern Europe Volume (KT) Forecast by Material Type, 2020-2035
  • Table 53: Eastern Europe Value (USD Billion) Forecast by GSM Range, 2020-2035
  • Table 54: Eastern Europe Volume (KT) Forecast by GSM Range, 2020-2035
  • Table 55: Eastern Europe Value (USD Billion) Forecast by End-use Industry, 2020-2035
  • Table 56: Eastern Europe Volume (KT) Forecast by End-use Industry, 2020-2035
  • Table 57: Eastern Europe Value (USD Billion) Forecast by Application, 2020-2035
  • Table 58: Eastern Europe Volume (KT) Forecast by Application, 2020-2035
  • Table 59: Eastern Europe Value (USD Billion) Forecast by End-Use Industry, 2020-2035
  • Table 60: Eastern Europe Volume (KT) Forecast by End-Use Industry, 2020-2035
  • Table 61: East Asia Value (USD Billion) Forecast by Country, 2020-2035
  • Table 62: East Asia Volume (KT) Forecast by Country, 2020-2035
  • Table 63: East Asia Value (USD Billion) Forecast by Material Type, 2020-2035
  • Table 64: East Asia Volume (KT) Forecast by Material Type, 2020-2035
  • Table 65: East Asia Value (USD Billion) Forecast by GSM Range, 2020-2035
  • Table 66: East Asia Volume (KT) Forecast by GSM Range, 2020-2035
  • Table 67: East Asia Value (USD Billion) Forecast by End-use Industry, 2020-2035
  • Table 68: East Asia Volume (KT) Forecast by End-use Industry, 2020-2035
  • Table 69: East Asia Value (USD Billion) Forecast by Application, 2020-2035
  • Table 70: East Asia Volume (KT) Forecast by Application, 2020-2035
  • Table 71: East Asia Value (USD Billion) Forecast by End-Use Industry, 2020-2035
  • Table 72: East Asia Volume (KT) Forecast by End-Use Industry, 2020-2035
  • Table 73: South Asia & Pacific Value (USD Billion) Forecast by Country, 2020-2035
  • Table 74: South Asia & Pacific Volume (KT) Forecast by Country, 2020-2035
  • Table 75: South Asia & Pacific Value (USD Billion) Forecast by Material Type, 2020-2035
  • Table 76: South Asia & Pacific Volume (KT) Forecast by Material Type, 2020-2035
  • Table 77: South Asia & Pacific Value (USD Billion) Forecast by GSM Range, 2020-2035
  • Table 78: South Asia & Pacific Volume (KT) Forecast by GSM Range, 2020-2035
  • Table 79: South Asia & Pacific Value (USD Billion) Forecast by End-use Industry, 2020-2035
  • Table 80: South Asia & Pacific Volume (KT) Forecast by End-use Industry, 2020-2035
  • Table 81: South Asia & Pacific Value (USD Billion) Forecast by Application, 2020-2035
  • Table 82: South Asia & Pacific Volume (KT) Forecast by Application, 2020-2035
  • Table 83: South Asia & Pacific Value (USD Billion) Forecast by End-Use Industry, 2020-2035
  • Table 84: South Asia & Pacific Volume (KT) Forecast by End-Use Industry, 2020-2035
  • Table 85: Middle East and Africa Value (USD Billion) Forecast by Country, 2020-2035
  • Table 86: Middle East and Africa Volume (KT) Forecast by Country, 2020-2035
  • Table 87: Middle East and Africa Value (USD Billion) Forecast by Material Type, 2020-2035
  • Table 88: Middle East and Africa Volume (KT) Forecast by Material Type, 2020-2035
  • Table 89: Middle East and Africa Value (USD Billion) Forecast by GSM Range, 2020-2035
  • Table 90: Middle East and Africa Volume (KT) Forecast by GSM Range, 2020-2035
  • Table 91: Middle East and Africa Value (USD Billion) Forecast by End-use Industry, 2020-2035
  • Table 92: Middle East and Africa Volume (KT) Forecast by End-use Industry, 2020-2035
  • Table 93: Middle East and Africa Value (USD Billion) Forecast by Application, 2020-2035
  • Table 94: Middle East and Africa Volume (KT) Forecast by Application, 2020-2035
  • Table 95: Middle East and Africa Value (USD Billion) Forecast by End-Use Industry, 2020-2035
  • Table 96: Middle East and Africa Volume (KT) Forecast by End-Use Industry, 2020-2035

List of Figures

  • Figure 1: Global Market Volume (KT) Forecast 2020-2035
  • Figure 2: Global Market Pricing Analysis
  • Figure 3: Global Market Value (USD Billion) Forecast 2020-2035
  • Figure 4: Global Market Value Share and BPS Analysis by Material Type, 2025 and 2035
  • Figure 5: Global Market Y-o-Y Growth Comparison by Material Type, 2025-2035
  • Figure 6: Global Market Attractiveness Analysis by Material Type
  • Figure 7: Global Market Value Share and BPS Analysis by GSM Range, 2025 and 2035
  • Figure 8: Global Market Y-o-Y Growth Comparison by GSM Range, 2025-2035
  • Figure 9: Global Market Attractiveness Analysis by GSM Range
  • Figure 10: Global Market Value Share and BPS Analysis by End-use Industry, 2025 and 2035
  • Figure 11: Global Market Y-o-Y Growth Comparison by End-use Industry, 2025-2035
  • Figure 12: Global Market Attractiveness Analysis by End-use Industry
  • Figure 13: Global Market Value Share and BPS Analysis by Application, 2025 and 2035
  • Figure 14: Global Market Y-o-Y Growth Comparison by Application, 2025-2035
  • Figure 15: Global Market Attractiveness Analysis by Application
  • Figure 16: Global Market Value Share and BPS Analysis by End-Use Industry, 2025 and 2035
  • Figure 17: Global Market Y-o-Y Growth Comparison by End-Use Industry, 2025-2035
  • Figure 18: Global Market Attractiveness Analysis by End-Use Industry
  • Figure 19: Global Market Value (USD Billion) Share and BPS Analysis by Region, 2025 and 2035
  • Figure 20: Global Market Y-o-Y Growth Comparison by Region, 2025-2035
  • Figure 21: Global Market Attractiveness Analysis by Region
  • Figure 22: North America Market Incremental $ Opportunity, 2025-2035
  • Figure 23: Latin America Market Incremental $ Opportunity, 2025-2035
  • Figure 24: Western Europe Market Incremental $ Opportunity, 2025-2035
  • Figure 25: Eastern Europe Market Incremental $ Opportunity, 2025-2035
  • Figure 26: East Asia Market Incremental $ Opportunity, 2025-2035
  • Figure 27: South Asia & Pacific Market Incremental $ Opportunity, 2025-2035
  • Figure 28: Middle East and Africa Market Incremental $ Opportunity, 2025-2035
  • Figure 29: North America Market Value Share and BPS Analysis by Country, 2025 and 2035
  • Figure 30: North America Market Value Share and BPS Analysis by Material Type, 2025 and 2035
  • Figure 31: North America Market Y-o-Y Growth Comparison by Material Type, 2025-2035
  • Figure 32: North America Market Attractiveness Analysis by Material Type
  • Figure 33: North America Market Value Share and BPS Analysis by GSM Range, 2025 and 2035
  • Figure 34: North America Market Y-o-Y Growth Comparison by GSM Range, 2025-2035
  • Figure 35: North America Market Attractiveness Analysis by GSM Range
  • Figure 36: North America Market Value Share and BPS Analysis by End-use Industry, 2025 and 2035
  • Figure 37: North America Market Y-o-Y Growth Comparison by End-use Industry, 2025-2035
  • Figure 38: North America Market Attractiveness Analysis by End-use Industry
  • Figure 39: North America Market Value Share and BPS Analysis by Application, 2025 and 2035
  • Figure 40: North America Market Y-o-Y Growth Comparison by Application, 2025-2035
  • Figure 41: North America Market Attractiveness Analysis by Application
  • Figure 42: North America Market Value Share and BPS Analysis by End-Use Industry, 2025 and 2035
  • Figure 43: North America Market Y-o-Y Growth Comparison by End-Use Industry, 2025-2035
  • Figure 44: North America Market Attractiveness Analysis by End-Use Industry
  • Figure 45: Latin America Market Value Share and BPS Analysis by Country, 2025 and 2035
  • Figure 46: Latin America Market Value Share and BPS Analysis by Material Type, 2025 and 2035
  • Figure 47: Latin America Market Y-o-Y Growth Comparison by Material Type, 2025-2035
  • Figure 48: Latin America Market Attractiveness Analysis by Material Type
  • Figure 49: Latin America Market Value Share and BPS Analysis by GSM Range, 2025 and 2035
  • Figure 50: Latin America Market Y-o-Y Growth Comparison by GSM Range, 2025-2035
  • Figure 51: Latin America Market Attractiveness Analysis by GSM Range
  • Figure 52: Latin America Market Value Share and BPS Analysis by End-use Industry, 2025 and 2035
  • Figure 53: Latin America Market Y-o-Y Growth Comparison by End-use Industry, 2025-2035
  • Figure 54: Latin America Market Attractiveness Analysis by End-use Industry
  • Figure 55: Latin America Market Value Share and BPS Analysis by Application, 2025 and 2035
  • Figure 56: Latin America Market Y-o-Y Growth Comparison by Application, 2025-2035
  • Figure 57: Latin America Market Attractiveness Analysis by Application
  • Figure 58: Latin America Market Value Share and BPS Analysis by End-Use Industry, 2025 and 2035
  • Figure 59: Latin America Market Y-o-Y Growth Comparison by End-Use Industry, 2025-2035
  • Figure 60: Latin America Market Attractiveness Analysis by End-Use Industry
  • Figure 61: Western Europe Market Value Share and BPS Analysis by Country, 2025 and 2035
  • Figure 62: Western Europe Market Value Share and BPS Analysis by Material Type, 2025 and 2035
  • Figure 63: Western Europe Market Y-o-Y Growth Comparison by Material Type, 2025-2035
  • Figure 64: Western Europe Market Attractiveness Analysis by Material Type
  • Figure 65: Western Europe Market Value Share and BPS Analysis by GSM Range, 2025 and 2035
  • Figure 66: Western Europe Market Y-o-Y Growth Comparison by GSM Range, 2025-2035
  • Figure 67: Western Europe Market Attractiveness Analysis by GSM Range
  • Figure 68: Western Europe Market Value Share and BPS Analysis by End-use Industry, 2025 and 2035
  • Figure 69: Western Europe Market Y-o-Y Growth Comparison by End-use Industry, 2025-2035
  • Figure 70: Western Europe Market Attractiveness Analysis by End-use Industry
  • Figure 71: Western Europe Market Value Share and BPS Analysis by Application, 2025 and 2035
  • Figure 72: Western Europe Market Y-o-Y Growth Comparison by Application, 2025-2035
  • Figure 73: Western Europe Market Attractiveness Analysis by Application
  • Figure 74: Western Europe Market Value Share and BPS Analysis by End-Use Industry, 2025 and 2035
  • Figure 75: Western Europe Market Y-o-Y Growth Comparison by End-Use Industry, 2025-2035
  • Figure 76: Western Europe Market Attractiveness Analysis by End-Use Industry
  • Figure 77: Eastern Europe Market Value Share and BPS Analysis by Country, 2025 and 2035
  • Figure 78: Eastern Europe Market Value Share and BPS Analysis by Material Type, 2025 and 2035
  • Figure 79: Eastern Europe Market Y-o-Y Growth Comparison by Material Type, 2025-2035
  • Figure 80: Eastern Europe Market Attractiveness Analysis by Material Type
  • Figure 81: Eastern Europe Market Value Share and BPS Analysis by GSM Range, 2025 and 2035
  • Figure 82: Eastern Europe Market Y-o-Y Growth Comparison by GSM Range, 2025-2035
  • Figure 83: Eastern Europe Market Attractiveness Analysis by GSM Range
  • Figure 84: Eastern Europe Market Value Share and BPS Analysis by End-use Industry, 2025 and 2035
  • Figure 85: Eastern Europe Market Y-o-Y Growth Comparison by End-use Industry, 2025-2035
  • Figure 86: Eastern Europe Market Attractiveness Analysis by End-use Industry
  • Figure 87: Eastern Europe Market Value Share and BPS Analysis by Application, 2025 and 2035
  • Figure 88: Eastern Europe Market Y-o-Y Growth Comparison by Application, 2025-2035
  • Figure 89: Eastern Europe Market Attractiveness Analysis by Application
  • Figure 90: Eastern Europe Market Value Share and BPS Analysis by End-Use Industry, 2025 and 2035
  • Figure 91: Eastern Europe Market Y-o-Y Growth Comparison by End-Use Industry, 2025-2035
  • Figure 92: Eastern Europe Market Attractiveness Analysis by End-Use Industry
  • Figure 93: East Asia Market Value Share and BPS Analysis by Country, 2025 and 2035
  • Figure 94: East Asia Market Value Share and BPS Analysis by Material Type, 2025 and 2035
  • Figure 95: East Asia Market Y-o-Y Growth Comparison by Material Type, 2025-2035
  • Figure 96: East Asia Market Attractiveness Analysis by Material Type
  • Figure 97: East Asia Market Value Share and BPS Analysis by GSM Range, 2025 and 2035
  • Figure 98: East Asia Market Y-o-Y Growth Comparison by GSM Range, 2025-2035
  • Figure 99: East Asia Market Attractiveness Analysis by GSM Range
  • Figure 100: East Asia Market Value Share and BPS Analysis by End-use Industry, 2025 and 2035
  • Figure 101: East Asia Market Y-o-Y Growth Comparison by End-use Industry, 2025-2035
  • Figure 102: East Asia Market Attractiveness Analysis by End-use Industry
  • Figure 103: East Asia Market Value Share and BPS Analysis by Application, 2025 and 2035
  • Figure 104: East Asia Market Y-o-Y Growth Comparison by Application, 2025-2035
  • Figure 105: East Asia Market Attractiveness Analysis by Application
  • Figure 106: East Asia Market Value Share and BPS Analysis by End-Use Industry, 2025 and 2035
  • Figure 107: East Asia Market Y-o-Y Growth Comparison by End-Use Industry, 2025-2035
  • Figure 108: East Asia Market Attractiveness Analysis by End-Use Industry
  • Figure 109: South Asia & Pacific Market Value Share and BPS Analysis by Country, 2025 and 2035
  • Figure 110: South Asia & Pacific Market Value Share and BPS Analysis by Material Type, 2025 and 2035
  • Figure 111: South Asia & Pacific Market Y-o-Y Growth Comparison by Material Type, 2025-2035
  • Figure 112: South Asia & Pacific Market Attractiveness Analysis by Material Type
  • Figure 113: South Asia & Pacific Market Value Share and BPS Analysis by GSM Range, 2025 and 2035
  • Figure 114: South Asia & Pacific Market Y-o-Y Growth Comparison by GSM Range, 2025-2035
  • Figure 115: South Asia & Pacific Market Attractiveness Analysis by GSM Range
  • Figure 116: South Asia & Pacific Market Value Share and BPS Analysis by End-use Industry, 2025 and 2035
  • Figure 117: South Asia & Pacific Market Y-o-Y Growth Comparison by End-use Industry, 2025-2035
  • Figure 118: South Asia & Pacific Market Attractiveness Analysis by End-use Industry
  • Figure 119: South Asia & Pacific Market Value Share and BPS Analysis by Application, 2025 and 2035
  • Figure 120: South Asia & Pacific Market Y-o-Y Growth Comparison by Application, 2025-2035
  • Figure 121: South Asia & Pacific Market Attractiveness Analysis by Application
  • Figure 122: South Asia & Pacific Market Value Share and BPS Analysis by End-Use Industry, 2025 and 2035
  • Figure 123: South Asia & Pacific Market Y-o-Y Growth Comparison by End-Use Industry, 2025-2035
  • Figure 124: South Asia & Pacific Market Attractiveness Analysis by End-Use Industry
  • Figure 125: Middle East and Africa Market Value Share and BPS Analysis by Country, 2025 and 2035
  • Figure 126: Middle East and Africa Market Value Share and BPS Analysis by Material Type, 2025 and 2035
  • Figure 127: Middle East and Africa Market Y-o-Y Growth Comparison by Material Type, 2025-2035
  • Figure 128: Middle East and Africa Market Attractiveness Analysis by Material Type
  • Figure 129: Middle East and Africa Market Value Share and BPS Analysis by GSM Range, 2025 and 2035
  • Figure 130: Middle East and Africa Market Y-o-Y Growth Comparison by GSM Range, 2025-2035
  • Figure 131: Middle East and Africa Market Attractiveness Analysis by GSM Range
  • Figure 132: Middle East and Africa Market Value Share and BPS Analysis by End-use Industry, 2025 and 2035
  • Figure 133: Middle East and Africa Market Y-o-Y Growth Comparison by End-use Industry, 2025-2035
  • Figure 134: Middle East and Africa Market Attractiveness Analysis by End-use Industry
  • Figure 135: Middle East and Africa Market Value Share and BPS Analysis by Application, 2025 and 2035
  • Figure 136: Middle East and Africa Market Y-o-Y Growth Comparison by Application, 2025-2035
  • Figure 137: Middle East and Africa Market Attractiveness Analysis by Application
  • Figure 138: Middle East and Africa Market Value Share and BPS Analysis by End-Use Industry, 2025 and 2035
  • Figure 139: Middle East and Africa Market Y-o-Y Growth Comparison by End-Use Industry, 2025-2035
  • Figure 140: Middle East and Africa Market Attractiveness Analysis by End-Use Industry
  • Figure 141: Global Market - Tier Structure Analysis
  • Figure 142: Global Market - Company Share Analysis

Frequently Asked Questions

What is the projected market size of the interleave paper market in 2025 and 2035?

The market size is projected to be USD 1.4 billion in 2025 and USD 2.2 billion by 2035.

What is the expected CAGR for the interleave paper market from 2025 to 2035?

The expected CAGR is 4.6% from 2025 to 2035.

Which paper type dominates the interleave paper market in 2025?

Papers with a GSM of <40 dominate the market with a 41% share in 2025.

Who is the leading company in the interleave paper market?

Ahlstrom is the leading company in the market, holding a 31% market share.

What is the projected CAGR of the interleave paper market in India?

India is projected to grow at a CAGR of 4.8% from 2025 to 2035.

Explore Similar Insights

Future Market Insights

Interleave Paper Market