Inhalable Biologics Market Size, Share, and Forecast Outlook 2025 to 2035

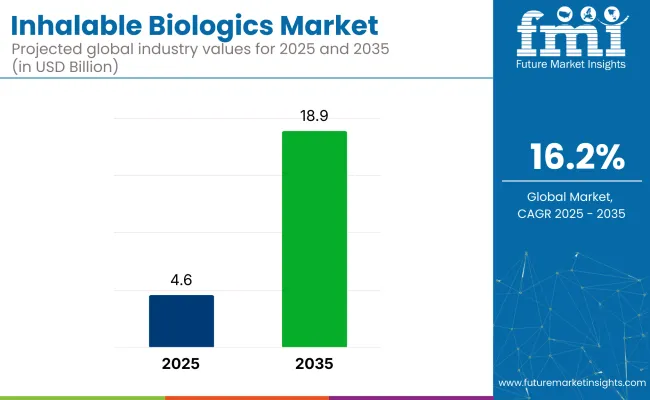
The global inhalable biologics market will witness remarkable growth, expanding from USD 4.6 billion in 2025 to nearly USD 18.9 billion by 2035, registering a CAGR of 16.2%.
Quick Stats for the Inhalable Biologics Market

  • Market Value (2025): USD 4.6 billion
  • Forecast Value (2035): USD 18.9 billion
  • Forecast CAGR: 16.2%
  • Leading Segment in 2025: Proteins and peptides (~57.8% share)
  • Key Growth Region: Asia (Japan)
  • Top Key Players: AbbVie, AstraZeneca, Boehringer Ingelheim, CanSino Biologics, Chiesi Pharmaceuticals

Inhalable Biologics Market

This surge is primarily driven by the increasing global burden of respiratory diseases such as asthma, chronic obstructive pulmonary disease (COPD), and pulmonary fibrosis, alongside rising patient preference for non-invasive and lung-targeted therapies. Inhalation therapies provide advantages such as localized delivery, enhanced bioavailability, and minimized systemic side effects, making them a favorable alternative to injectable or oral biologics.

A recent industry development occurred in June 2025, when Intertek officially expanded its pharmaceutical GMP laboratory in Melbourne, UK. This upgrade is designed to bolster its biologics testing services, with a particular focus on inhaled and nasal drug development, including cutting-edge mRNA and nucleotide-based therapeutics.

Regionally, North America continues to lead due to its developed healthcare infrastructure and high biologics adoption rates, while the Asia Pacific region is expected to register the fastest growth. Factors such as rising healthcare awareness and improvements in medical access are driving market uptake across emerging economies like China and India. Key players include AstraZeneca, Insmed, Pulmatrix, Amgen, and Novartis.

The industry holds specific shares in its parent markets. In the biologics market, the inhalable biologics market accounts for a relatively small share, estimated at around 2-4%, as biologics primarily focus on injectable therapies. In the inhalation drug delivery market, it holds a share of about 15-20%, driven by the increasing adoption of inhalable biologic therapies. Within the broader pharmaceutical market, the share is approximately 1-3%, reflecting the growing interest in non-injection-based biologic therapies.

The respiratory drug market contributes about 5-7% to the overall market, as inhalable biologics are increasingly used to treat respiratory conditions. In the medical device market, the inhalable biologics sector holds around 3-5%, as it is heavily dependent on specialized delivery devices like inhalers and nebulizers.

Inhalable Biologics Market Analysis by Top Investment Segments

Proteins and peptides, respiratory disease applications, dry powder inhalers, and hospital pharmacies drive the market, offering high compatibility, stability, patient compliance, and specialized storage advantages by 2025.

Proteins and Peptides Dominate Product Segment with Established Drug Delivery Versatility

Proteins and peptides are expected to lead the product segment with a 57.8% share in 2025.
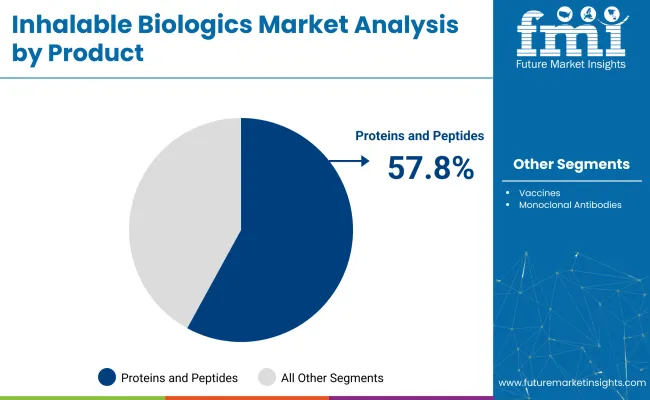
  • Demand is rising as biomolecules offer excellent compatibility with pulmonary delivery and cover several therapeutic applications such as cystic fibrosis and pulmonary hypertension. Innovations in nanocarrier systems and dry powder formulations enhance the efficiency and stability of protein-based biologics.
  • Market leaders such as Novartis and Insmed continue to focus on expanding this segment by introducing inhalable protein therapeutics. Regulatory approvals for inhalable peptide-based drugs further drive the segment’s appeal over monoclonal antibodies and vaccines.

Inhalable Biologics Market Analysis By Product

Respiratory Diseases Lead Application Segment Driven by High Prevalence and Treatment Demand

The respiratory diseases segment will remain dominant, capturing 62.2% of the market in 2025. Rising incidences of asthma, COPD, and pulmonary fibrosis across developed nations are fueling demand for targeted inhalable treatments.
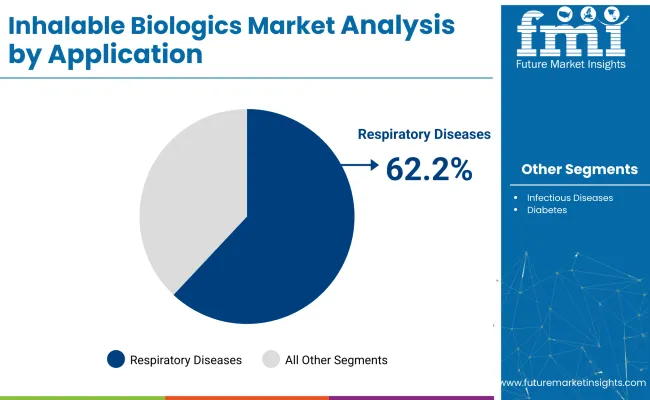
  • Inhaled monoclonal antibodies for severe asthma and peptides for cystic fibrosis are advancing this segment’s development. The World Health Organization projects COPD as the third-leading cause of global mortality.
  • Compared to systemic biologics, inhalable formats ensure localized action with fewer side effects. This clinical advantage ensures respiratory diseases retain the top position in application scope.

Inhalable Biologics Market Analysis By Application

Dry Powder Inhalers Remain Preferred Dosage Form for Convenience and Stability

Dry powder inhalers (DPIs) are projected to dominate the dosage form category with a 38.5% market share by 2025.

  • Superior stability without refrigeration and ease of use make them ideal for protein and peptide delivery. Such devices enable self-administration, increasing patient adherence and reducing hospital dependency.
  • Companies like Pulmatrix and AstraZeneca are investing heavily in DPI-based biologics to optimize therapeutic effectiveness. DPIs' propellant-free designs support regulatory shifts towards eco-friendly medical devices. Their role is crucial in addressing chronic respiratory conditions, ensuring DPIs lead the dosage segment globally.

Hospital Pharmacies Lead Distribution Channel with Specialized Storage and Dispensing Capabilities

Hospital pharmacies will dominate the distribution channel with a 49.7% market share in 2025 due to their capacity to manage cold-chain-sensitive biologics and offer specialized dispensing.

  • Initial prescriptions often require physician supervision, which hospitals are well-equipped to provide. Ongoing clinical trials for inhalable vaccines and therapeutic monoclonal antibodies are primarily routed through hospital networks for controlled administration.
  • Expansion of hospital-based metabolic and respiratory care units supports this trend. These pharmacies ensure strict adherence to handling guidelines, maintaining product integrity, and reinforcing their top position in the distribution segment.

Top Inhalable Biologics Market Dynamics

Regulatory approvals in respiratory disease and innovation in inhalation devices and formulators are driving market growth. These trends support wider adoption and improved patient outcomes.

Growing Focus on Respiratory Disease Treatments with FDA-Approved Biologics

Pulmonary delivery of biologics is being prioritized for chronic respiratory diseases. FDA approvals for inhalable treatments in COPD and asthma have set precedents. For example, mepolizumab (Nucala) recently gained FDA approval for COPD with eosinophilic phenotype following asthma indications. Dupilumab (Dupixent) was also approved as first biologic maintenance therapy for COPD.

These approvals validate the use of inhalable monoclonal antibodies. Market confidence has increased. Pipelines with next-gen inhaled biologics, including long-acting IL5 agents and inhalable vaccines, are being accelerated. Clinicians are now being encouraged to adopt device-enabled biologic therapies for respiratory management.

Advances in Device Technology and Formulation Methods

Innovation in delivery devices and formulations is improving therapeutic potential of these biologics. Dry powder inhalers (DPIs) are being favored due to stability and ease of use. Nebulizers and soft mist inhalers are being redesigned to ensure optimal lung deposition of proteins, peptides and RNAi therapeutics.

Collaborations between device companies (e.g., Iconovo and Lonza) have been announced to develop inhalable biologic formulations using spray-drying technology. Regulatory emphasis on device-drug combinations has placed quality control at priority. These advancements are driving adoption by improving dosing accuracy, patient compliance, and product scalability.
Top Countries Driving, Adopting, and Shaping the Inhalable Biologics Market

Country Wise Analysis Of Inhalable Biologics Market

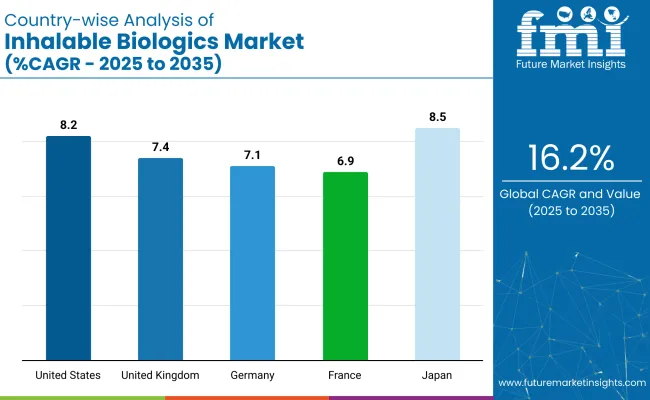
Countries CAGR (2025 to 2035)
United States 8.2%
United Kingdom 7.4%
Germany 7.1%
France 6.9%
Japan 8.5%

OECD countries, including the United States and the United Kingdom, are witnessing strong growth in the industry. The United States, with a projected CAGR of 8.2% from 2025 to 2035, leads the charge, driven by rising respiratory diseases and FDA support for biologic inhalation therapies. Top companies like AstraZeneca, Pfizer, and Amgen are investing in monoclonal antibodies and protein-based formulations.

The USA benefits from a well-built clinical trial network, extensive health insurance coverage, and partnerships between biotech startups and established pharma giants, accelerating market maturation. In the United Kingdom, projected to grow at 7.4% CAGR, the NHS’s commitment to patient-centric care and a cost-effective biologics focus enhances market adoption. Companies like GSK and Oxford Biomedica are developing biologic therapies for asthma, COPD, and rare pulmonary diseases.

In the ASEAN region, Japan is expected to be the fastest-growing market, with a projected CAGR of 8.5%. Japan’s aging population and advanced pharmaceutical research are key drivers, with companies like Takeda and Astellas investing in the industry. Government initiatives promoting healthcare innovation and reimbursement for biologics further stimulate market growth.

Germany, within the OECD, is projected to grow at a steady 7.1% CAGR, with its leadership in precision medicine and personalized biologic treatments, driven by companies like Boehringer Ingelheim and Bayer. France, within the EU, is expected to grow at 6.9% CAGR, supported by strong clinical research, government health initiatives, and advancements in inhalable biologic therapies for rare diseases.

The report covers in-depth analysis of 40+ countries. Five top performing countries are highlighted below.

Future Outlook of the United States Inhalable Biologics Market

The United States dominates, with a projected CAGR of 8.2% from 2025 to 2035. Growth is fueled by the rising prevalence of respiratory diseases and the FDA’s supportive regulatory pathway for biologic inhalation therapies. Top companies like AstraZeneca, Pfizer, and Amgen are focusing on monoclonal antibodies and innovative protein-based formulations to address the demand for inhalable treatments.

  • The presence of a strong network of clinical trial centers and health insurance coverage accelerates market maturity.
  • Partnerships between biotech startups and established pharmaceutical giants enable rapid commercialization.
  • The growing demand for non-invasive biologic treatments further enhances market potential.

Growth Outlook of the United Kingdom Inhalable Biologics Market

The United Kingdom is expected to grow at a CAGR of 7.4% from 2025 to 2035, driven by the country’s established healthcare system and a focus on cost-effective biologics. NHS’s commitment to patient-centric respiratory care is encouraging the use of biologic inhalation therapies. The UK’s established biopharmaceutical sector, supported by firms like GSK and Oxford Biomedica, is developing biologic solutions for asthma, COPD, and rare pulmonary diseases.

  • The NHS's focus on biologic therapies enhances market adoption.
  • Regulatory alignment with the European Medicines Agency streamlines the approval process.
  • A strong interest in eco-friendly and non-invasive treatments drives the demand for inhalable biologics.

Analysis of Germany Inhalable Biologics Market

Germany's inhalable biologics market is projected to grow at a steady CAGR of 7.1% from 2025 to 2035, supported by strong research in precision medicine and biotechnology. The country’s leadership in personalized medicine aligns well with the demand for tailored inhalable therapies for chronic respiratory conditions like asthma and COPD. Companies like Boehringer Ingelheim and Bayer are focusing on the development of innovative therapies that promise improved patient outcomes.

  • High awareness and adoption of new biologic therapies are facilitated by Germany’s efficient healthcare system.
  • Collaborative efforts between academia, regulatory bodies, and pharma firms ensure continued market innovation.
  • Precision medicine drives the focus on personalized biologic treatments in the market.

France Inhalable Biologics Market Growth Analysis

The France inhalable biologics market is expected to grow at a CAGR of 6.9% from 2025 to 2035, fueled by the country’s strong clinical research focus and biotechnology sector. French companies are pioneering in the development of inhalable monoclonal antibodies and therapeutic proteins, especially targeting rare pulmonary diseases. Government-driven health initiatives and public-private collaborations are accelerating innovation and improving the availability of these therapies.

  • French biotech companies show fast-paced development of inhalable biologics for rare diseases.
  • Government-backed research grants and health initiatives support continued market growth.
  • France’s healthcare system prioritizes early diagnosis, increasing the adoption of novel respiratory biologics.

Growth Outlook of Inhalable Biologics Market in Japan

Japan will be the fastest-growing market for inhalable biologics, with a CAGR of 8.5% from 2025 to 2035. The nation's advanced pharmaceutical research and an aging population are key drivers of demand for inhalable treatments targeting age-related respiratory diseases. Companies like Takeda and Astellas are investing in biologic formulations suitable for inhalation, contributing to the development of new therapeutic options.
  • Government initiatives to promote healthcare innovation and reimbursement for biologics encourage market growth.
  • The rising adoption of minimally invasive therapies aligns with Japan’s cultural preferences.
  • Japan’s commitment to healthcare innovation ensures a continuous pipeline of advanced inhalable biologic treatments.

Leading Producers of Inhalable Biologics Market Suppliers

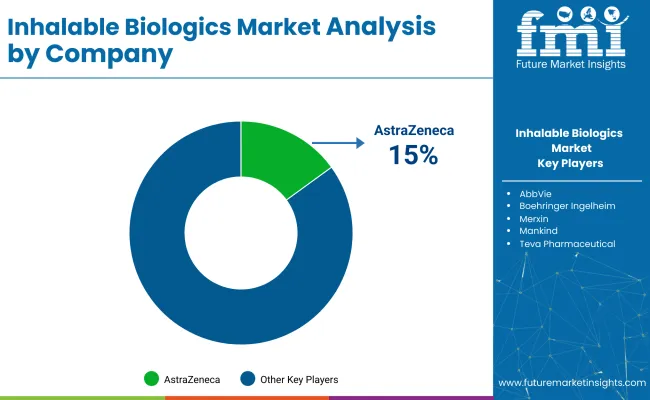
Inhalable Biologics Market Analysis By Company

The industry is moderately consolidated, with topcompanies like AstraZeneca, Boehringer Ingelheim, and F. Hoffmann-La Roche Ltd. holding large market shares because of advanced R&D, proprietary delivery platforms, and regulatory expertise. Emerging players, such as MannKind Corporation, Kamada Pharmaceuticals, and CanSino Biologics, focus on niche therapies and regional markets to build their presence.

Growing demand for inhalable biologics is fueled by rising respiratory disease cases, including asthma and COPD. Key manufacturers have brought innovations in dry powder inhalers (DPIs), soft mist inhalers (SMIs), and improved formulations to enhance bioavailability, therapeutic efficiency, and patient adherence across markets.

Recent Inhalable Biologics Market News

  • In December 2024, MannKind Corporation received approval from India’s CDSCO for Afrezza inhalation powder, marking the country’s first inhaled insulin therapy for adults with diabetes, according to an official press release by MannKind Corporation.
  • In March 2023, Stevanato Group announced its partnership with Resyca-a joint venture of Recipharm and Medspray-for the development of pre-fillable glass syringes integrated with Resyca’s proprietary soft mist inhaler (SMI) technology, as stated in an official announcement released by Stevanato Group.

Key Players

  • AbbVie
  • AstraZeneca
  • Boehringer Ingelheim
  • CanSino Biologics
  • Chiesi Pharmaceuticals
  • F-Hoffman Roche
  • Kamada Pharmaceuticals
  • Mannkind
  • Merxin
  • Teva Pharmaceutical
  • United Therapeutics

Research Coverage and Scope Summary

Report Attributes Details
Market Size (2025E) USD 4.6 billion
Projected Market Size (2035F) USD 18.9 billion
CAGR (2025 to 2035) 16.2%
Base Year for Estimation 2024
Historical Period 2020 to 2024
Projection Period 2025 to 2035
Quantitative Units USD billion for value & thousand units volume
By Product Type (Segment 1) Proteins and Peptides, Vaccines, Monoclonal Antibodies
By Application (Segment 2) Respiratory Diseases, Infectious Diseases, Diabetes
By Dosage Form (Segment 3) Dry Powder Inhalers, Metered Dose Inhalers, Nebulizers, Soft Mist Inhalers
By Distribution Channel (Segment 4) Hospital Pharmacies, Retail Pharmacies, Online Pharmacies
Regions Covered North America, Europe, Asia Pacific, Latin America, Middle East & Africa (MEA)
Countries Covered USA, Canada, Germany, UK, France, Spain, Italy, Netherlands, China, Japan, India, Australia, South Korea, Brazil, Mexico, Argentina, South Africa, Saudi Arabia, UAE
Key Players Influencing the Market AbbVie, AstraZeneca, Boehringer Ingelheim, CanSino Biologics, Chiesi Pharmaceuticals, F. Hoffmann-La Roche, Kamada Pharmaceuticals, MannKind, Merxin, Teva Pharmaceutical, United Therapeutics
Additional Attributes Dollar sales, share, innovative inhalable drug delivery, market growth by respiratory disease burden, biologics pipeline advancements, and inhaler device design improvements

Inhalable Biologics Market Studied by Key Segments

By Product:

Proteins and peptides, vaccines, and monoclonal antibodies.

By Application:

Respiratory diseases, infectious diseases, and diabetes.

By Dosage Form:

Dry powder inhalers (DPIs), metered dose inhalers (MDIs), nebulizers, and soft mist inhalers (SMIs).

By Distribution Channel:

Hospital pharmacies, retail pharmacies, and online pharmacies.

By Region:

North America, Europe, Asia Pacific, Latin America, and Middle East and Africa.

Table of Content

  1. Executive Summary
    • Global Market Outlook
    • Demand-side Trends
    • Supply-side Trends
    • Technology Roadmap Analysis
    • Analysis and Recommendations
  2. Market Overview
    • Market Coverage / Taxonomy
    • Market Definition / Scope / Limitations
  3. Market Background
    • Market Dynamics
      • Drivers
      • Restraints
      • Opportunity
      • Trends
    • Scenario Forecast
      • Demand in Optimistic Scenario
      • Demand in Likely Scenario
      • Demand in Conservative Scenario
    • Opportunity Map Analysis
    • Product Life Cycle Analysis
    • Supply Chain Analysis
      • Supply Side Participants and their Roles
        • Producers
        • Mid-Level Participants (Traders/ Agents/ Brokers)
        • Wholesalers and Distributors
      • Value Added and Value Created at Node in the Supply Chain
      • List of Raw Material Suppliers
      • List of Existing and Potential Buyer’s
    • Investment Feasibility Matrix
    • Value Chain Analysis
      • Profit Margin Analysis
      • Wholesalers and Distributors
      • Retailers
    • PESTLE and Porter’s Analysis
    • Regulatory Landscape
      • By Key Regions
      • By Key Countries
    • Regional Parent Market Outlook
    • Production and Consumption Statistics
    • Import and Export Statistics
  4. Global Market Analysis 2020 to 2024 and Forecast, 2025 to 2035
    • Historical Market Size Value (USD Billion) & Volume (Thousand Unit) Analysis, 2020 to 2024
    • Current and Future Market Size Value (USD Billion) & Volume (Thousand Unit) Projections, 2025 to 2035
      • Y-o-Y Growth Trend Analysis
      • Absolute $ Opportunity Analysis
  5. Global Market Pricing Analysis 2020 to 2024 and Forecast 2025 to 2035
  6. Global Market Analysis 2020 to 2024 and Forecast 2025 to 2035, By Product
    • Introduction / Key Findings
    • Historical Market Size Value (USD Billion) & Volume (Thousand Unit) Analysis By Product, 2020 to 2024
    • Current and Future Market Size Value (USD Billion) & Volume (Thousand Unit) Analysis and Forecast By Product, 2025 to 2035
      • Proteins and peptides
      • Vaccines
      • Monoclonal antibodies
    • Y-o-Y Growth Trend Analysis By Product, 2020 to 2024
    • Absolute $ Opportunity Analysis By Product, 2025 to 2035
  7. Global Market Analysis 2020 to 2024 and Forecast 2025 to 2035, By Application
    • Introduction / Key Findings
    • Historical Market Size Value (USD Billion) & Volume (Thousand Unit) Analysis By Application, 2020 to 2024
    • Current and Future Market Size Value (USD Billion) & Volume (Thousand Unit) Analysis and Forecast By Application, 2025 to 2035
      • Respiratory diseases
      • Infectious diseases
      • Diabetes
    • Y-o-Y Growth Trend Analysis By Application, 2020 to 2024
    • Absolute $ Opportunity Analysis By Application, 2025 to 2035
  8. Global Market Analysis 2020 to 2024 and Forecast 2025 to 2035, By Dosage Form
    • Introduction / Key Findings
    • Historical Market Size Value (USD Billion) & Volume (Thousand Unit) Analysis By Dosage Form, 2020 to 2024
    • Current and Future Market Size Value (USD Billion) & Volume (Thousand Unit) Analysis and Forecast By Dosage Form, 2025 to 2035
      • Dry powder inhalers (DPIs)
      • Metered dose inhalers (MDIs)
      • Nebulizers
      • Soft mist inhalers (SMIs)
    • Y-o-Y Growth Trend Analysis By Dosage Form, 2020 to 2024
    • Absolute $ Opportunity Analysis By Dosage Form, 2025 to 2035
  9. Global Market Analysis 2020 to 2024 and Forecast 2025 to 2035, By Distribution Channel
    • Introduction / Key Findings
    • Historical Market Size Value (USD Billion) & Volume (Thousand Unit) Analysis By Distribution Channel, 2020 to 2024
    • Current and Future Market Size Value (USD Billion) & Volume (Thousand Unit) Analysis and Forecast By Distribution Channel, 2025 to 2035
      • Hospital pharmacies
      • Retail pharmacies
      • Online pharmacies
    • Y-o-Y Growth Trend Analysis By Distribution Channel, 2020 to 2024
    • Absolute $ Opportunity Analysis By Distribution Channel, 2025 to 2035
  10. Global Market Analysis 2020 to 2024 and Forecast 2025 to 2035, By Region
    • Introduction
    • Historical Market Size Value (USD Billion) & Volume (Thousand Unit) Analysis By Region, 2020 to 2024
    • Current Market Size Value (USD Billion) & Volume (Thousand Unit) Analysis and Forecast By Region, 2025 to 2035
      • North America
      • Latin America
      • Western Europe
      • Eastern Europe
      • East Asia
      • South Asia & Pacific
      • Middle East and Africa
    • Market Attractiveness Analysis By Region
  11. North America Market Analysis 2020 to 2024 and Forecast 2025 to 2035, By Country
    • Historical Market Size Value (USD Billion) & Volume (Thousand Unit) Trend Analysis By Market Taxonomy, 2020 to 2024
    • Market Size Value (USD Billion) & Volume (Thousand Unit) Forecast By Market Taxonomy, 2025 to 2035
      • By Country
        • USA
        • Canada
        • Mexico
      • By Product
      • By Application
      • By Dosage Form
      • By Distribution Channel
    • Market Attractiveness Analysis
      • By Country
      • By Product
      • By Application
      • By Dosage Form
      • By Distribution Channel
    • Key Takeaways
  12. Latin America Market Analysis 2020 to 2024 and Forecast 2025 to 2035, By Country
    • Historical Market Size Value (USD Billion) & Volume (Thousand Unit) Trend Analysis By Market Taxonomy, 2020 to 2024
    • Market Size Value (USD Billion) & Volume (Thousand Unit) Forecast By Market Taxonomy, 2025 to 2035
      • By Country
        • Brazil
        • Argentina
        • Rest of LATAM
      • By Product
      • By Application
      • By Dosage Form
      • By Distribution Channel
    • Market Attractiveness Analysis
      • By Country
      • By Product
      • By Application
      • By Dosage Form
      • By Distribution Channel
    • Key Takeaways
  13. Western Europe Market Analysis 2020 to 2024 and Forecast 2025 to 2035, By Country
    • Historical Market Size Value (USD Billion) & Volume (Thousand Unit) Trend Analysis By Market Taxonomy, 2020 to 2024
    • Market Size Value (USD Billion) & Volume (Thousand Unit) Forecast By Market Taxonomy, 2025 to 2035
      • By Country
        • Germany
        • Italy
        • France
        • UK
        • Spain
        • BENELUX
        • Nordic
        • Rest of W.Europe
      • By Product
      • By Application
      • By Dosage Form
      • By Distribution Channel
    • Market Attractiveness Analysis
      • By Country
      • By Product
      • By Application
      • By Dosage Form
      • By Distribution Channel
    • Key Takeaways
  14. Eastern Europe Market Analysis 2020 to 2024 and Forecast 2025 to 2035, By Country
    • Historical Market Size Value (USD Billion) & Volume (Thousand Unit) Trend Analysis By Market Taxonomy, 2020 to 2024
    • Market Size Value (USD Billion) & Volume (Thousand Unit) Forecast By Market Taxonomy, 2025 to 2035
      • By Country
        • Russia
        • Hungary
        • Poland
        • Balkan & Baltics
        • Rest of E. Europe
      • By Product
      • By Application
      • By Dosage Form
      • By Distribution Channel
    • Market Attractiveness Analysis
      • By Country
      • By Product
      • By Application
      • By Dosage Form
      • By Distribution Channel
    • Key Takeaways
  15. East Asia Market Analysis 2020 to 2024 and Forecast 2025 to 2035, By Country
    • Historical Market Size Value (USD Billion) & Volume (Thousand Unit) Trend Analysis By Market Taxonomy, 2020 to 2024
    • Market Size Value (USD Billion) & Volume (Thousand Unit) Forecast By Market Taxonomy, 2025 to 2035
      • By Country
        • China
        • Japan
        • South Korea
      • By Product
      • By Application
      • By Dosage Form
      • By Distribution Channel
    • Market Attractiveness Analysis
      • By Country
      • By Product
      • By Application
      • By Dosage Form
      • By Distribution Channel
    • Key Takeaways
  16. South Asia & Pacific Market Analysis 2020 to 2024 and Forecast 2025 to 2035, By Country
    • Historical Market Size Value (USD Billion) & Volume (Thousand Unit) Trend Analysis By Market Taxonomy, 2020 to 2024
    • Market Size Value (USD Billion) & Volume (Thousand Unit) Forecast By Market Taxonomy, 2025 to 2035
      • By Country
        • India
        • Australia & New Zealand
        • ASEAN
        • Rest of SAP
      • By Product
      • By Application
      • By Dosage Form
      • By Distribution Channel
    • Market Attractiveness Analysis
      • By Country
      • By Product
      • By Application
      • By Dosage Form
      • By Distribution Channel
    • Key Takeaways
  17. Middle East and Africa Market Analysis 2020 to 2024 and Forecast 2025 to 2035, By Country
    • Historical Market Size Value (USD Billion) & Volume (Thousand Unit) Trend Analysis By Market Taxonomy, 2020 to 2024
    • Market Size Value (USD Billion) & Volume (Thousand Unit) Forecast By Market Taxonomy, 2025 to 2035
      • By Country
        • GCC Countries
        • Northern Africa
        • South Africa
        • Turkiye
        • Rest of MEA
      • By Product
      • By Application
      • By Dosage Form
      • By Distribution Channel
    • Market Attractiveness Analysis
      • By Country
      • By Product
      • By Application
      • By Dosage Form
      • By Distribution Channel
    • Key Takeaways
  18. Key Countries Market Analysis
    • USA
      • Pricing Analysis
      • Market Share Analysis, 2024
        • By Product
        • By Application
        • By Dosage Form
        • By Distribution Channel
    • Canada
      • Pricing Analysis
      • Market Share Analysis, 2024
        • By Product
        • By Application
        • By Dosage Form
        • By Distribution Channel
    • Brazil
      • Pricing Analysis
      • Market Share Analysis, 2024
        • By Product
        • By Application
        • By Dosage Form
        • By Distribution Channel
    • Mexico
      • Pricing Analysis
      • Market Share Analysis, 2024
        • By Product
        • By Application
        • By Dosage Form
        • By Distribution Channel
    • Argentina
      • Pricing Analysis
      • Market Share Analysis, 2024
        • By Product
        • By Application
        • By Dosage Form
        • By Distribution Channel
  19. Market Structure Analysis
    • Competition Dashboard
    • Competition Benchmarking
    • Market Share Analysis of Top Players
      • By Regional
      • By Product
      • By Application
      • By Dosage Form
      • By Distribution Channel
  20. Competition Analysis
    • Competition Deep Dive
      • AbbVie
        • Overview
        • Product Portfolio
        • Profitability by Market Segments (Product/Age /Sales Channel/Region)
        • Sales Footprint
        • Strategy Overview
          • Marketing Strategy
          • Product Strategy
          • Channel Strategy
      • AstraZeneca
        • Overview
        • Product Portfolio
        • Profitability by Market Segments (Product/Age /Sales Channel/Region)
        • Sales Footprint
        • Strategy Overview
          • Marketing Strategy
          • Product Strategy
          • Channel Strategy
      • Boehringer Ingelheim
        • Overview
        • Product Portfolio
        • Profitability by Market Segments (Product/Age /Sales Channel/Region)
        • Sales Footprint
        • Strategy Overview
          • Marketing Strategy
          • Product Strategy
          • Channel Strategy
      • CanSino Biologics
        • Overview
        • Product Portfolio
        • Profitability by Market Segments (Product/Age /Sales Channel/Region)
        • Sales Footprint
        • Strategy Overview
          • Marketing Strategy
          • Product Strategy
          • Channel Strategy
      • Chiesi Pharmaceuticals
        • Overview
        • Product Portfolio
        • Profitability by Market Segments (Product/Age /Sales Channel/Region)
        • Sales Footprint
        • Strategy Overview
          • Marketing Strategy
          • Product Strategy
          • Channel Strategy
      • F-Hoffman Roche
        • Overview
        • Product Portfolio
        • Profitability by Market Segments (Product/Age /Sales Channel/Region)
        • Sales Footprint
        • Strategy Overview
          • Marketing Strategy
          • Product Strategy
          • Channel Strategy
      • Kamada Pharmaceuticals
        • Overview
        • Product Portfolio
        • Profitability by Market Segments (Product/Age /Sales Channel/Region)
        • Sales Footprint
        • Strategy Overview
          • Marketing Strategy
          • Product Strategy
          • Channel Strategy
      • Mannkind
        • Overview
        • Product Portfolio
        • Profitability by Market Segments (Product/Age /Sales Channel/Region)
        • Sales Footprint
        • Strategy Overview
          • Marketing Strategy
          • Product Strategy
          • Channel Strategy
      • Merxin
        • Overview
        • Product Portfolio
        • Profitability by Market Segments (Product/Age /Sales Channel/Region)
        • Sales Footprint
        • Strategy Overview
          • Marketing Strategy
          • Product Strategy
          • Channel Strategy
      • Teva Pharmaceutical
        • Overview
        • Product Portfolio
        • Profitability by Market Segments (Product/Age /Sales Channel/Region)
        • Sales Footprint
        • Strategy Overview
          • Marketing Strategy
          • Product Strategy
          • Channel Strategy
      • Value (USD Billion) & Volume (Thousand Unit)ed Therapeutics
        • Overview
        • Product Portfolio
        • Profitability by Market Segments (Product/Age /Sales Channel/Region)
        • Sales Footprint
        • Strategy Overview
          • Marketing Strategy
          • Product Strategy
          • Channel Strategy
  21. Assumptions & Acronyms Used
  22. Research Methodology

List of Tables

  • Table 1: Global Market Value (USD Billion) Forecast by Region, 2020 to 2035
  • Table 2: Global Market Volume (Thousand Unit) Forecast by Region, 2020 to 2035
  • Table 3: Global Market Value (USD Billion) Forecast by Product, 2020 to 2035
  • Table 4: Global Market Volume (Thousand Unit) Forecast by Product, 2020 to 2035
  • Table 5: Global Market Value (USD Billion) Forecast by Application, 2020 to 2035
  • Table 6: Global Market Volume (Thousand Unit) Forecast by Application, 2020 to 2035
  • Table 7: Global Market Value (USD Billion) Forecast by Dosage Form, 2020 to 2035
  • Table 8: Global Market Volume (Thousand Unit) Forecast by Dosage Form, 2020 to 2035
  • Table 9: Global Market Value (USD Billion) Forecast by Distribution Channel, 2020 to 2035
  • Table 10: Global Market Volume (Thousand Unit) Forecast by Distribution Channel, 2020 to 2035
  • Table 11: North America Market Value (USD Billion) Forecast by Country, 2020 to 2035
  • Table 12: North America Market Volume (Thousand Unit) Forecast by Country, 2020 to 2035
  • Table 13: North America Market Value (USD Billion) Forecast by Product, 2020 to 2035
  • Table 14: North America Market Volume (Thousand Unit) Forecast by Product, 2020 to 2035
  • Table 15: North America Market Value (USD Billion) Forecast by Application, 2020 to 2035
  • Table 16: North America Market Volume (Thousand Unit) Forecast by Application, 2020 to 2035
  • Table 17: North America Market Value (USD Billion) Forecast by Dosage Form, 2020 to 2035
  • Table 18: North America Market Volume (Thousand Unit) Forecast by Dosage Form, 2020 to 2035
  • Table 19: North America Market Value (USD Billion) Forecast by Distribution Channel, 2020 to 2035
  • Table 20: North America Market Volume (Thousand Unit) Forecast by Distribution Channel, 2020 to 2035
  • Table 21: Latin America Market Value (USD Billion) Forecast by Country, 2020 to 2035
  • Table 22: Latin America Market Volume (Thousand Unit) Forecast by Country, 2020 to 2035
  • Table 23: Latin America Market Value (USD Billion) Forecast by Product, 2020 to 2035
  • Table 24: Latin America Market Volume (Thousand Unit) Forecast by Product, 2020 to 2035
  • Table 25: Latin America Market Value (USD Billion) Forecast by Application, 2020 to 2035
  • Table 26: Latin America Market Volume (Thousand Unit) Forecast by Application, 2020 to 2035
  • Table 27: Latin America Market Value (USD Billion) Forecast by Dosage Form, 2020 to 2035
  • Table 28: Latin America Market Volume (Thousand Unit) Forecast by Dosage Form, 2020 to 2035
  • Table 29: Latin America Market Value (USD Billion) Forecast by Distribution Channel, 2020 to 2035
  • Table 30: Latin America Market Volume (Thousand Unit) Forecast by Distribution Channel, 2020 to 2035
  • Table 31: Western Europe Market Value (USD Billion) Forecast by Country, 2020 to 2035
  • Table 32: Western Europe Market Volume (Thousand Unit) Forecast by Country, 2020 to 2035
  • Table 33: Western Europe Market Value (USD Billion) Forecast by Product, 2020 to 2035
  • Table 34: Western Europe Market Volume (Thousand Unit) Forecast by Product, 2020 to 2035
  • Table 35: Western Europe Market Value (USD Billion) Forecast by Application, 2020 to 2035
  • Table 36: Western Europe Market Volume (Thousand Unit) Forecast by Application, 2020 to 2035
  • Table 37: Western Europe Market Value (USD Billion) Forecast by Dosage Form, 2020 to 2035
  • Table 38: Western Europe Market Volume (Thousand Unit) Forecast by Dosage Form, 2020 to 2035
  • Table 39: Western Europe Market Value (USD Billion) Forecast by Distribution Channel, 2020 to 2035
  • Table 40: Western Europe Market Volume (Thousand Unit) Forecast by Distribution Channel, 2020 to 2035
  • Table 41: Eastern Europe Market Value (USD Billion) Forecast by Country, 2020 to 2035
  • Table 42: Eastern Europe Market Volume (Thousand Unit) Forecast by Country, 2020 to 2035
  • Table 43: Eastern Europe Market Value (USD Billion) Forecast by Product, 2020 to 2035
  • Table 44: Eastern Europe Market Volume (Thousand Unit) Forecast by Product, 2020 to 2035
  • Table 45: Eastern Europe Market Value (USD Billion) Forecast by Application, 2020 to 2035
  • Table 46: Eastern Europe Market Volume (Thousand Unit) Forecast by Application, 2020 to 2035
  • Table 47: Eastern Europe Market Value (USD Billion) Forecast by Dosage Form, 2020 to 2035
  • Table 48: Eastern Europe Market Volume (Thousand Unit) Forecast by Dosage Form, 2020 to 2035
  • Table 49: Eastern Europe Market Value (USD Billion) Forecast by Distribution Channel, 2020 to 2035
  • Table 50: Eastern Europe Market Volume (Thousand Unit) Forecast by Distribution Channel, 2020 to 2035
  • Table 51: East Asia Market Value (USD Billion) Forecast by Country, 2020 to 2035
  • Table 52: East Asia Market Volume (Thousand Unit) Forecast by Country, 2020 to 2035
  • Table 53: East Asia Market Value (USD Billion) Forecast by Product, 2020 to 2035
  • Table 54: East Asia Market Volume (Thousand Unit) Forecast by Product, 2020 to 2035
  • Table 55: East Asia Market Value (USD Billion) Forecast by Application, 2020 to 2035
  • Table 56: East Asia Market Volume (Thousand Unit) Forecast by Application, 2020 to 2035
  • Table 57: East Asia Market Value (USD Billion) Forecast by Dosage Form, 2020 to 2035
  • Table 58: East Asia Market Volume (Thousand Unit) Forecast by Dosage Form, 2020 to 2035
  • Table 59: East Asia Market Value (USD Billion) Forecast by Distribution Channel, 2020 to 2035
  • Table 60: East Asia Market Volume (Thousand Unit) Forecast by Distribution Channel, 2020 to 2035
  • Table 61: South Asia & Pacific Market Value (USD Billion) Forecast by Country, 2020 to 2035
  • Table 62: South Asia & Pacific Market Volume (Thousand Unit) Forecast by Country, 2020 to 2035
  • Table 63: South Asia & Pacific Market Value (USD Billion) Forecast by Product, 2020 to 2035
  • Table 64: South Asia & Pacific Market Volume (Thousand Unit) Forecast by Product, 2020 to 2035
  • Table 65: South Asia & Pacific Market Value (USD Billion) Forecast by Application, 2020 to 2035
  • Table 66: South Asia & Pacific Market Volume (Thousand Unit) Forecast by Application, 2020 to 2035
  • Table 67: South Asia & Pacific Market Value (USD Billion) Forecast by Dosage Form, 2020 to 2035
  • Table 68: South Asia & Pacific Market Volume (Thousand Unit) Forecast by Dosage Form, 2020 to 2035
  • Table 69: South Asia & Pacific Market Value (USD Billion) Forecast by Distribution Channel, 2020 to 2035
  • Table 70: South Asia & Pacific Market Volume (Thousand Unit) Forecast by Distribution Channel, 2020 to 2035
  • Table 71: Middle East and Africa Market Value (USD Billion) Forecast by Country, 2020 to 2035
  • Table 72: Middle East and Africa Market Volume (Thousand Unit) Forecast by Country, 2020 to 2035
  • Table 73: Middle East and Africa Market Value (USD Billion) Forecast by Product, 2020 to 2035
  • Table 74: Middle East and Africa Market Volume (Thousand Unit) Forecast by Product, 2020 to 2035
  • Table 75: Middle East and Africa Market Value (USD Billion) Forecast by Application, 2020 to 2035
  • Table 76: Middle East and Africa Market Volume (Thousand Unit) Forecast by Application, 2020 to 2035
  • Table 77: Middle East and Africa Market Value (USD Billion) Forecast by Dosage Form, 2020 to 2035
  • Table 78: Middle East and Africa Market Volume (Thousand Unit) Forecast by Dosage Form, 2020 to 2035
  • Table 79: Middle East and Africa Market Value (USD Billion) Forecast by Distribution Channel, 2020 to 2035
  • Table 80: Middle East and Africa Market Volume (Thousand Unit) Forecast by Distribution Channel, 2020 to 2035

List of Figures

  • Figure 1: Global Market Volume (Thousand Unit) Forecast 2020 to 2035
  • Figure 2: Global Market Pricing Analysis
  • Figure 3: Global Market Value (USD Billion) Forecast 2020 to 2035
  • Figure 4: Global Market Value Share and BPS Analysis by Product, 2025 and 2035
  • Figure 5: Global Market Y-o-Y Growth Comparison by Product, 2025 to 2035
  • Figure 6: Global Market Attractiveness Analysis by Product
  • Figure 7: Global Market Value Share and BPS Analysis by Application, 2025 and 2035
  • Figure 8: Global Market Y-o-Y Growth Comparison by Application, 2025 to 2035
  • Figure 9: Global Market Attractiveness Analysis by Application
  • Figure 10: Global Market Value Share and BPS Analysis by Dosage Form, 2025 and 2035
  • Figure 11: Global Market Y-o-Y Growth Comparison by Dosage Form, 2025 to 2035
  • Figure 12: Global Market Attractiveness Analysis by Dosage Form
  • Figure 13: Global Market Value Share and BPS Analysis by Distribution Channel, 2025 and 2035
  • Figure 14: Global Market Y-o-Y Growth Comparison by Distribution Channel, 2025 to 2035
  • Figure 15: Global Market Attractiveness Analysis by Distribution Channel
  • Figure 16: Global Market Value (USD Billion) Share and BPS Analysis by Region, 2025 and 2035
  • Figure 17: Global Market Y-o-Y Growth Comparison by Region, 2025 to 2035
  • Figure 18: Global Market Attractiveness Analysis by Region
  • Figure 19: North America Market Incremental $ Opportunity, 2025 to 2035
  • Figure 20: Latin America Market Incremental $ Opportunity, 2025 to 2035
  • Figure 21: Western Europe Market Incremental $ Opportunity, 2025 to 2035
  • Figure 22: Eastern Europe Market Incremental $ Opportunity, 2025 to 2035
  • Figure 23: East Asia Market Incremental $ Opportunity, 2025 to 2035
  • Figure 24: South Asia & Pacific Market Incremental $ Opportunity, 2025 to 2035
  • Figure 25: Middle East and Africa Market Incremental $ Opportunity, 2025 to 2035
  • Figure 26: North America Market Value Share and BPS Analysis by Country, 2025 and 2035
  • Figure 27: North America Market Value Share and BPS Analysis by Product, 2025 and 2035
  • Figure 28: North America Market Y-o-Y Growth Comparison by Product, 2025 to 2035
  • Figure 29: North America Market Attractiveness Analysis by Product
  • Figure 30: North America Market Value Share and BPS Analysis by Application, 2025 and 2035
  • Figure 31: North America Market Y-o-Y Growth Comparison by Application, 2025 to 2035
  • Figure 32: North America Market Attractiveness Analysis by Application
  • Figure 33: North America Market Value Share and BPS Analysis by Dosage Form, 2025 and 2035
  • Figure 34: North America Market Y-o-Y Growth Comparison by Dosage Form, 2025 to 2035
  • Figure 35: North America Market Attractiveness Analysis by Dosage Form
  • Figure 36: North America Market Value Share and BPS Analysis by Distribution Channel, 2025 and 2035
  • Figure 37: North America Market Y-o-Y Growth Comparison by Distribution Channel, 2025 to 2035
  • Figure 38: North America Market Attractiveness Analysis by Distribution Channel
  • Figure 39: Latin America Market Value Share and BPS Analysis by Country, 2025 and 2035
  • Figure 40: Latin America Market Value Share and BPS Analysis by Product, 2025 and 2035
  • Figure 41: Latin America Market Y-o-Y Growth Comparison by Product, 2025 to 2035
  • Figure 42: Latin America Market Attractiveness Analysis by Product
  • Figure 43: Latin America Market Value Share and BPS Analysis by Application, 2025 and 2035
  • Figure 44: Latin America Market Y-o-Y Growth Comparison by Application, 2025 to 2035
  • Figure 45: Latin America Market Attractiveness Analysis by Application
  • Figure 46: Latin America Market Value Share and BPS Analysis by Dosage Form, 2025 and 2035
  • Figure 47: Latin America Market Y-o-Y Growth Comparison by Dosage Form, 2025 to 2035
  • Figure 48: Latin America Market Attractiveness Analysis by Dosage Form
  • Figure 49: Latin America Market Value Share and BPS Analysis by Distribution Channel, 2025 and 2035
  • Figure 50: Latin America Market Y-o-Y Growth Comparison by Distribution Channel, 2025 to 2035
  • Figure 51: Latin America Market Attractiveness Analysis by Distribution Channel
  • Figure 52: Western Europe Market Value Share and BPS Analysis by Country, 2025 and 2035
  • Figure 53: Western Europe Market Value Share and BPS Analysis by Product, 2025 and 2035
  • Figure 54: Western Europe Market Y-o-Y Growth Comparison by Product, 2025 to 2035
  • Figure 55: Western Europe Market Attractiveness Analysis by Product
  • Figure 56: Western Europe Market Value Share and BPS Analysis by Application, 2025 and 2035
  • Figure 57: Western Europe Market Y-o-Y Growth Comparison by Application, 2025 to 2035
  • Figure 58: Western Europe Market Attractiveness Analysis by Application
  • Figure 59: Western Europe Market Value Share and BPS Analysis by Dosage Form, 2025 and 2035
  • Figure 60: Western Europe Market Y-o-Y Growth Comparison by Dosage Form, 2025 to 2035
  • Figure 61: Western Europe Market Attractiveness Analysis by Dosage Form
  • Figure 62: Western Europe Market Value Share and BPS Analysis by Distribution Channel, 2025 and 2035
  • Figure 63: Western Europe Market Y-o-Y Growth Comparison by Distribution Channel, 2025 to 2035
  • Figure 64: Western Europe Market Attractiveness Analysis by Distribution Channel
  • Figure 65: Eastern Europe Market Value Share and BPS Analysis by Country, 2025 and 2035
  • Figure 66: Eastern Europe Market Value Share and BPS Analysis by Product, 2025 and 2035
  • Figure 67: Eastern Europe Market Y-o-Y Growth Comparison by Product, 2025 to 2035
  • Figure 68: Eastern Europe Market Attractiveness Analysis by Product
  • Figure 69: Eastern Europe Market Value Share and BPS Analysis by Application, 2025 and 2035
  • Figure 70: Eastern Europe Market Y-o-Y Growth Comparison by Application, 2025 to 2035
  • Figure 71: Eastern Europe Market Attractiveness Analysis by Application
  • Figure 72: Eastern Europe Market Value Share and BPS Analysis by Dosage Form, 2025 and 2035
  • Figure 73: Eastern Europe Market Y-o-Y Growth Comparison by Dosage Form, 2025 to 2035
  • Figure 74: Eastern Europe Market Attractiveness Analysis by Dosage Form
  • Figure 75: Eastern Europe Market Value Share and BPS Analysis by Distribution Channel, 2025 and 2035
  • Figure 76: Eastern Europe Market Y-o-Y Growth Comparison by Distribution Channel, 2025 to 2035
  • Figure 77: Eastern Europe Market Attractiveness Analysis by Distribution Channel
  • Figure 78: East Asia Market Value Share and BPS Analysis by Country, 2025 and 2035
  • Figure 79: East Asia Market Value Share and BPS Analysis by Product, 2025 and 2035
  • Figure 80: East Asia Market Y-o-Y Growth Comparison by Product, 2025 to 2035
  • Figure 81: East Asia Market Attractiveness Analysis by Product
  • Figure 82: East Asia Market Value Share and BPS Analysis by Application, 2025 and 2035
  • Figure 83: East Asia Market Y-o-Y Growth Comparison by Application, 2025 to 2035
  • Figure 84: East Asia Market Attractiveness Analysis by Application
  • Figure 85: East Asia Market Value Share and BPS Analysis by Dosage Form, 2025 and 2035
  • Figure 86: East Asia Market Y-o-Y Growth Comparison by Dosage Form, 2025 to 2035
  • Figure 87: East Asia Market Attractiveness Analysis by Dosage Form
  • Figure 88: East Asia Market Value Share and BPS Analysis by Distribution Channel, 2025 and 2035
  • Figure 89: East Asia Market Y-o-Y Growth Comparison by Distribution Channel, 2025 to 2035
  • Figure 90: East Asia Market Attractiveness Analysis by Distribution Channel
  • Figure 91: South Asia & Pacific Market Value Share and BPS Analysis by Country, 2025 and 2035
  • Figure 92: South Asia & Pacific Market Value Share and BPS Analysis by Product, 2025 and 2035
  • Figure 93: South Asia & Pacific Market Y-o-Y Growth Comparison by Product, 2025 to 2035
  • Figure 94: South Asia & Pacific Market Attractiveness Analysis by Product
  • Figure 95: South Asia & Pacific Market Value Share and BPS Analysis by Application, 2025 and 2035
  • Figure 96: South Asia & Pacific Market Y-o-Y Growth Comparison by Application, 2025 to 2035
  • Figure 97: South Asia & Pacific Market Attractiveness Analysis by Application
  • Figure 98: South Asia & Pacific Market Value Share and BPS Analysis by Dosage Form, 2025 and 2035
  • Figure 99: South Asia & Pacific Market Y-o-Y Growth Comparison by Dosage Form, 2025 to 2035
  • Figure 100: South Asia & Pacific Market Attractiveness Analysis by Dosage Form
  • Figure 101: South Asia & Pacific Market Value Share and BPS Analysis by Distribution Channel, 2025 and 2035
  • Figure 102: South Asia & Pacific Market Y-o-Y Growth Comparison by Distribution Channel, 2025 to 2035
  • Figure 103: South Asia & Pacific Market Attractiveness Analysis by Distribution Channel
  • Figure 104: Middle East and Africa Market Value Share and BPS Analysis by Country, 2025 and 2035
  • Figure 105: Middle East and Africa Market Value Share and BPS Analysis by Product, 2025 and 2035
  • Figure 106: Middle East and Africa Market Y-o-Y Growth Comparison by Product, 2025 to 2035
  • Figure 107: Middle East and Africa Market Attractiveness Analysis by Product
  • Figure 108: Middle East and Africa Market Value Share and BPS Analysis by Application, 2025 and 2035
  • Figure 109: Middle East and Africa Market Y-o-Y Growth Comparison by Application, 2025 to 2035
  • Figure 110: Middle East and Africa Market Attractiveness Analysis by Application
  • Figure 111: Middle East and Africa Market Value Share and BPS Analysis by Dosage Form, 2025 and 2035
  • Figure 112: Middle East and Africa Market Y-o-Y Growth Comparison by Dosage Form, 2025 to 2035
  • Figure 113: Middle East and Africa Market Attractiveness Analysis by Dosage Form
  • Figure 114: Middle East and Africa Market Value Share and BPS Analysis by Distribution Channel, 2025 and 2035
  • Figure 115: Middle East and Africa Market Y-o-Y Growth Comparison by Distribution Channel, 2025 to 2035
  • Figure 116: Middle East and Africa Market Attractiveness Analysis by Distribution Channel
  • Figure 117: Global Market - Tier Structure Analysis
  • Figure 118: Global Market - Company Share Analysis

Frequently Asked Questions

What is the expected size of the inhalable biologics market by 2035?

The market is projected to reach USD 18.9 billion by 2035.

What is the anticipated CAGR of the inhalable biologics market during 2025 to 2035?

The market is expected to grow at a CAGR of 16.2% between 2025 and 2035.

What is the estimated size of the inhalable biologics market in 2025?

The market size is projected to be USD 4.6 billion in 2025.

What is the share of proteins and peptides in the inhalable biologics market in 2025?

Proteins and peptides will dominate the product segment with a 57.8% share in 2025.

What is the share of dry powder inhalers in the dosage form segment in 2025?

Dry powder inhalers are projected to account for 38.5% of the dosage form market share in 2025.

Explore Similar Insights

Future Market Insights

Inhalable Biologics Market