Reports

- Global Locations -

Headquarters

Future Market Insights, Inc.

Christiana Corporate, 200
Continental Drive, Suite 401,
Newark, Delaware - 19713,
United States

T: +1-845-579-5705

Americas

Future Market Insights, Inc.

616 Corporate Way, Suite 2-9018,
Valley Cottage, NY 10989, United States

T: +1-347-918-3531

MEA

Future Market Insights

1602-6 Jumeirah Bay X2 Tower, Plot No: JLT-PH2-X2A,
Jumeirah Lakes Towers, Dubai,
United Arab Emirates

Europe

Future Market Insights

3rd Floor, 207 Regent Street,
W1B 3HH London
United Kingdom

T: + 44 (0) 20 8123 9659
D: +44 (0) 20 3287 4268

Asia Pacific

Future Market Insights

IndiaLand Global Tech Park, Unit UG-1, Behind Grand HighStreet, Phase 1, Hinjawadi, MH, Pune – 411057, India

Retinal Biologics Market Outlook (2022-2028)

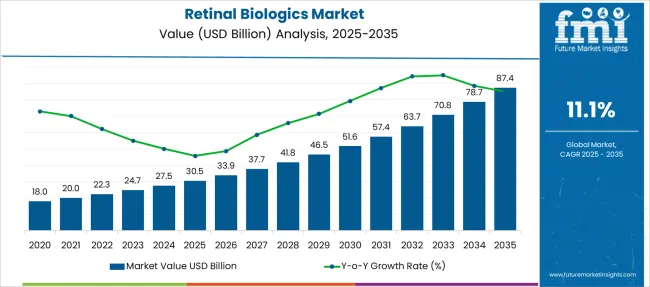
[194 Pages Report] Retinal biologics market revenue totaled US$ 19.96 Billion in 2021. The global market is expected to reach US$ 41.92 Billion by 2028, surging at a CAGR of 11.1% over the period of 2022 to 2028.

Attribute Details
Retinal Biologics Market Size (2022) US$ 22.25 Billion
Sales Forecast (2028) US$ 41.92 Billion
Global Market Growth Rate (2022 to 2028) 11.1% CAGR
Share of Top 5 Players 50%

Retinal biologics accounted for 6.9% share of the global biologic therapeutics market in 2021.

Don't pay for what you don't need

Customize your report by selecting specific countries or regions and save 30%!

How The Market Progressed Till June 2022?

Particulars Details
H1, 2021 11.08%
H1, 2022 Projected 11.14%
H1, 2022 Outlook 10.94%
BPS Change - H1, 2022 (O) - H1, 2022 (P) (-) 20 ↓
BPS Change - H1, 2022 (O) - H1, 2021 (-) 14 ↓

According to Future Market Insights' analysis, the global retinal biologics market expects to drop by 14 Basis Point Share (BPS) in H1-2022 as compared to H1- 2021. Whereas in comparison to H1-2022 Projected value, the market during H1-2022 outlook period will show a dip of 20 BPS.

The availability of very few retinal biologics, their severe side effects, rigorous regulatory standards involved with obtaining biologics approvals, and the exorbitant cost of effective drugs and biologics are all contributing factors to the drop in BPS values.

The market will however witness a positive growth outlook over the forecast period, owed to the increasing intensive research activities for the production of novel biologics for novel disease therapeutics.

The key development in the market includes innovations in ocular drug delivery to the retina with the development of intravitreal drugs. The retinal biologics market is subject to macroeconomic and industrial factors in accordance to stringent regulatory standards and approval activities for biologics.

Demand Analysis Of Retinal Biologics From 2013-2021 Vs Future Market Outlook For 2022-2028

“Rising Burden of Retinal Diseases to Boost Overall Market Growth”

From 2013 to 2021, the global retinal biologics market registered significant gains, experiencing a CAGR worth 10.2%

Retinal biologics are bioengineered molecules that are implanted inside the eyes to heal chronic retinal diseases. Biologics are generally produced from living organisms such as microorganisms, or animal or plant cells. Some of the retinal biologics used for retinal diseases are Eylea, Lucentis, Humira, Macugen, and others.

Increased frequency of retinal diseases such as age-related macular degeneration around the world is driving the market expansion. According to WHO statistics, nearly 2.2 billion individuals worldwide suffer from near or distance vision impairment. As the prevalence of vision impairment rises, the need for effective therapeutic alternatives, such as retinal biologics, is rising as well.

Retinal biologics are a new class of medications that target specific markers in the patient's body to alleviate the symptoms of a variety of systemic or ocular disorders that present in the eye.

Retinal Biologics Market

Considering these factors, the market is projected to witness high growth over the forecast period, registering an impressive CAGR of 11.1% to reach US$ 41.92 Bn by 2028.

What Are The Major Factors Driving Retinal Biologics Market Growth?

“Rising R&D Activities in Retinal Gene Therapies to Fuel Market Expansion”

The market will be driven by a strong focus on R&D connected with retinal gene therapies conducted by different institutes, biologics firms, and innovative product releases by prominent market participants in the form of biologics and implants. Efforts to develop a complementary therapeutic treatment will boost the market growth.

“Market Growth Complemented by Increasing Burden of Retinal Diseases”

Diabetic retinopathy has been a rising concern as the disease leads to vision loss among type I and type II adult diabetic patients. Diabetic macular edema also results from the consequences of diabetic retinopathy, which leads to the swelling of the macula. Moreover, increasing burden of other retinal diseases such as uveitis and orbital inflammation is another factor surging demand for retinal drugs and biologics.

Retinal gene therapy is a therapeutic approach wherein inherited defective genes are replaced by treatment with DNA or RNA. Retinal gene therapy is considered to be a significant approach as there occurs less contamination, and the viral vector can easily accommodate within the eyes.

What Are The Key Restraints Towards The Retinal Biologics Market Growth?

“Regulatory Obstructions Likely to Hinder Demand for Retinal Biologics”

Limited availability of retinal biologics, hazardous biologic side effects, and limited access for retinal biologics and efficient treatments due to higher costs are restraining the market growth.

The market is being challenged by the side effects of retinal biologics, which include retinal tear, sickness, and eye pain. Governing authorities' strict regulatory compliances associated with biologics approval are impeding industry growth.

Sabyasachi Ghosh
Sabyasachi Ghosh

Principal Consultant

Talk to Analyst

Find your sweet spots for generating winning opportunities in this market.

How Is North America Propelling Demand For Retinal Biologics?

“Ongoing Advancements in Biologics for Retinal Treatment”

North America is expected to have a significant share in the global retinal biologics market. Continuous improvements in healthcare infrastructure, as well as an increase in the number of cases of retinal illnesses and favorable reimbursement policies, are expected to promote market expansion in the region.

Prominent presence of key manufacturers and increased healthcare spending are driving market growth in the region. Growing diabetes population is a major driver in the development of biologics for retinal treatment in North America.
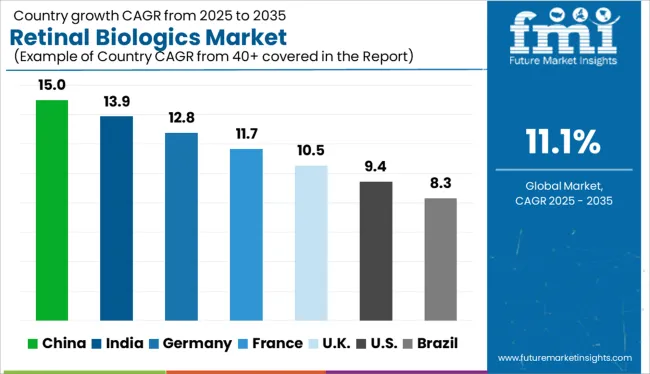
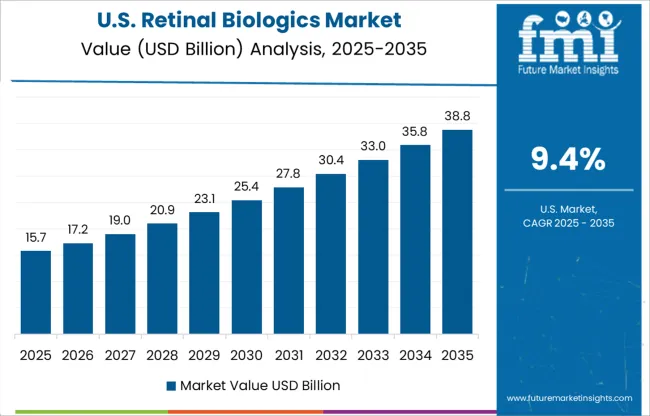
Country-Wise Analysis

Why is the U.S. Retinal Biologics Market Growing at a Rapid Pace?

“Increased Prevalence of Diabetic Macular Edema to Augment Demand for Retinal Biologics”

Diabetic retinopathy is a disease that affects people who have diabetes. Diabetic retinopathy is the major cause of new incidents of blindness in adults aged 20 to 74 years in the United States.

According to a new research study released by the Centers for Disease Control and Prevention, more than 100 million persons in the United States currently have diabetes or prediabetes.

In addition, researchers are working on innovative strategies to treat diabetic macular edema. As a result, rising R&D spending in the country as well as risk factors that contribute to disease development will have an impact on the retinal biologics market in the U.S. over the forecast period.

What is the Demand Outlook for Retinal Biologics in China?

“Rising Efforts for Development of Retinal Drugs to Drive Market Growth.”

The market in China is expected to grow due to rapidly rising cases of uveitis, diabetic retinopathy, and macular degeneration. Diabetes is exacerbated by a shift in lifestyle and an increase in bad eating habits, as a result of these factors, the global market for retinal drugs and biologics is expected to expand significantly.

Along with increasing incidence of eye diseases, there are a growing number of research initiatives focused on retinal drugs. Furthermore, growing geriatric population, which is becoming a target patient pool for retinal biologics, will boost market growth in China.

Get the data you need at a Fraction of the cost

Personalize your report by choosing insights you need
and save 40%!

Category-Wise Insights

Which Drug Class is Projected to Get Traction in Retinal Biologics?

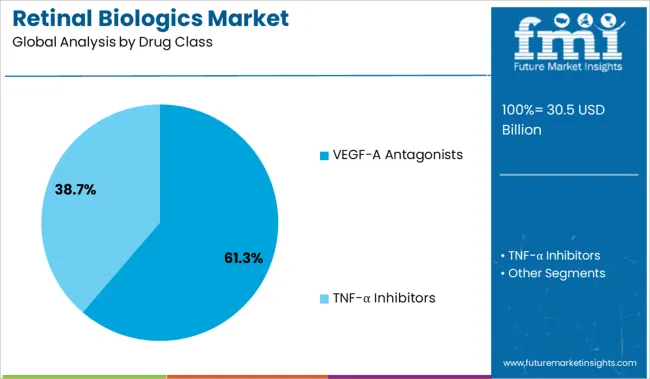
“VEGF-A Antagonists Most Preferred as They are Largely Tolerated & Give Instant Results to Eye Disorders.”

VEGF-A antagonists are used to treat eye damage and enhance corneal wound healing. The global retinal biologics market is also expected to be fueled by the rising prevalence of other retinal illnesses such as orbital inflammation and uveitis.

VEGF-A antagonists are commonly given for the treatment of diabetic retinopathy and diabetic macular edema. In the case of non-infectious uveitis, it is seen to be the ideal alternative to typical suppressing treatments.

Many firms have focused on VEGF-A antagonists because they reduce angiogenesis. Manufacturers are investing in the development of retinal biologics in a similar field due to the widespread acceptance of VEGF-A antagonist therapy.

Which Indication Dominates Retinal Biologics Demand Growth?

“Increasing Adoption of Retinal Biologics for Macular Degeneration Treatment”

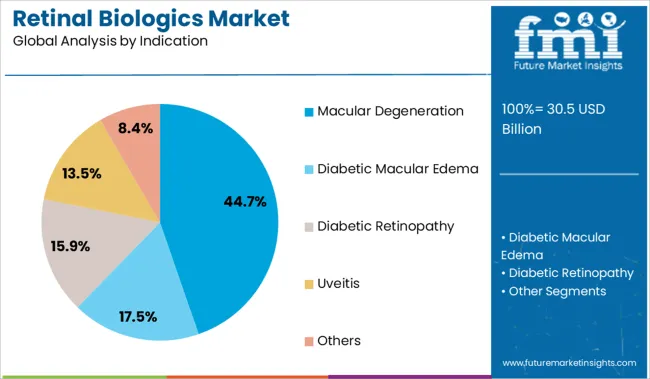
Macular degeneration indication is expected to account 36.9% share of the retinal biologics market in 2022. Macular Degeneration is a vision loss condition that affects the macula.

Despite the availability of improved treatment alternatives, the global retinal biologics market is likely to benefit from the increased prevalence of macular degeneration. According to the American Macular Degeneration Foundation, the prevalence is higher than the combined rates of cataracts and glaucoma in over 10 million Americans (AMDF).

Because macular degeneration primarily affects adults aged 50 and over, the prevalence of MD continues to go up, despite improving treatment choices, as the population ages.
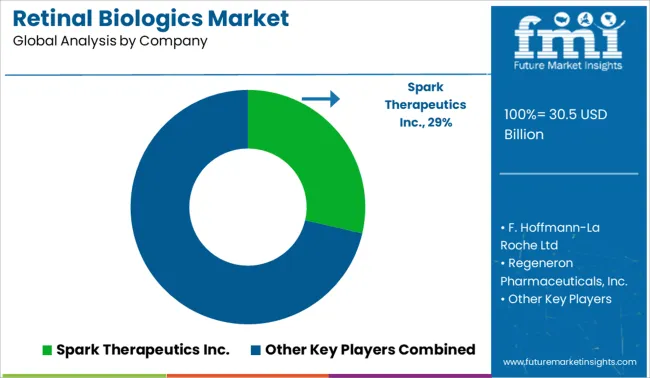
COVID-19 Impact On Market Expansion

The COVID-19 pandemic has had a massive effect on the worldwide healthcare system, resulting in a decreased focus on retinal biologics. The COVID-19 pandemic has disrupted global care patterns and prompted broad modifications in disease management across a wide range of therapeutic disciplines. Ophthalmology was one of the first areas to be affected.

The retinal biologics industry is expected to recover soon, owing to an increase in research efforts and significant government support. The importance of treatments and disease control protocols may increase demand for retinal biologics over the coming years

Competitive Landscape

Several companies are entering into licensing and collaboration agreements to expand their products into various countries across the world to cater to unmet demand. Leading market players are concentrating their efforts on research & development to discover new medications and improve treatment options.

For instance,

  • In 2021, SemaThera Inc. and Roche established a multi-year research and licensing relationship to expand SemaThera's novel biologics portfolio for the treatment of ischemic retinal illnesses such as diabetic retinopathy.

Retinal Biologics Industry Report Scope

Attribute Details
Forecast Period 2022 to 2028
Historical Data Available for 2013 to 2021
Market Analysis Value in US$ Million
Key Regions Covered
  • North America
  • Latin America
  • Europe
  • East Asia
  • South Asia & Pacific
  • Middle East & Africa (MEA)
Key Countries Covered
  • USA.
  • Canada
  • Mexico
  • Brazil
  • Mexico
  • Argentina
  • Germany
  • Italy
  • France
  • UK
  • Nordic
  • Spain
  • Japan
  • China
  • India
  • Malaysia
  • Thailand
  • Australia
  • GCC Countries
  • South Africa
  • Turkey
Key Market Segments Covered
  • Drug Class
  • Indication
  • Distribution Channel
  • Region
Key Companies Profiled
  • Spark Therapeutics, Inc.
  • F. Hoffmann-La Roche Ltd.
  • Regeneron Pharmaceuticals, Inc.
  • AbbVie Inc.
  • Amgen Inc.
  • Novartis Pharma AG
  • MeiraGTx Limited
  • Oxurion NV
  • Santen Pharmaceutical Co., Ltd.
  • Bayer AG
  • Bausch Health Companies Inc.
  • Merck & Co., Inc.
Pricing Available upon Request

Key Segments of Retinal Biologics Industry Survey

Retinal Biologics Market by Drug Class:

  • VEGF-A Antagonists
  • TNF-α Inhibitors

Retinal Biologics Market by Indication:

  • Macular Degeneration
  • Diabetic Macular Edema
  • Diabetic Retinopathy
  • Uveitis
  • Others

Retinal Biologics Market by Distribution Channel:

  • Institutional Sales
  • Retail Pharmacies
  • Mail Order Pharmacies
  • Retail Sales

Retinal Biologics Market by Region:

  • North America Retinal Biologics Market
  • Latin America Retinal Biologics Market
  • Europe Retinal Biologics Market
  • East Asia Retinal Biologics Market
  • South Asia & Pacific Retinal Biologics Market
  • Middle East & Africa (MEA) Retinal Biologics Market

Frequently Asked Questions

What is the estimated growth rate of the global retinal biologics market?

The global retinal biologics market is estimated to exhibit a CAGR of 11.1% during the forecast period (2022-2028).

Which segment has the largest share in retinal biologics?

Macular degeneration accounts for 36.9% share of the retinal biologics market.

What is the projected market value for retinal biologics?

The global retinal biologics market is expected to reach a valuation of US$ 41.92 Bn by 2028.

What key trends are driving growth of the retinal biologics market?

Increasing prevalence of diabetic eye diseases and significant R&D investments for developing biologics are key trends driving market growth.

Which are the top companies in the retinal biologics market?

Major players operating in the market include Spark Therapeutics, Inc., F. Hoffmann-La Roche Ltd., Regeneron Pharmaceuticals, Inc., AbbVie Inc., and Amgen Inc.

Table of Content

1. Executive Summary

    1.1. Market Overview

    1.2. Market Analysis

    1.3. FMI Analysis and Recommendations

    1.4. Wheel of Fortune

2. Market Introduction

    2.1. Market Taxonomy

    2.2. Market Definition

3. Global Economic Outlook

    3.1. Gross Domestic Indication Type by Region & Country, 2006 – 2021

    3.2. Global Healthcare Market Indicators

4. Market Opportunity Analysis

    4.1. Macro-Economic Factors

    4.2. Opportunity Analysis

5. Market Dynamics

    5.1. Drivers

        5.1.1. Supply Side Drivers

        5.1.2. Demand Side Drivers

    5.2. Restraints

    5.3. Trends

6. Key Inclusion

    6.1. Key Regulations

    6.2. Reimbursement Scenario

    6.3. Pricing Analysis

7. North America Market Analysis 2013–2021 and Forecast 2022–2028

    7.1. Introduction

    7.2. Historical Market Size (US$ Mn) Analysis by Country, 2013-2021

        7.2.1. U.S.

        7.2.2. Canada

    7.3. Market Size (US$ Mn) Forecast By Country, 2022-2028

    7.4. Historical Market Size (US$ Mn) and Trend Analysis by Drug Class, 2013-2021

        7.4.1. VEGF-An antagonist

        7.4.2. TNF-α inhibitor

    7.5. Market Size (US$ Mn) Forecast By Drug Class, 2022-2028

    7.6. Historical Market Size (US$ Mn) and Trend Analysis by Indication, 2013-2021

        7.6.1. Macular Degeneration

        7.6.2. Diabetic Retinopathy

        7.6.3. Diabetic Macular Edema

        7.6.4. Uveitis

        7.6.5. Others

    7.7. Market Size (US$ Mn) and Forecast By Indication, 2022-2028

    7.8. Historical Market Size (US$ Mn) and Trend Analysis by Distributional Channel, 2013-2021

        7.8.1. Institutional Sales

            7.8.1.1. Specialty Clinics

            7.8.1.2. Hospitals

        7.8.2. Retail Sales

            7.8.2.1. Retail Pharmacies

            7.8.2.2. Mail Order Pharmacies

    7.9. Market Size (US$ Mn) Forecast By Distributional Channel, 2022-2028

    7.10. Market Attractiveness Analysis

        7.10.1. By Country

        7.10.2. By Drug Class

        7.10.3. By Indication

        7.10.4. By Distributional Channel

    7.11. Drivers and Restraints: Impact Analysis

    7.12. Key Market Participants – Intensity Mapping

8. Latin America Market Analysis 2013–2021 and Forecast 2022–2028

    8.1. Introduction

    8.2. Regional Market Trends

    8.3. Historical Market Size (US$ Mn) Analysis by Country, 2013-2021

        8.3.1. Brazil

        8.3.2. Mexico

        8.3.3. Argentina

        8.3.4. Rest of Latin America

    8.4. Market Size (US$ Mn) Forecast By Country, 2022-2028

    8.5. Historical Market Size (US$ Mn) and Trend Analysis by Drug Class, 2013-2021

        8.5.1. VEGF-A antagonist

        8.5.2. TNF-α inhibitor

    8.6. Market Size (US$ Mn) Forecast By Drug Class, 2022-2028

    8.7. Historical Market Size (US$ Mn) and Trend Analysis by Indication, 2013-2021

        8.7.1. Macular Degeneration

        8.7.2. Diabetic Retinopathy

        8.7.3. Diabetic Macular Edema

        8.7.4. Uveitis

        8.7.5. Others 

    8.8. Market Size (US$ Mn) and Forecast By Indication, 2022-2028

    8.9. Historical Market Size (US$ Mn) and Trend Analysis by Distributional Channel, 2013-2021

        8.9.1. Institutional Sales

            8.9.1.1. Specialty Clinics

            8.9.1.2. Hospitals

        8.9.2. Retail Sales

            8.9.2.1. Retail Pharmacies

            8.9.2.2. Mail Order Pharmacies

    8.10. Market Size (US$ Mn) Forecast By Distributional Channel, 2022-2028

    8.11. Market Attractiveness Analysis

        8.11.1. By Country

        8.11.2. By Drug Class

        8.11.3. By Indication

        8.11.4. By Distributional Channel

    8.12. Drivers and Restraints: Impact Analysis

    8.13. Key Market Participants – Intensity Mapping

9. Western Europe Market Analysis 2013–2021 and Forecast 2022–2028

    9.1. Introduction

    9.2. Historical Market Size (US$ Mn) Analysis by Country, 2013-2021

        9.2.1. Germany

        9.2.2. U.K

        9.2.3. France

        9.2.4. Italy

        9.2.5. Spain

        9.2.6. Rest of Western Europe

    9.3. Market Size (US$ Mn) Forecast By Country, 2022-2028

    9.4. Historical Market Size (US$ Mn) and Trend Analysis by Drug Class, 2013-2021

        9.4.1. VEGF-A antagonist

        9.4.2. TNF-α inhibitor

    9.5. Market Size (US$ Mn) Forecast By Drug Class, 2022-2028

    9.6. Historical Market Size (US$ Mn) and Trend Analysis by Indication, 2013-2021

        9.6.1. Macular degeneration

        9.6.2. Diabetic Retinopathy

        9.6.3. Diabetic Macular Edema

        9.6.4. Uveitis

        9.6.5. Others

    9.7. Market Size (US$ Mn) and Forecast By Indication, 2022-2028

    9.8. Historical Market Size (US$ Mn) and Trend Analysis by Distributional Channel, 2013-2021

        9.8.1. Institutional Sales

            9.8.1.1. Specialty Clinics

            9.8.1.2. Hospitals

        9.8.2. Retail Sales

            9.8.2.1. Retail Pharmacies

            9.8.2.2. Mail Order Pharmacies

    9.9. Market Size (US$ Mn) Forecast By Distributional Channel, 2022-2028

    9.10. Market Attractiveness Analysis

        9.10.1. By Country

        9.10.2. By Drug Class

        9.10.3. By Indication

        9.10.4. By Distributional Channel

    9.11. Drivers and Restraints: Impact Analysis

    9.12. Key Market Participants – Intensity Mapping

10. Eastern Europe Market Analysis 2013–2021 and Forecast 2022–2028

    10.1. Introduction

    10.2. Historical Market Size (US$ Mn) Analysis by Country, 2013-2021

        10.2.1. Russia

        10.2.2. Poland

        10.2.3. Rest of Eastern Europe

    10.3. Market Size (US$ Mn) Forecast By Country, 2022-2028

    10.4. Historical Market Size (US$ Mn) and Trend Analysis by Drug Class, 2013-2021

        10.4.1. VEGF-A antagonist

        10.4.2. TNF-α inhibitor

    10.5. Market Size (US$ Mn) Forecast By Drug Class, 2022-2028

    10.6. Historical Market Size (US$ Mn) and Trend Analysis by Indication, 2013-2021

        10.6.1. Macular degeneration

        10.6.2. Diabetic Retinopathy

        10.6.3. Diabetic Macular Edema

        10.6.4. Uveitis

        10.6.5. Others

    10.7. Market Size (US$ Mn) and Forecast By Indication, 2022-2028

    10.8. Historical Market Size (US$ Mn) Trend Analysis by Distributional Channel, 2013-2021

        10.8.1. Institutional Sales

            10.8.1.1. Specialty Clinics

            10.8.1.2. Hospitals

        10.8.2. Retail Sales

            10.8.2.1. Retail Pharmacies

            10.8.2.2. Mail Order Pharmacies

    10.9. Market Size (US$ Mn) Forecast By Distributional Channel, 2022-2028

    10.10. Market Attractiveness Analysis

        10.10.1. By Country

        10.10.2. By Drug Class

        10.10.3. By Indication

        10.10.4. By Distributional Channel

    10.11. Drivers and Restraints: Impact Analysis

    10.12. Key Market Participants – Intensity Mapping

11. Asia Pacific Excluding Japan Market Analysis 2013–2021 and Forecast 2022–2028

    11.1. Introduction

    11.2. Historical Market Size (US$ Mn) Analysis by Country, 2013-2021

        11.2.1. China

        11.2.2. India

        11.2.3. Australia and New Zealand

        11.2.4. ASEAN

        11.2.5. Rest of APEJ

    11.3. Market Size (US$ Mn) Forecast By Country, 2022-2028

    11.4. Historical Market Size (US$ Mn) and Trend Analysis by Drug Class, 2013-2021

        11.4.1. VEGF-A antagonist

        11.4.2. TNF-α inhibitor

    11.5. Market Size (US$ Mn) Forecast By Drug Class, 2022-2028

    11.6. Historical Market Size (US$ Mn) and Trend Analysis by Indication, 2013-2021

        11.6.1. Macular degeneration

        11.6.2. Diabetic Retinopathy

        11.6.3. Diabetic Macular Edema

        11.6.4. Uveitis

        11.6.5. Others

    11.7. Market Size (US$ Mn) and Forecast By Indication, 2022-2028

    11.8. Historical Market Size (US$ Mn) and Trend Analysis by Distributional Channel, 2013-2021

        11.8.1. Institutional Sales

            11.8.1.1. Specialty Clinics

            11.8.1.2. Hospitals

        11.8.2. Retail Sales

            11.8.2.1. Retail Pharmacies

            11.8.2.2. Mail Order Pharmacies

    11.9. Market Size (US$ Mn) Forecast By Distributional Channel, 2022-2028

    11.10. Market Attractiveness Analysis

        11.10.1. By Country

        11.10.2. By Drug Class

        11.10.3. By Indication

        11.10.4. By Distributional Channel

    11.11. Drivers and Restraints: Impact Analysis

    11.12. Key Market Participants – Intensity Mapping

12. Japan Market Analysis 2013–2021 and Forecast 2022–2028

    12.1. Introduction

    12.2. Historical Market Size (US$ Mn) and Trend Analysis by Drug Class, 2013-2021

        12.2.1. VEGF-A antagonist

        12.2.2. TNF-α inhibitor

    12.3. Market Size (US$ Mn) and Forecast By Drug Class, 2022-2028

    12.4. Historical Market Size (US$ Mn) and Trend Analysis by Indication, 2013-2021

        12.4.1. Macular degeneration

        12.4.2. Diabetic Retinopathy

        12.4.3. Diabetic Macular Edema

        12.4.4. Uveitis

        12.4.5. Others 

    12.5. Market Size (US$ Mn) Forecast By Indication, 2022-2028

    12.6. Historical Market Size (US$ Mn) Trend Analysis by Distributional Channel, 2013-2021

        12.6.1. Institutional Sales

            12.6.1.1. Specialty Clinics

            12.6.1.2. Hospitals

        12.6.2. Retail Sales

            12.6.2.1. Retail Pharmacies

            12.6.2.2. Mail Order Pharmacies

    12.7. Market Size (US$ Mn) Forecast By Distributional Channel, 2022-2028

    12.8. Market Attractiveness Analysis

        12.8.1. By Drug Class

        12.8.2. By Indication

        12.8.3. By Distributional Channel

    12.9. Drivers and Restraints: Impact Analysis

    12.10. Key Market Participants – Intensity Mapping

13. Middle East and Africa Market Analysis 2013–2021 and Forecast 2022–2028

    13.1. Introduction

    13.2. Historical Market Size (US$ Mn) Analysis by Country, 2013-2021

        13.2.1. GCC Countries

        13.2.2. South Africa

        13.2.3. Rest of Middle East and Africa

    13.3. Market Size (US$ Mn) Forecast By Country, 2022-2028

    13.4. Historical Market Size (US$ Mn) and Trend Analysis by Drug Class, 2013-2021

        13.4.1. VEGF-A antagonist

        13.4.2. TNF-α inhibitor

    13.5. Market Size (US$ Mn) Forecast By Drug Class, 2022-2028

    13.6. Historical Market Size (US$ Mn) and Trend Analysis by Indication, 2013-2021

        13.6.1. Macular degeneration

        13.6.2. Diabetic Retinopathy

        13.6.3. Diabetic Macular Edema

        13.6.4. Uveitis

        13.6.5. Others 

    13.7. Market Size (US$ Mn) and Forecast By Indication, 2022-2028

    13.8. Historical Market Size (US$ Mn) Trend Analysis by Distributional Channel, 2013-2021

        13.8.1. Institutional Sales

            13.8.1.1. Specialty Clinics

            13.8.1.2. Hospitals

        13.8.2. Retail Sales

            13.8.2.1. Retail Pharmacies

            13.8.2.2. Mail Order Pharmacies

    13.9. Market Size (US$ Mn) Forecast By Distributional Channel, 2022-2028

    13.10. Market Attractiveness Analysis

        13.10.1. By Country

        13.10.2. By Drug Class

        13.10.3. By Indication

        13.10.4. By Distributional Channel

    13.11. Drivers and Restraints: Impact Analysis

    13.12. Key Market Participants – Intensity Mapping

14. Forecast Factors: Relevance and Impact

15. Forecast Assumptions

16. Competition Analysis

    16.1. Competition Dashboard

    16.2. Competitors Deep Dive

        16.2.1. Spark Therapeutics Inc.

            16.2.1.1. Overview

            16.2.1.2. Key Financials

            16.2.1.3. SWOT Analysis

            16.2.1.4. Key Developments

            16.2.1.5. Key Strategy

        16.2.2. F. Hoffmann-La Roche Ltd

            16.2.2.1. Overview

            16.2.2.2. Key Financials

            16.2.2.3. SWOT Analysis

            16.2.2.4. Key Developments

            16.2.2.5. Key Strategy

        16.2.3. Regeneron Pharmaceuticals, Inc.

            16.2.3.1. Overview

            16.2.3.2. Key Financials

            16.2.3.3. SWOT Analysis

            16.2.3.4. Key Developments

            16.2.3.5. Key Strategy

        16.2.4. AbbVie Inc

            16.2.4.1. Overview

            16.2.4.2. Key Financials

            16.2.4.3. SWOT Analysis

            16.2.4.4. Key Developments

            16.2.4.5. Key Strategy

        16.2.5. Johnson & Johnson Services, Inc

            16.2.5.1. Overview

            16.2.5.2. Key Financials

            16.2.5.3. SWOT Analysis

            16.2.5.4. Key Developments

            16.2.5.5. Key Strategy

        16.2.6. Amgen Inc.

            16.2.6.1. Overview

            16.2.6.2. Key Financials

            16.2.6.3. SWOT Analysis

            16.2.6.4. Key Developments

            16.2.6.5. Key Strategy

17. Global Market Analysis 2013–2021 and Forecast 2022–2028 by Region

    17.1. Introduction / Key Findings

    17.2. Historical Market Size (US$ Mn) Analysis by Region

        17.2.1. North America

        17.2.2. Latin America

        17.2.3. Western Europe

        17.2.4. Eastern Europe

        17.2.5. Asia Pacific Excluding Japan 

        17.2.6. Japan

        17.2.7. Middle East and Africa

    17.3. Market Size (US$ Mn) Forecast By Region

    17.4. Market Attractiveness Analysis by Region

18. Global Market Analysis 2013–2021 and Forecast 2022–2028, By Drug Class

    18.1. Introduction/Key Finding

    18.2. Historical Market Size (US$ Mn) Analysis by Drug Class, 2013-2021

        18.2.1. VEGF-A antagonist

        18.2.2. TNF-α inhibitor

    18.3. Market Size (US$ Mn) Forecast By Drug Class, 2022-2028

    18.4. Market Attractiveness Analysis by Drug Class

19. Global Market Analysis 2013–2021 and Forecast 2022–2028, By Indication

    19.1. Introduction/Key Finding

    19.2. Historical Market Size (US$ Mn) Analysis by Indication, 2013-2021

        19.2.1. Macular degeneration

        19.2.2. Diabetic Retinopathy

        19.2.3. Diabetic Macular Edema

        19.2.4. Uveitis

        19.2.5. Others 

    19.3. Market Size (US$ Mn) Forecast By Indication, 2022-2028

    19.4. Market Attractiveness Analysis by Indication

20. Global Market Analysis 2013–2021 and Forecast 2022–2028, By Distributional Channel

    20.1. Introduction/Key Finding

    20.2. Historical Market Size (US$ Mn) Analysis by Distributional Channel, 2013-2021

        20.2.1. Institutional Sales

            20.2.1.1. Specialty Clinics

            20.2.1.2. Hospitals

        20.2.2. Retail Sales

            20.2.2.1. Retail Pharmacies

            20.2.2.2. Mail Order Pharmacies

    20.3. Market Size (US$ Mn) Forecast By Distributional Channel, 2022-2028

    20.4. Market Attractiveness Analysis by Distributional Channel

21. Global Market Analysis 2013–2021 and Forecast 2022–2028

    21.1. Global Market Value Analysis (US$ Mn)

    21.2. Absolute $ Opportunity

22. Assumptions and Acronyms Used

23. Research Methodology

Don't pay for what you don't need

Customize your report by selecting specific countries or regions and save 30%!

List of Tables

Table 01: Expenditure on Health, (% of GDP), by Country, 2013 - 2021

Table 02: Expenditure on Health, (% of GDP), by Country, 2013 - 2021

Table 03: North America Market Size (US$ Mn) Analysis 2013-2021 and Forecast 2022-2028, By Country

Table 04: North America Market Size (US$ Mn) Analysis 2013-2021 and Forecast 2022-2028, By Drug Class

Table 05: North America Market Size (US$ Mn) Analysis 2013-2021 and Forecast 2022-2028, By Indication

Table 06: North America Market Size (US$ Mn) Analysis 2013-2021 and Forecast 2022-2028, By Distribution Channel

Table 07: Latin America Market Size (US$ Mn) Analysis 2013-2021 and Forecast 2022-2028, By Country

Table 08: Latin America Market Size (US$ Mn) Analysis 2013-2021 and Forecast 2022-2028, By Drug Class

Table 09: Latin America Market Size (US$ Mn) Analysis 2013-2021 and Forecast 2022-2028, By Indication

Table 10: Latin America Market Size (US$ Mn) Analysis 2013-2021 and Forecast 2022-2028, By Distribution Channel

Table 11: Western Europe Market Size (US$ Mn) Analysis 2013-2021 and Forecast 2022-2028, By Country

Table 12: Western Europe Market Size (US$ Mn) Analysis 2013-2021 and Forecast 2022-2028, By Drug Class

Table 13: Western Europe Market Size (US$ Mn) Analysis 2013-2021 and Forecast 2022-2028, By Indication

Table 14: Western Europe Market Size (US$ Mn) Analysis 2013-2021 and Forecast 2022-2028, By Distribution Channel

Table 15: Eastern Europe Market Size (US$ Mn) Analysis 2013-2021 and Forecast 2022-2028, By Country

Table 16: Eastern Europe Market Size (US$ Mn) Analysis 2013-2021 and Forecast 2022-2028, By Drug Class

Table 17: Eastern Europe Market Size (US$ Mn) Analysis 2013-2021 and Forecast 2022-2028, By Indication

Table 18: Eastern Europe Market Size (US$ Mn) Analysis 2013-2021 and Forecast 2022-2028, By Distribution Channel

Table 19: Asia Pacific Excluding Japan Market Size (US$ Mn) Analysis 2013-2021 and Forecast 2022-2028, By Country

Table 20: Asia Pacific Excluding Japan Market Size (US$ Mn) Analysis 2013-2021 and Forecast 2022-2028, By Drug Class

Table 21: Asia Pacific Excluding Japan Market Size (US$ Mn) Analysis 2013-2021 and Forecast 2022-2028, By Indication

Table 22: Asia Pacific Excluding Japan Market Size (US$ Mn) Analysis 2013-2021 and Forecast 2022-2028, By Distribution Channel

Table 23: Japan Market Size (US$ Mn) Analysis 2013-2021 and Forecast 2022-2028, By Drug Class

Table 24: Japan Market Size (US$ Mn) Analysis 2013-2021 and Forecast 2022-2028, By Indication

Table 25: Japan Market Size (US$ Mn) Analysis 2013-2021 and Forecast 2022-2028, By Distribution Channel

Table 26: Middle East and Africa Market Size (US$ Mn) Analysis 2013-2021 and Forecast 2022-2028, By Country

Table 27: Middle East and Africa Market Size (US$ Mn) Analysis 2013-2021 and Forecast 2022-2028, By Drug Class

Table 28: Middle East and Africa Market Size (US$ Mn) Analysis 2013-2021 and Forecast 2022-2028, By Indication

Table 29: Middle East and Africa Market Size (US$ Mn) Analysis 2013-2021 and Forecast 2022-2028, By Distribution Channel

Table 30: Global Market Size (US$ Mn) Analysis 2013-2021 and Forecast 2022-2028, By Region

Table 31: Global Market Size (US$ Mn) Analysis 2013-2021 and Forecast 2022-2028, By Drug Class

Table 32: Global Market Size (US$ Mn) Analysis 2013-2021 and Forecast 2022-2028, By Indication

Table 33: Global Market Size (US$ Mn) Analysis 2013-2021 and Forecast 2022-2028, By Distribution Channel
Sabyasachi Ghosh
Sabyasachi Ghosh

Principal Consultant

Talk to Analyst

Find your sweet spots for generating winning opportunities in this market.

List of Charts

Figure 1: Global Market Value (US$ Mn), by Regions

Figure 2: Global Market Value Share By Drug Class (2021)

Figure 3: Global Market Value Share By Indication (2021)

Figure 4: Global Market Value Share By Distributional Channel

Figure 5: Global Healthcare Expenditure in US$ Tn (2013–2021)

Figure 6: North America Market Size (US$ Mn) Analysis, 2013–2021

Figure 7: North America Market Size (US$ Mn) & Y-o-Y Growth (%),

Figure 8: North America Market Analysis by Country –2022 & 2028

Figure 9: North America Market Y-o-Y Growth Projections by Country, 2022 – 2028

Figure 10: North America Market Attractiveness Analysis by Country, 2022 – 2028

Figure 11: North America Market Analysis by Drug Class–2022 & 2028

Figure 12: North America Market Y-o-Y Growth Projections by Drug Class, 2022 – 2028

Figure 13: North America Market Attractiveness Analysis by Drug Class, 2022 – 2028

Figure 14: North America Market Analysis by Indication–2022 & 2028

Figure 15: North America Market Y-o-Y Growth Projections by Indication, 2022 – 2028

Figure 16: North America Market Attractiveness Analysis by Indication, 2022 – 2028

Figure 17: North America Market Analysis by Distribution Channel–2022 & 2028

Figure 18: North America Market Y-o-Y Growth Projections by Distribution Channel, 2022 – 2028

Figure 19: North America Market Attractiveness Analysis by Distribution Channel, 2022 – 2028

Figure 20: Latin America Market Size (US$ Mn) Analysis, 2013–2021

Figure 21: Latin America Market Size (US$ Mn) & Y-o-Y Growth (%),

Figure 22: Latin America Market Analysis by Country –2022 & 2028

Figure 23: Latin America Market Y-o-Y Growth Projections by Country, 2022 – 2028

Figure 24: Latin America Market Attractiveness Analysis by Country, 2022 – 2028

Figure 25: Latin America Market Analysis by Drug Class–2022 & 2028

Figure 26: Latin America Market Y-o-Y Growth Projections by Drug Class, 2022 – 2028

Figure 27: Latin America Market Attractiveness Analysis by Drug Class, 2022 – 2028

Figure 28: Latin America Market Analysis by Indication–2022 & 2028

Figure 29: Latin America Market Y-o-Y Growth Projections by Indication, 2022 – 2028

Figure 30: Latin America Market Attractiveness Analysis by Indication, 2022 – 2028

Figure 31: Latin America Market Analysis by Distribution Channel–2022 & 2028

Figure 32: Latin America Market Y-o-Y Growth Projections by Distribution Channel, 2022 – 2028

Figure 33: Latin America Market Attractiveness Analysis by Distribution Channel, 2022 – 2028

Figure 34: Western Europe Market Size (US$ Mn) Analysis, 2013–2021

Figure 35: Western Europe Market Size (US$ Mn) & Y-o-Y Growth (%),

Figure 36: Western Europe Market Analysis by Country –2022 & 2028

Figure 37: Western Europe Market Y-o-Y Growth Projections by Country, 2022 – 2028

Figure 38: Western Europe Market Attractiveness Analysis by Country, 2022 – 2028

Figure 39: Western Europe Market Analysis by Drug Class–2022 & 2028

Figure 40: Western Europe Market Y-o-Y Growth Projections by Drug Class, 2022 – 2028

Figure 41: Western Europe Market Attractiveness Analysis by Drug Class, 2022 – 2028

Figure 42: Western Europe Market Analysis by Indication–2022 & 2028

Figure 43: Western Europe Market Y-o-Y Growth Projections by Indication, 2022 – 2028

Figure 44: Western Europe Market Attractiveness Analysis by Indication, 2022 – 2028

Figure 45: Western Europe Market Analysis by Distribution Channel–2022 & 2028

Figure 46: Western Europe Market Y-o-Y Growth Projections by Distribution Channel, 2022 – 2028

Figure 47: Western Europe Market Attractiveness Analysis by Distribution Channel, 2022 – 2028

Figure 48: Eastern Europe Market Size (US$ Mn) Analysis, 2013–2021

Figure 49: Eastern Europe Market Size (US$ Mn) & Y-o-Y Growth (%),

Figure 50: Eastern Europe Market Analysis by Country –2022 & 2028

Figure 51: Eastern Europe Market Y-o-Y Growth Projections by Country, 2022 – 2028

Figure 52: Eastern Europe Market Attractiveness Analysis by Country, 2022 – 2028

Figure 53: Eastern Europe Market Analysis by Drug Class–2022 & 2028

Figure 54: Eastern Europe Market Y-o-Y Growth Projections by Drug Class, 2022 – 2028

Figure 55: Eastern Europe Market Attractiveness Analysis by Drug Class, 2022 – 2028

Figure 56: Eastern Europe Market Analysis by Indication–2022 & 2028

Figure 57: Eastern Europe Market Y-o-Y Growth Projections by Indication, 2022 – 2028

Figure 58: Eastern Europe Market Attractiveness Analysis by Indication, 2022 – 2028

Figure 59: Eastern Europe Market Analysis by Distribution Channel–2022 & 2028

Figure 60: Eastern Europe Market Y-o-Y Growth Projections by Distribution Channel, 2022 – 2028

Figure 61: Eastern Europe Market Attractiveness Analysis by Distribution Channel, 2022 – 2028

Figure 62: Asia Pacific Excluding Japan Market Size (US$ Mn) Analysis, 2013–2021

Figure 63: Asia Pacific Excluding Japan Market Size (US$ Mn) & Y-o-Y Growth (%), 2022–2028

Figure 64: Asia Pacific Excluding Japan Market Analysis by Country –2022 & 2028

Figure 65: Asia Pacific Excluding Japan Market Y-o-Y Growth Projections by Country, 2022 – 2028

Figure 66: Asia Pacific Excluding Japan Market Attractiveness Analysis by Country, 2022 – 2028

Figure 67: Asia Pacific Excluding Japan Market Analysis by Drug Class–2022 & 2028

Figure 68: Asia Pacific Excluding Japan Market Y-o-Y Growth Projections by Drug Class, 2022 – 2028

Figure 69: Asia Pacific Excluding Japan Market Attractiveness Analysis by Drug Class, 2022 – 2028

Figure 70: Asia Pacific Excluding Japan Market Analysis by Indication–2022 & 2028

Figure 71: Asia Pacific Excluding Japan Market Y-o-Y Growth Projections by Indication, 2022 – 2028

Figure 72: Asia Pacific Excluding Japan Market Attractiveness Analysis by Indication, 2022 – 2028

Figure 73: Asia Pacific Excluding Japan Market Analysis by Distribution Channel–2022 & 2028

Figure 74: Asia Pacific Excluding Japan Market Y-o-Y Growth Projections by Distribution Channel, 2022 – 2028

Figure 75: Asia Pacific Excluding Japan Market Attractiveness Analysis by Distribution Channel, 2022 – 2028

Figure 76: Japan Market Size (US$ Mn) Analysis, 2013–2021

Figure 77: Japan Market Size (US$ Mn) & Y-o-Y Growth (%), 2022–2028

Figure 78: Japan Market Analysis by Drug Class–2022 & 2028

Figure 79: Japan Market Y-o-Y Growth Projections by Drug Class, 2022 – 2028

Figure 80: Japan Market Attractiveness Analysis by Drug Class, 2022 – 2028

Figure 81: Japan Market Analysis by Indication–2022 & 2028

Figure 82: Japan Market Y-o-Y Growth Projections by Indication, 2022 – 2028

Figure 83: Japan Market Attractiveness Analysis by Indication, 2022 – 2028

Figure 84: Japan Market Analysis by Distribution Channel–2022 & 2028

Figure 85: Japan Market Y-o-Y Growth Projections by Distribution Channel, 2022 – 2028

Figure 86: Japan Market Attractiveness Analysis by Distribution Channel, 2022 – 2028

Figure 87: Middle East and Africa Market Size (US$ Mn) Analysis, 2013–2021

Figure 88: Middle East and Africa Market Size (US$ Mn) & Y-o-Y Growth (%), 2022–2028

Figure 89: Middle East and Africa Market Analysis by Country –2022 & 2028

Figure 90: Middle East and Africa Market Y-o-Y Growth Projections by Country, 2022 – 2028

Figure 91: Middle East and Africa Market Attractiveness Analysis by Country, 2022 – 2028

Figure 92: Middle East and Africa Market Analysis by Drug Class–2022 & 2028

Figure 93: Middle East and Africa Market Y-o-Y Growth Projections by Drug Class, 2022 – 2028

Figure 94: Middle East and Africa Market Attractiveness Analysis by Drug Class, 2022 – 2028

Figure 95: Middle East and Africa Market Analysis by Indication–2022 & 2028

Figure 96: Middle East and Africa Market Y-o-Y Growth Projections by Indication, 2022 – 2028

Figure 97: Middle East and Africa Market Attractiveness Analysis by Indication, 2022 – 2028

Figure 98: Middle East and Africa Market Analysis by Distribution Channel–2022 & 2028

Figure 99: Middle East and Africa Market Y-o-Y Growth Projections by Distribution Channel, 2022 – 2028

Figure 100: Middle East and Africa Market Attractiveness Analysis by Distribution Channel, 2022 – 2028

Figure 101: Global Market Size (US$ Mn) Analysis 2013-2021 and Forecast 2022-2028, By Region

Figure 102: Global Market Size (US$ Mn) Analysis 2013-2021 and Forecast 2022-2028, By Drug Class

Figure 103: Global Market Size (US$ Mn) Analysis 2013-2021 and Forecast 2022-2028, By Indication

Figure 104: Global Market Size (US$ Mn) Analysis 2013-2021 and Forecast 2022-2028, By Distribution Channel

Figure 105: Global Market Size (US$ Mn) Analysis, 2013–2021

Figure 106: Global Market Size (US$ Mn) & Y-o-Y Growth (%),

Figure 107: Global Market Absolute $ Opportunity, 2013–2028

Recommendations

Healthcare

Veterinary Biologics Market

Published : January 2024

Healthcare

Orthobiologics Market

Published : January 2023

Healthcare

Retinal Biologics Market

Published : July 2022

Healthcare

Biologic Excipients Market

Published : June 2022

Explore Healthcare Insights

View Reports