Reports

- Global Locations -

Headquarters

Future Market Insights, Inc.

Christiana Corporate, 200
Continental Drive, Suite 401,
Newark, Delaware - 19713,
United States

T: +1-347-918-3531

Americas

Future Market Insights, Inc.

616 Corporate Way, Suite 2-9018,
Valley Cottage, NY 10989, United States

MEA

Future Market Insights

1602-6 Jumeirah Bay X2 Tower, Plot No: JLT-PH2-X2A,
Jumeirah Lakes Towers, Dubai,
United Arab Emirates

Europe

Future Market Insights

3rd Floor, 207 Regent Street,
W1B 3HH London
United Kingdom

T: + 44 (0) 20 8123 9659

Asia Pacific

Future Market Insights

IndiaLand Global Tech Park, Unit UG-1, Behind Grand HighStreet, Phase 1, Hinjawadi, MH, Pune – 411057, India

Retinal Laser Photocoagulation Market Outlook (2023 to 2033)

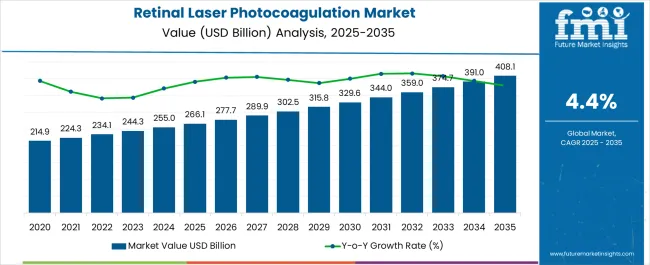
The retinal laser photocoagulation market size is projected to be worth US$ 254.4 million in 2023. The market is likely to surpass US$ 399.9 million by 2033 at a CAGR of 4.6% during the forecast period. The market growth is being propelled by increased minimally invasive treatments. There is an increasing focus on minimally invasive treatments in the field of ophthalmology, including retinal laser photocoagulation. Compared to traditional surgical interventions, retinal laser photocoagulation offers a less invasive alternative with shorter recovery times and reduced risk of complications.

Retinal laser photocoagulation allows for targeted treatment of specific areas of the retina while preserving the surrounding healthy tissue. The laser energy is absorbed by the targeted abnormal blood vessels or retinal tissue, causing them to coagulate and seal off, without affecting the nearby healthy structures. This targeted approach minimizes collateral damage and helps preserve overall retinal function.

Other Drivers Propelling the Demand for Retinal Laser Photocoagulation include:

  • There is a growing emphasis on regular eye examinations and early detection of retinal disorders. Increased awareness among patients and healthcare professionals about the benefits of retinal laser photocoagulation for treating these conditions has contributed to market growth.
  • Reimbursement policies and insurance coverage for retinal laser photocoagulation procedures vary by country and region. However, in many cases, reimbursement policies have become more favorable, making the procedure more affordable for patients and driving market growth.
  • Imaging systems, such as optical coherence tomography (OCT) and fundus cameras, play a crucial role in guiding retinal laser photocoagulation procedures enables better visualization of retinal structures, improved treatment planning, and real-time monitoring during the procedure
  • Retinal disorders, such as diabetic retinopathy, age-related macular degeneration, and retinal vein occlusion, are on the rise globally. The growing prevalence of these conditions is driving the demand for retinal laser photocoagulation procedures.

Challenges for Companies /Manufacturers in the Retinal Laser Photocoagulation:

  • Retinal laser photocoagulation procedures require specialized equipment and devices, which can be expensive to acquire and maintain. The high cost can limit the accessibility of retinal laser photocoagulation, particularly in regions with limited healthcare resources or patients with limited financial means.
  • While retinal laser photocoagulation is generally considered safe, there are potential risks and complications associated with the procedure. These can include damage to the surrounding retinal tissue, visual field loss, scarring, and the possibility of the treated condition recurring. The potential risks and complications need to be carefully considered and managed, which can influence the decision-making process for both healthcare professionals and patients.

Opportunities in the Retinal laser photocoagulation Industry:

  • Combination therapies involving retinal laser photocoagulation and other treatment modalities, such as anti-VEGF injections or sustained-release drug delivery systems, present opportunities for improved outcomes in the management of retinal disorders. The development and adoption of effective combination therapies can lead to enhanced treatment efficacy, reduced treatment burden, and improved patient outcomes.
  • There is a growing emphasis on patient-centered care and personalized medicine in healthcare. Applying this approach to retinal laser photocoagulation can involve tailoring the treatment to individual patient characteristics, optimizing treatment parameters, and improving patient experience and satisfaction.
  • Remote diagnosis, treatment planning, and follow-up can be facilitated through telemedicine platforms, allowing patients in underserved areas or those with limited mobility to access retinal laser photocoagulation procedures conveniently. The development of remote treatment technologies and devices can unlock new market segments and improve patient outcomes.

Latest Trends in the Retinal laser photocoagulation:

  • The integration of artificial intelligence and machine learning algorithms in retinal imaging and treatment planning is an emerging trend in the field. This trend has the potential to improve treatment accuracy, reduce variability, and optimize outcomes in retinal laser photocoagulation.
  • There is an increasing emphasis on improving the patient experience and satisfaction in retinal care, including retinal laser photocoagulation. Healthcare providers are focusing on streamlining treatment processes, minimizing waiting times, and enhancing communication and education for patients. This trend aims to enhance patient engagement, compliance, and overall treatment outcomes.
  • The healthcare industry is increasingly focusing on value-based care, which emphasizes improved patient outcomes and cost-effectiveness. In the context of retinal laser photocoagulation, this trend encourages the development of treatment protocols and technologies that demonstrate superior clinical outcomes, reduced treatment burden, and improved quality of life for patients.
  • The COVID-19 pandemic has accelerated the adoption of telemedicine and remote healthcare services. This trend has also impacted the retinal laser photocoagulation market, with the use of telemedicine platforms for remote consultation, diagnosis, and follow-up care.
Attributes Details
Retinal Laser Photocoagulation Size (2023) US$ 254.4 million
Retinal Laser Photocoagulation Projected Size (2033) US$ 399.9 million
Value CAGR (2023 to 2033) 4.6%

Don't pay for what you don't need

Customize your report by selecting specific countries or regions and save 30%!

2017 to 2022 Retinal laser photocoagulation market Demand Outlook Compared to 2023 to 2033 Forecast

From 2017 to 2022, the global retinal laser photocoagulation experienced a CAGR of 4.4%, reaching a market size of US$ 254.4 million in 2023.

From 2017 to 2022, the global retinal laser photocoagulation industry witnessed steady growth due to growing emphasis on adoption of telemedicine, Combination therapies involving retinal laser photocoagulation and other treatment modalities continue to gain attention.

The combination of retinal laser photocoagulation with anti-VEGF injections or corticosteroid implants has shown promise in treating conditions such as diabetic macular edema and retinal vein occlusion.

Future Forecast for Retinal laser photocoagulation Industry:

Looking ahead, the global retinal laser photocoagulation industry is expected to rise at a CAGR of 4.6% from 2023 to 2033. During the forecast period, the market size is expected to reach US$ 399.9 million by 2033.

The retinal laser photocoagulation industry is expected to continue its growth trajectory from 2023 to 2033, driven by increasing technological advancements and integration of AI. Partnerships and collaborations can accelerate the development and commercialization of advanced retinal laser photocoagulation devices and expand market opportunities.

Ongoing research and development efforts focused on further understanding retinal disorders, improving treatment protocols, and developing innovative laser systems and techniques can unlock new opportunities in the retinal laser photocoagulation market. Continued investment in research can lead to the discovery of novel treatment targets, better understanding of disease mechanisms, and the development of more effective and safer treatment options.
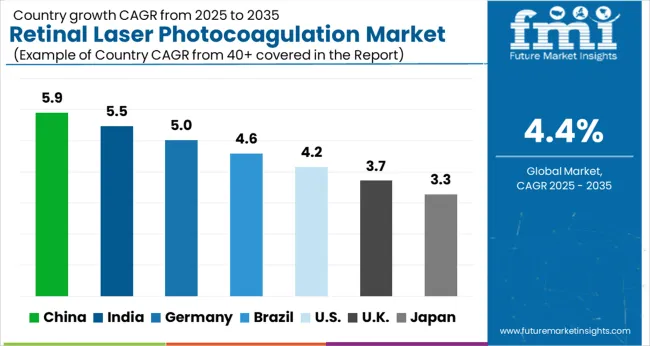
Comparative View of the Retinal laser photocoagulation

Retinal Laser Photocoagulation:

Attributes Retinal Laser Photocoagulation
CAGR (2023 to 2033) 4.6%
Market Value (2033) US$ 399.9 million
Opportunity Continuous technological advancements in laser technology, imaging systems, and treatment techniques present opportunities for further improving the efficacy, precision, and safety of retinal laser photocoagulation procedures.
Key Trends While retinal laser photocoagulation is already considered a minimally invasive treatment option, there is a growing demand for even less invasive alternatives. Emerging trends include the development of non-invasive laser technologies, such as selective retina therapy (SRT), which offer targeted treatment with minimal impact on surrounding tissues.

Retinal Vein Occlusion Treatment Market:

Attributes Retinal Vein Occlusion Treatment Market
CAGR (2023 to 2033) 5.9%
Market Value (2033) US$ 4.7 billion
Opportunity Pharmacological therapies, including anti-vascular endothelial growth factor (anti-VEGF) injections and corticosteroids, have revolutionized the treatment of retinal vein occlusion. The development of novel drugs and sustained-release drug delivery systems for RVO treatment presents opportunities for market expansion.
Key Trends There is a growing interest in generating real-world evidence and conducting outcomes research in the field of RVO treatment. Real-world data can provide insights into the effectiveness and safety of various treatment strategies, help identify unmet needs, and guide clinical decision-making.

Retinal Biologics Market:

Attributes Retinal Biologics Market
CAGR (2023 to 2033) 11.1%
Market Value (2033) US$ 49.2 billion
Opportunity The field of retinal biologics is witnessing advancements in the development of novel biologic drugs and therapies. This includes the introduction of new anti-vascular endothelial growth factor (anti-VEGF) agents, gene therapies, cell-based therapies, and other biologic modalities.
Key Trends Gene therapies have emerged as a promising approach for the treatment of inherited retinal disorders, such as retinitis pigmentosa and Leber congenital amaurosis. The market is witnessing advancements in gene therapy techniques, including the use of viral vectors for delivering therapeutic genes to the retina.
Sabyasachi Ghosh
Sabyasachi Ghosh

Principal Consultant

Talk to Analyst

Find your sweet spots for generating winning opportunities in this market.

Country-Wise Insights

Retinal laser photocoagulation to Surge in the United States Due to Rising Subthreshold Laser Therapies.

Country The United States
Market Size (US$ million) by End of Forecast Period (2033) US$ 109.4 million
CAGR % 2023 to End of Forecast (2033) 4.8%

The retinal laser photocoagulation industry in the United States is expected to reach a market size of US$ 109.4 million by 2033, expanding at a CAGR of 4.8%. In United States, Subthreshold laser therapy is an emerging trend in retinal laser photocoagulation. This technique involves delivering laser energy at a level below the threshold of inducing visible retinal burns. Subthreshold laser therapy aims to achieve therapeutic effects while minimizing the visible tissue damage and potential complications associated with traditional laser photocoagulation. It is being explored as a potential treatment option for diabetic macular edema and other retinal conditions.

Rise in Use of Micropulse Laser Technology for Retinal laser photocoagulation is Propelled the United Kingdom Market Growth

Country The United Kingdom
Market Size (US$ million) by End of Forecast Period (2033) US$ 13.9 million
CAGR % 2023 to End of Forecast (2033) 4.0%

The retinal laser photocoagulation industry in the United Kingdom is expected to reach a market value of US$ 13.9 million, expanding at a CAGR of 4.0% during the forecast period. Micro pulse laser technology is gaining popularity in the UK for retinal laser photocoagulation. This technique utilizes repetitive short pulses of laser energy with intervals of rest, allowing for better heat dissipation and minimizing damage to the surrounding retinal tissue. Micropulse laser photocoagulation offers a more gentle and potentially less destructive treatment approach, particularly in the management of macular edema and retinal vascular disorders.

Notable Growth Expected in China's Retinal laser photocoagulation due to Increased Focus on Telemedicine

Country China
Market Size (US$ million) by End of Forecast Period (2033) US$ 35.1 million
CAGR % 2023 to End of Forecast (2033) 5.5%

The retinal laser photocoagulation industry in China is anticipated to reach a market size of US$ 35.1 million, moving at a CAGR of 5.5% during the forecast period. Telemedicine is becoming more prevalent in China, especially in remote areas where access to specialized retinal care is limited. Telemedicine platforms enable remote assessment, diagnosis, and treatment planning for retinal conditions. This trend improves access to retinal laser photocoagulation for patients in underserved regions and helps in timely identification and management of retinal disorders.
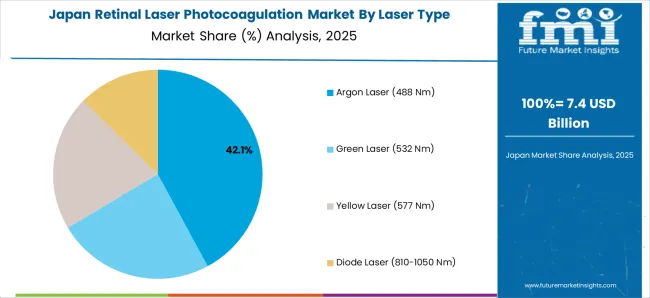
Increased Utilization of Navigated Laser Technology is Driving Market Growth in Japan

Country Japan
Market Size (US$ million) by End of Forecast Period (2033) US$ 24.7 million
CAGR % 2023 to End of Forecast (2033) 5.3%

The retinal laser photocoagulation industry in Japan is estimated to reach a market size of US$ 24.7 million by 2033, thriving at a CAGR of 5.3%. Navigated laser technology, which involves the integration of imaging and laser systems, is gaining popularity in Japan. This technology allows for precise targeting of laser treatment based on real-time imaging, such as optical coherence tomography (OCT). Navigated laser photocoagulation improves treatment accuracy and reduces the risk of damage to healthy retinal tissue.
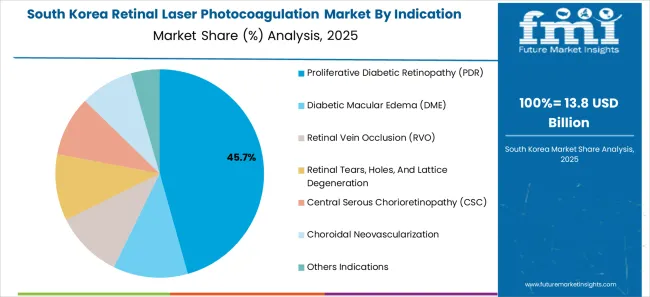
Demand for Retinal Laser Photocoagulation is Rising Due to Combination Therapies in South Korea

Country South Korea
Market Size (US$ million) by End of Forecast Period (2033) US$ 15.3 million
CAGR % 2023 to End of Forecast (2033) 4.9%

The retinal laser photocoagulation industry in South Korea is expected to reach a market size of US$ 15.3 million, expanding at a CAGR of 4.9% during the forecast period. There is an increasing use of combination therapies involving retinal laser photocoagulation and other treatment modalities, such as anti-VEGF injections or corticosteroids. Combination therapies aim to provide comprehensive and synergistic effects in the management of retinal diseases, particularly conditions like diabetic retinopathy and macular edema.

Category-Wise Insights

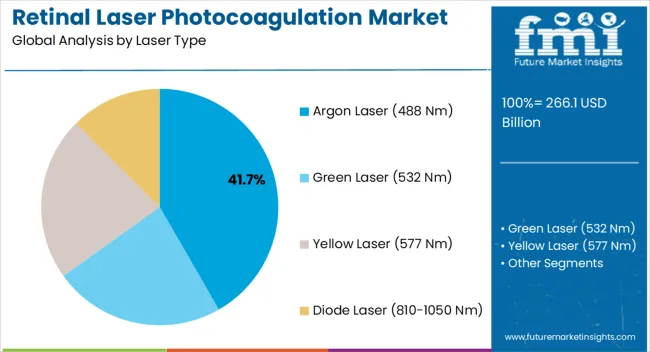
Argon Laser (488 nm) to Dominate Retinal Laser Photocoagulation Industry with 5.3% CAGR through 2033

Argon laser is expected to dominate the retinal laser photocoagulation industry with a CAGR of 5.3% from 2023 to 2033. This segment captures a significant market share in 2023 due to its precision, coagulative effect & better penetration.

Argon laser systems offer precise & accurate targeting of the retina. The laser beam can be focused on specific areas of the retina requiring treatment, such as abnormal blood vessels or areas of retinal damage, allowing for precise & controlled application. This laser works by creating controlled thermal burns in the targeted retinal tissue.

Which Indication Are Driving the Retinal Laser Photocoagulation?

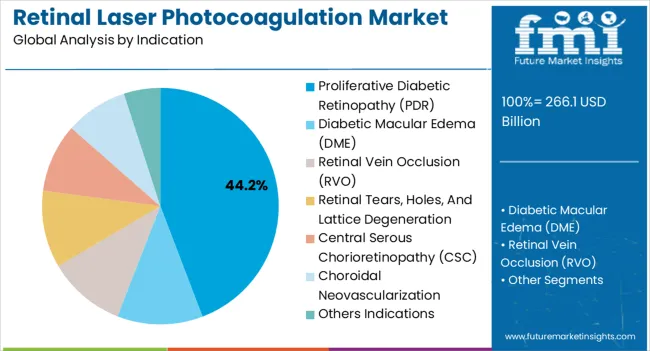
Proliferative diabetic retinopathy (PDR) are expected to dominate the retinal laser photocoagulation industry with a CAGR of 5.0% from 2023 to 2033. This segment captures a significant market share in 2023 as it helps in management of vascular regression, reducing the risk of vision loss & ischemic retina treatment.

PDR is often associated with areas of ischemic retina, where retina lacks sufficient blood supply. Retina laser photocoagulation can target these ischemic areas to stimulate oxygen & nutrient delivery to the targeted regions, potentially improving retinal health.

Which Device Modality is Widely Adopted the Retinal laser photocoagulation?

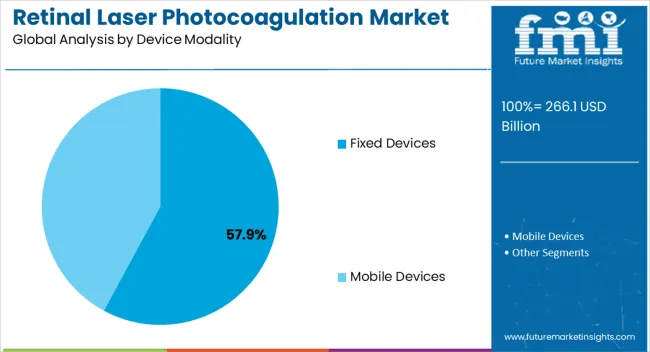
Fixed Devices is expected to dominate the retinal laser photocoagulation industry with a CAGR of 4.5% from 2023 to 2033. This segment captures a significant market share in 2023 as many fixed devices are equipped with integrated imaging systems such as fundus cameras or optical coherence tomography (OCT) modules. These imaging capabilities provide real-time visualization of the retina, allowing for accurate targeting of the laser treatment to specific areas of interest.

Which End User is Widely Adopted the Retinal laser photocoagulation?

The hospital segment is expected to dominate the retinal laser photocoagulation industry with a CAGR of 2.9% from 2023 to 2033. This segment captures a significant market share in 2023 as hospitals are typically having designated laser suites & treatment rooms equipped with advanced laser systems specifically designed for retinal procedures. These rooms provide a controlled & sterile environment where photocoagulation procedures can be performed safely & effectively.
Get the data you need at a Fraction of the cost

Personalize your report by choosing insights you need
and save 40%!

How Key Players Stay Competitive in the Retinal laser photocoagulation Industry?

The retinal laser photocoagulation is fiercely competitive, with many companies fighting for market dominance. To stay ahead of the competition in such a circumstance, essential players must develop effective conjugates.

Key Strategies Used by the Participants

  • Product Development

Companies invest heavily in research and development to deliver lasers that improve efficiency, dependability, and cost-effectiveness. Product innovation allows businesses to differentiate themselves from their competition while also catering to the changing demands of their clients.

  • Strategic Alliances & Collaborations

Key industry leaders frequently develop strategic partnerships and collaborations with other companies in order to harness their strengths and increase their market reach. Companies might also gain access to new technology and markets through such agreements.

  • Expansion into Emerging Markets

The retinal laser photocoagulation is expanding rapidly in emerging regions such as China and India. Key firms are enhancing their distribution networks and developing local manufacturing facilities to increase their presence in these areas.

  • Acquisitions and mergers

Mergers and acquisitions are frequently used by key players in the retinal laser photocoagulation business to consolidate their market position, extend their product range, and gain access to new markets.

Key Players in the Retinal Laser Photocoagulation Industry

  • Alcon
  • A.R.C Laser
  • Ellex Medical
  • Carl Zeiss
  • Quantel Medical
  • LightMed Corporation
  • Navilas
  • Norlase
  • NIDEK
  • Ziemer Opthalmic Systems
  • IRIDEX Corporation
  • Lumibird Medical
  • Lumenis Be Ltd.

Key Developments in the Retinal Laser Photocoagulation:

  • In May 2023, Norlase announced that the ECHO Green Pattern Laser photocoagulator has granted the CE Mark and FDA 510(k) certification. The first portable scanning laser photocoagulator in its field, ECHO uses MEMS technology.
  • In May 2023, Alcon stated that its advancements will be highlighted in more research than ever in company history at ASCRS 2023 annual conference, which will be held May 5-8 in San Diego.

Segmentation Analysis of the Retinal laser photocoagulation

By Laser Type:

  • Argon Laser (488 nm)
  • Green Laser (532 nm)
  • Yellow Laser (577 nm)
  • Diode Laser (810-1050 nm)

By Indication:

  • Proliferative Diabetic Retinopathy (PDR)
  • Diabetic Macular Edema (DME)
  • Retinal Vein Occlusion (RVO)
  • Retinal Tears, Holes, and Lattice Degeneration
  • Central Serous Chorioretinopathy (CSC)
  • Choroidal Neovascularization
  • Others Indications

By Device Modality:

  • Fixed Devices
  • Mobile Devices

By End User:

  • Hospitals
  • Ambulatory Surgical Centers
  • Ophthalmology Clinics

By Region:

  • North America
  • Latin America
  • Europe
  • East Asia
  • South Asia
  • Oceania
  • The Middle East & Africa

Frequently Asked Questions

What is the Market’s Growth Potential?

The CAGR of the market is 4.6% through 2033.

What is the Current Market Valuation?

In 2023, the market is anticipated to be worth US$ 254.4 million.

What is the Projected Size of The Market by 2033?

By 2033, the market is anticipated to achieve US$ 399.9 million.

What Category Is in The Spotlight for The Indication Segment?

From 2023 to 2033, proliferative diabetic retinopathy (PDR) is going to control the market with a CAGR of 5.0%.

Which is the Leading Segment in the Market by Laser Type?

With a CAGR of 5.3%, Argon laser is set to dominate the market.

Table of Content

1. Executive Summary

    1.1. Global Market Outlook

    1.2. Demand Side Trends

    1.3. Supply Side Trends

    1.4. Analysis and Recommendations

2. Market Overview

    2.1. Market Coverage / Taxonomy

    2.2. Market Definition / Scope / Limitations

    2.3. Inclusions and Exclusions

3. Key Market Trends

    3.1. Key Trends Impacting the Market

    3.2. Product Innovation / Development Trends

4. Value Added Insights

    4.1. Product Adoption by Region

    4.2. Technological Roadmap

    4.3. Install Base Scenario

    4.4. Regulatory Landscape

    4.5. PESTEL Analysis

    4.6. Porter’s Analysis

    4.7. Value Chain Analysis

5. Market Background

    5.1. Macro-Economic Factors

        5.1.1. Global GDP Growth Outlook

        5.1.2. Global Healthcare Expenditure Outlook

        5.1.3. Global Ophthalmic Lasers Market Overview

    5.2. Forecast Factors - Relevance & Impact

        5.2.1. Key Player’s Historic Growth

        5.2.2. Increasing Cases of Retinal Diabetic Retinopathy

        5.2.3. Favourable Government Regulations

        5.2.4. Rising Demand for Minimally Invasive Procedures

        5.2.5. Technological Advancement in Laser Types

        5.2.6. Increasing Prevalence of Retinal Disorders

        5.2.7. Frequency of Product Approvals

    5.3. Dynamics

        5.3.1. Drivers

        5.3.2. Restraints

        5.3.3. Opportunity Analysis

6. Global Market Volume (in Units) Analysis 2017 to 2022 and Forecast, 2023 to 2033

    6.1. Historical Volume (in Units) Analysis, 2017 to 2022

    6.2. Current and Future Volume (in Units) Projections, 2023 to 2033

        6.2.1. Y-o-Y Growth Trend Analysis

7. Global Market - Pricing Analysis

    7.1. Regional Pricing Analysis By Product

    7.2. Pricing Break-up

        7.2.1. Manufacturer Level Pricing

        7.2.2. Distributor Level Pricing

    7.3. Global Average Pricing Analysis Benchmark

    7.4. Pricing Assumptions

8. Global Market Demand (in Value or Size in US$ Million) Analysis 2017 to 2022 and Forecast, 2023 to 2033

    8.1. Historical Market Value (US$ Million) Analysis, 2017 to 2022

    8.2. Current and Future Market Value (US$ Million) Projections, 2023 to 2033

        8.2.1. Y-o-Y Growth Trend Analysis

        8.2.2. Absolute $ Opportunity Analysis

9. Global Market Analysis 2017 to 2022 and Forecast 2023 to 2033, By Laser Type

    9.1. Introduction / Key Findings

    9.2. Historical Market Size (US$ Million) and Volume (Units) Analysis By Laser Type, 2017 to 2022

    9.3. Current and Future Market Size (US$ Million) and Volume (Units) Analysis and Forecast By Laser Type, 2023 to 2033

        9.3.1. Argon Laser (488 nm)

        9.3.2. Green Laser (532 nm)

        9.3.3. Yellow Laser (577 nm)

        9.3.4. Diode Laser (810-1050 nm)

    9.4. Market Attractiveness Analysis By Laser Type

10. Global Market Analysis 2017 to 2022 and Forecast 2023 to 2033, By Indication

    10.1. Introduction / Key Findings

    10.2. Historical Market Size (US$ Million) Analysis By Indication, 2017 to 2022

    10.3. Current and Future Market Size (US$ Million) Analysis and Forecast By Indication, 2023 to 2033

        10.3.1. Proliferative Diabetic Retinopathy (PDR)

        10.3.2. Diabetic Macular Edema (DME)

        10.3.3. Retinal Vein Occlusion (RVO)

        10.3.4. Retinal Tears, Holes and Lattice Degeneration

        10.3.5. Central Serous Chorioretinopathy (CSC)

        10.3.6. Choroidal Neovascularization

        10.3.7. Others Indications

    10.4. Market Attractiveness Analysis By Indication

11. Global Market Analysis 2017 to 2022 and Forecast 2023 to 2033, By Device Modality

    11.1. Introduction / Key Findings

    11.2. Historical Market Size (US$ Million) Analysis By Device Modality, 2017 to 2022

    11.3. Current and Future Market Size (US$ Million) Analysis and Forecast By Device Modality, 2023 to 2033

        11.3.1. Fixed Devices

        11.3.2. Mobile Devices

    11.4. Market Attractiveness Analysis By Device Modality

12. Global Market Analysis 2017 to 2022 and Forecast 2023 to 2033, By End User

    12.1. Introduction / Key Findings

    12.2. Historical Market Size (US$ Million) Analysis By End User, 2017 to 2022

    12.3. Current and Future Market Size (US$ Million) Analysis and Forecast By End User, 2023 to 2033

        12.3.1. Hospitals

        12.3.2. Ambulatory Surgical Centers

        12.3.3. Ophthalmology Clinics

    12.4. Market Attractiveness Analysis By End User

13. Global Market Analysis 2017 to 2022 and Forecast 2023 to 2033, by Region

    13.1. Introduction

    13.2. Historical Market Size (US$ Million) and Volume (Units) Analysis By Region, 2017 to 2022

    13.3. Current and Future Market Size (US$ Million) and Volume (Units) Analysis and Forecast By Region, 2023 to 2033

        13.3.1. North America

        13.3.2. Latin America

        13.3.3. Europe

        13.3.4. South Asia

        13.3.5. East Asia

        13.3.6. Oceania

        13.3.7. Middle East and Africa (Middle East & Africa)

    13.4. Market Attractiveness Analysis By Region

14. North America Market Analysis 2017 to 2022 and Forecast 2023 to 2033

    14.1. Introduction

    14.2. Historical Market Size (US$ Million) and Volume (Units) Analysis By Market Taxonomy, 2017 to 2022

    14.3. Current and Future Market Size (US$ Million) and Volume (Units) Analysis and Forecast By Market Taxonomy, 2023 to 2033

        14.3.1. By Country

            14.3.1.1. USA

            14.3.1.2. Canada

        14.3.2. By Laser Type

        14.3.3. By Indication

        14.3.4. By Device Modality

        14.3.5. By End User

    14.4. Market Attractiveness Analysis

        14.4.1. By Country

        14.4.2. By Laser Type

        14.4.3. By Indication

        14.4.4. By Device Modality

        14.4.5. By End User

    14.5. Country Level Analysis & Forecast

        14.5.1. USA Market Analysis

            14.5.1.1. Introduction

            14.5.1.2. Market Analysis and Forecast by Market Taxonomy

                14.5.1.2.1. By Laser Type

                14.5.1.2.2. By Indication

                14.5.1.2.3. By Device Modality

                14.5.1.2.4. By End User

        14.5.2. Canada Market Analysis

            14.5.2.1. Introduction

            14.5.2.2. Market Analysis and Forecast by Market Taxonomy

                14.5.2.2.1. By Laser Type

                14.5.2.2.2. By Indication

                14.5.2.2.3. By Device Modality

                14.5.2.2.4. By End User

    14.6. Market Trends

    14.7. Key Market Participants - Intensity Mapping

    14.8. Drivers and Restraints - Impact Analysis

15. Latin America Market Analysis 2017 to 2022 and Forecast 2023 to 2033

    15.1. Introduction

    15.2. Historical Market Size (US$ Million) and Volume (Units) Analysis By Market Taxonomy, 2017 to 2022

    15.3. Current and Future Market Size (US$ Million) and Volume (Units) Analysis and Forecast By Market Taxonomy, 2023 to 2033

        15.3.1. By Country

            15.3.1.1. Brazil

            15.3.1.2. Mexico

            15.3.1.3. Argentina

            15.3.1.4. Rest of Latin America

        15.3.2. By Laser Type

        15.3.3. By Indication

        15.3.4. By Device Modality

        15.3.5. By End User

    15.4. Market Attractiveness Analysis

        15.4.1. By Country

        15.4.2. By Laser Type

        15.4.3. By Indication

        15.4.4. By Device Modality

        15.4.5. By End User

    15.5. Country Level Analysis & Forecast

        15.5.1. Brazil Market Analysis

            15.5.1.1. Introduction

            15.5.1.2. Market Analysis and Forecast by Market Taxonomy

                15.5.1.2.1. By Laser Type

                15.5.1.2.2. By Indication

                15.5.1.2.3. By Device Modality

                15.5.1.2.4. By End User

        15.5.2. Mexico Market Analysis

            15.5.2.1. Introduction

            15.5.2.2. Market Analysis and Forecast by Market Taxonomy

                15.5.2.2.1. By Laser Type

                15.5.2.2.2. By Indication

                15.5.2.2.3. By Device Modality

                15.5.2.2.4. By End User

        15.5.3. Argentina Market Analysis

            15.5.3.1. Introduction

            15.5.3.2. Market Analysis and Forecast by Market Taxonomy

                15.5.3.2.1. By Laser Type

                15.5.3.2.2. By Indication

                15.5.3.2.3. By Device Modality

                15.5.3.2.4. By End User

    15.6. Market Trends

    15.7. Key Market Participants - Intensity Mapping

    15.8. Drivers and Restraints - Impact Analysis

16. Europe Market Analysis 2017 to 2022 and Forecast 2023 to 2033

    16.1. Introduction

    16.2. Historical Market Size (US$ Million) and Volume (Units) Analysis By Market Taxonomy, 2017 to 2022

    16.3. Current and Future Market Size (US$ Million) and Volume (Units) Analysis and Forecast By Market Taxonomy, 2023 to 2033

        16.3.1. By Country

            16.3.1.1. Germany

            16.3.1.2. France

            16.3.1.3. Italy

            16.3.1.4. UK

            16.3.1.5. Spain

            16.3.1.6. Russia

            16.3.1.7. BENELUX

            16.3.1.8. Rest of Europe

        16.3.2. By Laser Type

        16.3.3. By Indication

        16.3.4. By Device Modality

        16.3.5. By End User

    16.4. Market Attractiveness Analysis

        16.4.1. By Country

        16.4.2. By Laser Type

        16.4.3. By Indication

        16.4.4. By Device Modality

        16.4.5. By End User

    16.5. Country Level Analysis & Forecast

        16.5.1. Germany Market Analysis

            16.5.1.1. Introduction

            16.5.1.2. Market Analysis and Forecast by Market Taxonomy

                16.5.1.2.1. By Laser Type

                16.5.1.2.2. By Indication

                16.5.1.2.3. By Device Modality

                16.5.1.2.4. By End User

        16.5.2. France Market Analysis

            16.5.2.1. Introduction

            16.5.2.2. Market Analysis and Forecast by Market Taxonomy

                16.5.2.2.1. By Laser Type

                16.5.2.2.2. By Indication

                16.5.2.2.3. By Device Modality

                16.5.2.2.4. By End User

        16.5.3. Italy Market Analysis

            16.5.3.1. Introduction

            16.5.3.2. Market Analysis and Forecast by Market Taxonomy

                16.5.3.2.1. By Laser Type

                16.5.3.2.2. By Indication

                16.5.3.2.3. By Device Modality

                16.5.3.2.4. By End User

        16.5.4. UK Market Analysis

            16.5.4.1. Introduction

            16.5.4.2. Market Analysis and Forecast by Market Taxonomy

                16.5.4.2.1. By Laser Type

                16.5.4.2.2. By Indication

                16.5.4.2.3. By Device Modality

                16.5.4.2.4. By End User

        16.5.5. Spain Market Analysis

            16.5.5.1. Introduction

            16.5.5.2. Market Analysis and Forecast by Market Taxonomy

                16.5.5.2.1. By Laser Type

                16.5.5.2.2. By Indication

                16.5.5.2.3. By Device Modality

                16.5.5.2.4. By End User

        16.5.6. Russia Market Analysis

            16.5.6.1. Introduction

            16.5.6.2. Market Analysis and Forecast by Market Taxonomy

                16.5.6.2.1. By Laser Type

                16.5.6.2.2. By Indication

                16.5.6.2.3. By Device Modality

                16.5.6.2.4. By End User

        16.5.7. BENELUX Market Analysis

            16.5.7.1. Introduction

            16.5.7.2. Market Analysis and Forecast by Market Taxonomy

                16.5.7.2.1. By Laser Type

                16.5.7.2.2. By Indication

                16.5.7.2.3. By Device Modality

                16.5.7.2.4. By End User

    16.6. Market Trends

    16.7. Key Market Participants - Intensity Mapping

    16.8. Drivers and Restraints - Impact Analysis

17. South Asia Market Analysis 2017 to 2022 and Forecast 2023 to 2033

    17.1. Introduction

    17.2. Historical Market Size (US$ Million) and Volume (Units) Analysis By Market Taxonomy, 2017 to 2022

    17.3. Current and Future Market Size (US$ Million) and Volume (Units) Analysis and Forecast By Market Taxonomy, 2023 to 2033

        17.3.1. By Country

            17.3.1.1. India

            17.3.1.2. Thailand

            17.3.1.3. Indonesia

            17.3.1.4. Malaysia

            17.3.1.5. Rest of South Asia

        17.3.2. By Laser Type

        17.3.3. By Indication

        17.3.4. By Device Modality

        17.3.5. By End User

    17.4. Market Attractiveness Analysis

        17.4.1. By Country

        17.4.2. By Laser Type

        17.4.3. By Indication

        17.4.4. By Device Modality

        17.4.5. By End User

    17.5. Country Level Analysis & Forecast

        17.5.1. India Market Analysis

            17.5.1.1. Introduction

            17.5.1.2. Market Analysis and Forecast by Market Taxonomy

                17.5.1.2.1. By Laser Type

                17.5.1.2.2. By Indication

                17.5.1.2.3. By Device Modality

                17.5.1.2.4. By End User

        17.5.2. Thailand Market Analysis

            17.5.2.1. Introduction

            17.5.2.2. Market Analysis and Forecast by Market Taxonomy

                17.5.2.2.1. By Laser Type

                17.5.2.2.2. By Indication

                17.5.2.2.3. By Device Modality

                17.5.2.2.4. By End User

        17.5.3. Indonesia Market Analysis

            17.5.3.1. Introduction

            17.5.3.2. Market Analysis and Forecast by Market Taxonomy

                17.5.3.2.1. By Laser Type

                17.5.3.2.2. By Indication

                17.5.3.2.3. By Device Modality

                17.5.3.2.4. By End User

        17.5.4. Malaysia Market Analysis

            17.5.4.1. Introduction

            17.5.4.2. Market Analysis and Forecast by Market Taxonomy

                17.5.4.2.1. By Laser Type

                17.5.4.2.2. By Indication

                17.5.4.2.3. By Device Modality

                17.5.4.2.4. By End User

    17.6. Market Trends

    17.7. Key Market Participants - Intensity Mapping

    17.8. Drivers and Restraints - Impact Analysis

18. East Asia Market Analysis 2017 to 2022 and Forecast 2023 to 2033

    18.1. Introduction

    18.2. Historical Market Size (US$ Million) and Volume (Units) Analysis By Market Taxonomy, 2017 to 2022

    18.3. Current and Future Market Size (US$ Million) and Volume (Units) Analysis and Forecast By Market Taxonomy, 2023 to 2033

        18.3.1. By Country

            18.3.1.1. China

            18.3.1.2. Japan

            18.3.1.3. South Korea

        18.3.2. By Laser Type

        18.3.3. By Indication

        18.3.4. By Device Modality

        18.3.5. By End User

    18.4. Market Attractiveness Analysis

        18.4.1. By Country

        18.4.2. By Laser Type

        18.4.3. By Indication

        18.4.4. By Device Modality

        18.4.5. By End User

    18.5. Country Level Analysis & Forecast

        18.5.1. China Market Analysis

            18.5.1.1. Introduction

            18.5.1.2. Market Analysis and Forecast by Market Taxonomy

                18.5.1.2.1. By Laser Type

                18.5.1.2.2. By Indication

                18.5.1.2.3. By Device Modality

                18.5.1.2.4. By End User

        18.5.2. Japan Market Analysis

            18.5.2.1. Introduction

            18.5.2.2. Market Analysis and Forecast by Market Taxonomy

                18.5.2.2.1. By Laser Type

                18.5.2.2.2. By Indication

                18.5.2.2.3. By Device Modality

                18.5.2.2.4. By End User

        18.5.3. South Korea Market Analysis

            18.5.3.1. Introduction

            18.5.3.2. Market Analysis and Forecast by Market Taxonomy

                18.5.3.2.1. By Laser Type

                18.5.3.2.2. By Indication

                18.5.3.2.3. By Device Modality

                18.5.3.2.4. By End User

    18.6. Market Trends

    18.7. Key Market Participants - Intensity Mapping

    18.8. Drivers and Restraints - Impact Analysis

19. Oceania Market Analysis 2017 to 2022 and Forecast 2023 to 2033

    19.1. Introduction

    19.2. Historical Market Size (US$ Million) and Volume (Units) Analysis By Market Taxonomy, 2017 to 2022

    19.3. Current and Future Market Size (US$ Million) and Volume (Units) Analysis and Forecast By Market Taxonomy, 2023 to 2033

        19.3.1. By Country

            19.3.1.1. Australia

            19.3.1.2. New Zealand

        19.3.2. By Laser Type

        19.3.3. By Indication

        19.3.4. By Device Modality

        19.3.5. By End User

    19.4. Market Attractiveness Analysis

        19.4.1. By Country

        19.4.2. By Laser Type

        19.4.3. By Indication

        19.4.4. By Device Modality

        19.4.5. By End User

    19.5. Country Level Analysis & Forecast

        19.5.1. Australia Market Analysis

            19.5.1.1. Introduction

            19.5.1.2. Market Analysis and Forecast by Market Taxonomy

                19.5.1.2.1. By Laser Type

                19.5.1.2.2. By Indication

                19.5.1.2.3. By Device Modality

                19.5.1.2.4. By End User

        19.5.2. New Zealand Market Analysis

            19.5.2.1. Introduction

            19.5.2.2. Market Analysis and Forecast by Market Taxonomy

                19.5.2.2.1. By Laser Type

                19.5.2.2.2. By Indication

                19.5.2.2.3. By Device Modality

                19.5.2.2.4. By End User

    19.6. Market Trends

    19.7. Key Market Participants - Intensity Mapping

    19.8. Drivers and Restraints - Impact Analysis

20. Middle East and Africa Market Analysis 2017 to 2022 and Forecast 2023 to 2033

    20.1. Introduction

    20.2. Historical Market Size (US$ Million) and Volume (Units) Analysis By Market Taxonomy, 2017 to 2022

    20.3. Current and Future Market Size (US$ Million) and Volume (Units) Analysis and Forecast By Market Taxonomy, 2023 to 2033

        20.3.1. By Country

            20.3.1.1. GCC Countries

            20.3.1.2. Türkiye

            20.3.1.3. Northern Africa

            20.3.1.4. South Africa

            20.3.1.5. Rest of Middle East and Africa

        20.3.2. By Laser Type

        20.3.3. By Indication

        20.3.4. By Device Modality

        20.3.5. By End User

    20.4. Market Attractiveness Analysis

        20.4.1. By Country

        20.4.2. By Laser Type

        20.4.3. By Indication

        20.4.4. By Device Modality

        20.4.5. By End User

    20.5. Country Level Analysis & Forecast

        20.5.1. GCC Countries Market Analysis

            20.5.1.1. Introduction

            20.5.1.2. Market Analysis and Forecast by Market Taxonomy

                20.5.1.2.1. By Laser Type

                20.5.1.2.2. By Indication

                20.5.1.2.3. By Device Modality

                20.5.1.2.4. By End User

        20.5.2. Türkiye Market Analysis

            20.5.2.1. Introduction

            20.5.2.2. Market Analysis and Forecast by Market Taxonomy

                20.5.2.2.1. By Laser Type

                20.5.2.2.2. By Indication

                20.5.2.2.3. By Device Modality

                20.5.2.2.4. By End User

        20.5.3. Northern Africa Market Analysis

            20.5.3.1. Introduction

            20.5.3.2. Market Analysis and Forecast by Market Taxonomy

                20.5.3.2.1. By Laser Type

                20.5.3.2.2. By Indication

                20.5.3.2.3. By Device Modality

                20.5.3.2.4. By End User

        20.5.4. South Africa Market Analysis

            20.5.4.1. Introduction

            20.5.4.2. Market Analysis and Forecast by Market Taxonomy

                20.5.4.2.1. By Laser Type

                20.5.4.2.2. By Indication

                20.5.4.2.3. By Device Modality

                20.5.4.2.4. By End User

    20.6. Market Trends

    20.7. Key Market Participants - Intensity Mapping

    20.8. Drivers and Restraints - Impact Analysis

21. Market Structure Analysis

    21.1. Market Analysis by Tier of Companies

    21.2. Market Share Analysis of Top Players

    21.3. Market Presence Analysis

22. Competition Analysis

    22.1. Competition Dashboard

    22.2. Branding and Promotional Strategies, By Key Players

    22.3. Key Development Analysis

    22.4. Competition Deep Dive

        22.4.1. Alcon

            22.4.1.1. Overview

            22.4.1.2. Product Portfolio

            22.4.1.3. Key Financials

            22.4.1.4. Sales Footprint

            22.4.1.5. SWOT Analysis

            22.4.1.6. Strategy Overview

                22.4.1.6.1. Marketing Strategy

                22.4.1.6.2. Product Strategy

                22.4.1.6.3. Channel Strategy

        22.4.2. A.R.C Laser

            22.4.2.1. Overview

            22.4.2.2. Product Portfolio

            22.4.2.3. Key Financials

            22.4.2.4. Sales Footprint

            22.4.2.5. SWOT Analysis

            22.4.2.6. Strategy Overview

                22.4.2.6.1. Marketing Strategy

                22.4.2.6.2. Product Strategy

                22.4.2.6.3. Channel Strategy

        22.4.3. Ellex Medical

            22.4.3.1. Overview

            22.4.3.2. Product Portfolio

            22.4.3.3. Key Financials

            22.4.3.4. Sales Footprint

            22.4.3.5. SWOT Analysis

            22.4.3.6. Strategy Overview

                22.4.3.6.1. Marketing Strategy

                22.4.3.6.2. Product Strategy

                22.4.3.6.3. Channel Strategy

        22.4.4. Carl Zeiss

            22.4.4.1. Overview

            22.4.4.2. Product Portfolio

            22.4.4.3. Key Financials

            22.4.4.4. Sales Footprint

            22.4.4.5. SWOT Analysis

            22.4.4.6. Strategy Overview

                22.4.4.6.1. Marketing Strategy

                22.4.4.6.2. Product Strategy

                22.4.4.6.3. Channel Strategy

        22.4.5. Quantel Medical

            22.4.5.1. Overview

            22.4.5.2. Product Portfolio

            22.4.5.3. Key Financials

            22.4.5.4. Sales Footprint

            22.4.5.5. SWOT Analysis

            22.4.5.6. Strategy Overview

                22.4.5.6.1. Marketing Strategy

                22.4.5.6.2. Product Strategy

                22.4.5.6.3. Channel Strategy

        22.4.6. LightMed Corporation

            22.4.6.1. Overview

            22.4.6.2. Product Portfolio

            22.4.6.3. Key Financials

            22.4.6.4. Sales Footprint

            22.4.6.5. SWOT Analysis

            22.4.6.6. Strategy Overview

                22.4.6.6.1. Marketing Strategy

                22.4.6.6.2. Product Strategy

                22.4.6.6.3. Channel Strategy

        22.4.7. Navilas

            22.4.7.1. Overview

            22.4.7.2. Product Portfolio

            22.4.7.3. Key Financials

            22.4.7.4. Sales Footprint

            22.4.7.5. SWOT Analysis

            22.4.7.6. Strategy Overview

                22.4.7.6.1. Marketing Strategy

                22.4.7.6.2. Product Strategy

                22.4.7.6.3. Channel Strategy

        22.4.8. Norlase

            22.4.8.1. Overview

            22.4.8.2. Product Portfolio

            22.4.8.3. Key Financials

            22.4.8.4. Sales Footprint

            22.4.8.5. SWOT Analysis

            22.4.8.6. Strategy Overview

                22.4.8.6.1. Marketing Strategy

                22.4.8.6.2. Product Strategy

                22.4.8.6.3. Channel Strategy

        22.4.9. NIDEK

            22.4.9.1. Overview

            22.4.9.2. Product Portfolio

            22.4.9.3. Key Financials

            22.4.9.4. Sales Footprint

            22.4.9.5. SWOT Analysis

            22.4.9.6. Strategy Overview

                22.4.9.6.1. Marketing Strategy

                22.4.9.6.2. Product Strategy

                22.4.9.6.3. Channel Strategy

        22.4.10. Ziemer Opthalmic Systems

            22.4.10.1. Overview

            22.4.10.2. Product Portfolio

            22.4.10.3. Key Financials

            22.4.10.4. Sales Footprint

            22.4.10.5. SWOT Analysis

            22.4.10.6. Strategy Overview

                22.4.10.6.1. Marketing Strategy

                22.4.10.6.2. Product Strategy

                22.4.10.6.3. Channel Strategy

        22.4.11. IRIDEX Corporation

            22.4.11.1. Overview

            22.4.11.2. Product Portfolio

            22.4.11.3. Key Financials

            22.4.11.4. Sales Footprint

            22.4.11.5. SWOT Analysis

            22.4.11.6. Strategy Overview

                22.4.11.6.1. Marketing Strategy

                22.4.11.6.2. Product Strategy

                22.4.11.6.3. Channel Strategy

        22.4.12. Lumibird Medical

            22.4.12.1. Overview

            22.4.12.2. Product Portfolio

            22.4.12.3. Key Financials

            22.4.12.4. Sales Footprint

            22.4.12.5. SWOT Analysis

            22.4.12.6. Strategy Overview

                22.4.12.6.1. Marketing Strategy

                22.4.12.6.2. Product Strategy

                22.4.12.6.3. Channel Strategy

        22.4.13. Lumenis Be Ltd.

            22.4.13.1. Overview

            22.4.13.2. Product Portfolio

            22.4.13.3. Key Financials

            22.4.13.4. Sales Footprint

            22.4.13.5. SWOT Analysis

            22.4.13.6. Strategy Overview

                22.4.13.6.1. Marketing Strategy

                22.4.13.6.2. Product Strategy

                22.4.13.6.3. Channel Strategy

23. Assumptions and Acronyms Used

24. Research Methodology

List of Tables

Table 01: Global Market Value (US$ Million) Analysis and Forecast 2017 to 2033, by Region

Table 02A: Global Market Value (US$ Million) Analysis and Forecast 2017 to 2033, by Laser Type

Table 02B: Global Market Volume (Units) Analysis and Forecast 2017 to 2033, by Laser Type

Table 03: Global Market Value (US$ Million) Analysis and Forecast 2017 to 2033, by Indication

Table 04: Global Market Value (US$ Million) Analysis and Forecast 2017 to 2033, by Device Modality

Table 05: Global Market Value (US$ Million) Analysis and Forecast 2017 to 2033, by End User

Table 06: North America Market Value (US$ Million) Analysis 2017 to 2022 and Forecast 2023 to 2033, by Country

Table 07: North America Market Value (US$ Million) Analysis and Forecast 2017 to 2033, by Laser Type

Table 08: North America Market Volume (Units) Analysis and Forecast 2017 to 2033, by Laser Type

Table 09: North America Market Value (US$ Million) Analysis and Forecast 2017 to 2033, by Indication

Table 10: North America Market Value (US$ Million) Analysis and Forecast 2017 to 2033, by Device Modality

Table 11: North America Market Value (US$ Million) Analysis and Forecast 2017 to 2033, by End User

Table 12: Latin America Market Value (US$ Million) Analysis 2017 to 2022 and Forecast 2023 to 2033, by Country

Table 13: Latin America Market Value (US$ Million) Analysis and Forecast 2017 to 2033, by Laser Type

Table 14: Latin America Market Volume (Units) Analysis and Forecast 2017 to 2033, by Laser Type

Table 15: Latin America Market Value (US$ Million) Analysis and Forecast 2017 to 2033, by Indication

Table 16: Latin America Market Value (US$ Million) Analysis and Forecast 2017 to 2033, by Device Modality

Table 17: Latin America Market Value (US$ Million) Analysis and Forecast 2017 to 2033, by End User

Table 18: Europe Market Value (US$ Million) Analysis 2017 to 2022 and Forecast 2023 to 2033, by Country

Table 19: Europe Market Value (US$ Million) Analysis and Forecast 2017 to 2033, by Laser Type

Table 20: Europe Market Volume (Units) Analysis and Forecast 2017 to 2033, by Laser Type

Table 21: Europe Market Value (US$ Million) Analysis and Forecast 2017 to 2033, by Indication

Table 22: Europe Market Value (US$ Million) Analysis and Forecast 2017 to 2033, by Device Modality

Table 23: Europe Market Value (US$ Million) Analysis and Forecast 2017 to 2033, by End User

Table 24: South Asia Market Value (US$ Million) Analysis 2017 to 2022 and Forecast 2023 to 2033, by Country

Table 25: South Asia Market Value (US$ Million) Analysis and Forecast 2017 to 2033, by Laser Type

Table 26: South Asia Market Volume (Units) Analysis and Forecast 2017 to 2033, by Laser Type

Table 27: South Asia Market Value (US$ Million) Analysis and Forecast 2017 to 2033, by Indication

Table 28: South Asia Market Value (US$ Million) Analysis and Forecast 2017 to 2033, by Device Modality

Table 29: South Asia Market Value (US$ Million) Analysis and Forecast 2017 to 2033, by End User

Table 30: East Asia Market Value (US$ Million) Analysis 2017 to 2022 and Forecast 2023 to 2033, by Country

Table 31: East Asia Market Value (US$ Million) Analysis and Forecast 2017 to 2033, by Laser Type

Table 32: East Asia Market Volume (Units) Analysis and Forecast 2017 to 2033, by Laser Type

Table 33: East Asia Market Value (US$ Million) Analysis and Forecast 2017 to 2033, by Indication

Table 34: East Asia Market Value (US$ Million) Analysis and Forecast 2017 to 2033, by Device Modality

Table 35: East Asia Market Value (US$ Million) Analysis and Forecast 2017 to 2033, by End User

Table 36: Oceania Market Value (US$ Million) Analysis 2017 to 2022 and Forecast 2023 to 2033, by Country

Table 37: Oceania Market Value (US$ Million) Analysis and Forecast 2017 to 2033, by Laser Type

Table 38: Oceania Market Volume (Units) Analysis and Forecast 2017 to 2033, by Laser Type

Table 39: Oceania Market Value (US$ Million) Analysis and Forecast 2017 to 2033, by Indication

Table 40: Oceania Market Value (US$ Million) Analysis and Forecast 2017 to 2033, by Device Modality

Table 41: Oceania Market Value (US$ Million) Analysis and Forecast 2017 to 2033, by End User

Table 42: Middle East & Africa Market Value (US$ Million) Analysis 2017 to 2022 and Forecast 2023 to 2033, by Country

Table 43: Middle East & Africa Market Value (US$ Million) Analysis and Forecast 2017 to 2033, by Laser Type

Table 44: Middle East & Africa Market Volume (Units) Analysis and Forecast 2017 to 2033, by Laser Type

Table 45: Middle East & Africa Market Value (US$ Million) Analysis and Forecast 2017 to 2033, by Indication

Table 46: Middle East & Africa Market Value (US$ Million) Analysis and Forecast 2017 to 2033, by Device Modality

Table 47: Middle East & Africa Market Value (US$ Million) Analysis and Forecast 2017 to 2033, by End User

List of Charts

Figure 01: Global Market Volume (Units), 2017 to 2022

Figure 02: Global Market Volume (Units) & Y-o-Y Growth (%) Analysis,

Figure 03: Pricing Analysis per unit (US$), in 2022

Figure 04: Pricing Forecast per unit (US$), in 2033

Figure 05: Global Market Value (US$ Million) Analysis, 2017 to 2022

Figure 06: Global Market Forecast & Y-o-Y Growth, 2023 to 2033

Figure 07: Global Market Absolute $ Opportunity (US$ Million) Analysis, 2023 to 2033

Figure 08: Global Market Value Share (%) Analysis 2022 and 2033, by Laser Type

Figure 09: Global Market Y-o-Y Growth (%) Analysis 2023-2033, by Laser Type

Figure 10: Global Market Attractiveness Analysis 2023 to 2033, by Laser Type

Figure 11: Global Market Value Share (%) Analysis 2022 and 2033, by Indication

Figure 12: Global Market Y-o-Y Growth (%) Analysis 2023-2033, by Indication

Figure 13: Global Market Attractiveness Analysis 2023 to 2033, by Indication

Figure 14: Global Market Value Share (%) Analysis 2022 and 2033, by Device Modality

Figure 15: Global Market Y-o-Y Growth (%) Analysis 2023-2033, by Device Modality

Figure 16: Global Market Attractiveness Analysis 2023 to 2033, by Device Modality

Figure 17: Global Market Value Share (%) Analysis 2022 and 2033, by End User

Figure 18: Global Market Y-o-Y Growth (%) Analysis 2023-2033, by End User

Figure 19: Global Market Attractiveness Analysis 2023 to 2033, by End User

Figure 20: Global Market Value Share (%) Analysis 2023 and 2033, by Region

Figure 21: Global Market Y-o-Y Growth (%) Analysis 2023-2033, by Region

Figure 22: Global Market Attractiveness Analysis 2023 to 2033, by Region

Figure 23: North America Market Value (US$ Million) Analysis, 2017 to 2022

Figure 24: North America Market Value (US$ Million) Forecast, 2022 to 2033

Figure 25: North America Market Value Share, by Laser Type (2023 E)

Figure 26: North America Market Value Share, by Indication (2023 E)

Figure 27: North America Market Value Share, by Device Modality (2023 E)

Figure 28: North America Market Value Share, by End User (2023 E)

Figure 29: North America Market Value Share, by Country (2023 E)

Figure 30: North America Market Attractiveness Analysis by Laser Type, 2023 to 2033

Figure 31: North America Market Attractiveness Analysis by Indication, 2023 to 2033

Figure 32: North America Market Attractiveness Analysis by Device Modality, 2023 to 2033

Figure 33: North America Market Attractiveness Analysis by End User, 2023 to 2033

Figure 34: North America Market Attractiveness Analysis by Country, 2023 to 2033

Figure 35: USA Market Value Proportion Analysis, 2023

Figure 36: Global Vs. USA Growth Comparison

Figure 37: USA Market Share Analysis (%) by Laser Type, 2023 & 2033

Figure 38: USA Market Share Analysis (%) by Indication, 2023 & 2033

Figure 39: USA Market Share Analysis (%) by Device Modality, 2023 & 2033

Figure 40: USA Market Share Analysis (%) by End User, 2023 & 2033

Figure 41: Canada Market Value Proportion Analysis, 2023

Figure 42: Global Vs. Canada. Growth Comparison

Figure 43: Canada Market Share Analysis (%) by Laser Type, 2023 & 2033

Figure 44: Canada Market Share Analysis (%) by Indication, 2023 & 2033

Figure 45: Canada Market Share Analysis (%) by Device Modality, 2023 & 2033

Figure 46: Canada Market Share Analysis (%) by End User, 2023 & 2033

Figure 47: Latin America Market Value (US$ Million) Analysis, 2017 to 2022

Figure 48: Latin America Market Value (US$ Million) Forecast, 2022 to 2033

Figure 49: Latin America Market Value Share, by Laser Type (2023 E)

Figure 50: Latin America Market Value Share, by Indication (2023 E)

Figure 51: Latin America Market Value Share, by Device Modality (2023 E)

Figure 52: Latin America Market Value Share, by End User (2023 E)

Figure 53: Latin America Market Value Share, by Country (2023 E)

Figure 54: Latin America Market Attractiveness Analysis by Laser Type, 2023 to 2033

Figure 55: Latin America Market Attractiveness Analysis by Indication, 2023 to 2033

Figure 56: Latin America Market Attractiveness Analysis by Device Modality, 2023 to 2033

Figure 57: Latin America Market Attractiveness Analysis by End User, 2023 to 2033

Figure 58: Latin America Market Attractiveness Analysis by Country, 2023 to 2033

Figure 59: Mexico Market Value Proportion Analysis, 2023

Figure 60: Global Vs Mexico Growth Comparison

Figure 61: Mexico Market Share Analysis (%) by Laser Type, 2023 & 2033

Figure 62: Mexico Market Share Analysis (%) by Indication, 2023 & 2033

Figure 63: Mexico Market Share Analysis (%) by Device Modality, 2023 & 2033

Figure 64: Mexico Market Share Analysis (%) by End User, 2023 & 2033

Figure 65: Brazil Market Value Proportion Analysis, 2023

Figure 66: Global Vs. Brazil. Growth Comparison

Figure 67: Brazil Market Share Analysis (%) by Laser Type, 2023 & 2033

Figure 68: Brazil Market Share Analysis (%) by Indication, 2023 & 2033

Figure 69: Brazil Market Share Analysis (%) by Device Modality, 2023 & 2033

Figure 70: Brazil Market Share Analysis (%) by End User, 2023 & 2033

Figure 71: Argentina Market Value Proportion Analysis, 2022

Figure 72: Global Vs Argentina Growth Comparison

Figure 73: Argentina Market Share Analysis (%) by Laser Type, 2023 & 2033

Figure 74: Argentina Market Share Analysis (%) by Indication, 2023 & 2033

Figure 75: Argentina Market Share Analysis (%) by Device Modality, 2023 & 2033

Figure 76: Argentina Market Share Analysis (%) by End User, 2023 & 2033

Figure 77: Europe Market Value (US$ Million) Analysis, 2017 to 2022

Figure 78: Europe Market Value (US$ Million) Forecast, 2022 to 2033

Figure 79: Europe Market Value Share, by Laser Type (2023 E)

Figure 80: Europe Market Value Share, by Indication (2023 E)

Figure 81: Europe Market Value Share, by Device Modality (2023 E)

Figure 82: Europe Market Value Share, by End User (2023 E)

Figure 83: Europe Market Value Share, by Country (2023 E)

Figure 84: Europe Market Attractiveness Analysis by Laser Type, 2023 to 2033

Figure 85: Europe Market Attractiveness Analysis by Indication, 2023 to 2033

Figure 86: Europe Market Attractiveness Analysis by Device Modality, 2023 to 2033

Figure 87: Europe Market Attractiveness Analysis by End User, 2023 to 2033

Figure 88: Europe Market Attractiveness Analysis by Country, 2023 to 2033

Figure 89: UK Market Value Proportion Analysis, 2022

Figure 90: Global Vs. UK Growth Comparison

Figure 91: UK Market Share Analysis (%) by Laser Type, 2023 & 2033

Figure 92: UK Market Share Analysis (%) by Indication, 2023 & 2033

Figure 93: UK Market Share Analysis (%) by Device Modality, 2023 & 2033

Figure 94: UK Market Share Analysis (%) by End User, 2023 & 2033

Figure 95: Germany Market Value Proportion Analysis, 2022

Figure 96: Global Vs. Germany Growth Comparison

Figure 97: Germany Market Share Analysis (%) by Laser Type, 2023 & 2033

Figure 98: Germany Market Share Analysis (%) by Indication, 2023 & 2033

Figure 99: Germany Market Share Analysis (%) by Device Modality, 2023 & 2033

Figure 100: Germany Market Share Analysis (%) by End User, 2023 & 2033

Figure 101: Italy Market Value Proportion Analysis, 2022

Figure 102: Global Vs. Italy Growth Comparison

Figure 103: Italy Market Share Analysis (%) by Laser Type, 2023 & 2033

Figure 104: Italy Market Share Analysis (%) by Indication, 2023 & 2033

Figure 105: Italy Market Share Analysis (%) by Device Modality, 2023 & 2033

Figure 106: Italy Market Share Analysis (%) by End User, 2023 & 2033

Figure 107: France Market Value Proportion Analysis, 2022

Figure 108: Global Vs France Growth Comparison

Figure 109: France Market Share Analysis (%) by Laser Type, 2023 & 2033

Figure 110: France Market Share Analysis (%) by Indication, 2023 & 2033

Figure 111: France Market Share Analysis (%) by Device Modality, 2023 & 2033

Figure 112: France Market Share Analysis (%) by End User, 2023 & 2033

Figure 113: Spain Market Value Proportion Analysis, 2022

Figure 114: Global Vs Spain Growth Comparison

Figure 115: Spain Market Share Analysis (%) by Laser Type, 2023 & 2033

Figure 116: Spain Market Share Analysis (%) by Indication, 2023 & 2033

Figure 117: Spain Market Share Analysis (%) by Device Modality, 2023 & 2033

Figure 118: Spain Market Share Analysis (%) by End User, 2023 & 2033

Figure 119: Russia Market Value Proportion Analysis, 2022

Figure 120: Global Vs Russia Growth Comparison

Figure 121: Russia Market Share Analysis (%) by Laser Type, 2023 & 2033

Figure 122: Russia Market Share Analysis (%) by Indication, 2023 & 2033

Figure 123: Russia Market Share Analysis (%) by Device Modality, 2023 & 2033

Figure 124: Russia Market Share Analysis (%) by End User, 2023 & 2033

Figure 125: BENELUX Market Value Proportion Analysis, 2022

Figure 126: Global Vs BENELUX Growth Comparison

Figure 127: BENELUX Market Share Analysis (%) by Laser Type, 2023 & 2033

Figure 128: BENELUX Market Share Analysis (%) by Indication, 2023 & 2033

Figure 129: BENELUX Market Share Analysis (%) by Device Modality, 2023 & 2033

Figure 130: BENELUX Market Share Analysis (%) by End User, 2023 & 2033

Figure 131: East Asia Market Value (US$ Million) Analysis, 2017 to 2022

Figure 132: East Asia Market Value (US$ Million) Forecast, 2022 to 2033

Figure 133: East Asia Market Value Share, by Laser Type (2023 E)

Figure 134: East Asia Market Value Share, by Indication (2023 E)

Figure 135: East Asia Market Value Share, by Device Modality (2023 E)

Figure 136: East Asia Market Value Share, by End User (2023 E)

Figure 137: East Asia Market Value Share, by Country (2023 E)

Figure 138: East Asia Market Attractiveness Analysis by Laser Type, 2023 to 2033

Figure 139: East Asia Market Attractiveness Analysis by Indication, 2023 to 2033

Figure 140: East Asia Market Attractiveness Analysis by Device Modality, 2023 to 2033

Figure 141: East Asia Market Attractiveness Analysis by End User, 2023 to 2033

Figure 142: East Asia Market Attractiveness Analysis by Country, 2023 to 2033

Figure 143: China Market Value Proportion Analysis, 2022

Figure 144: Global Vs. China Growth Comparison

Figure 145: China Market Share Analysis (%) by Laser Type, 2023 & 2033

Figure 146: China Market Share Analysis (%) by Indication, 2023 & 2033

Figure 147: China Market Share Analysis (%) by Device Modality, 2023 & 2033

Figure 148: China Market Share Analysis (%) by End User, 2023 & 2033

Figure 149: Japan Market Value Proportion Analysis, 2022

Figure 150: Global Vs. Japan Growth Comparison

Figure 151: Japan Market Share Analysis (%) by Laser Type, 2023 & 2033

Figure 152: Japan Market Share Analysis (%) by Indication, 2023 & 2033

Figure 153: Japan Market Share Analysis (%) by Device Modality, 2023 & 2033

Figure 154: Japan Market Share Analysis (%) by End User, 2023 & 2033

Figure 155: South Korea Market Value Proportion Analysis, 2022

Figure 156: Global Vs South Korea Growth Comparison

Figure 157: South Korea Market Share Analysis (%) by Laser Type, 2023 & 2033

Figure 158: South Korea Market Share Analysis (%) by Indication, 2023 & 2033

Figure 159: South Korea Market Share Analysis (%) by Device Modality, 2023 & 2033

Figure 160: South Korea Market Share Analysis (%) by End User, 2023 & 2033

Figure 161: South Asia Market Value (US$ Million) Analysis, 2017 to 2022

Figure 162: South Asia Market Value (US$ Million) Forecast, 2022 to 2033

Figure 163: South Asia Market Value Share, by Laser Type (2023 E)

Figure 164: South Asia Market Value Share, by Indication (2023 E)

Figure 165: South Asia Market Value Share, by Device Modality (2023 E)

Figure 166: South Asia Market Value Share, by End User (2023 E)

Figure 167: South Asia Market Value Share, by Country (2023 E)

Figure 168: South Asia Market Attractiveness Analysis by Laser Type, 2023 to 2033

Figure 169: South Asia Market Attractiveness Analysis by Indication, 2023 to 2033

Figure 170: South Asia Market Attractiveness Analysis by Device Modality, 2023 to 2033

Figure 171: South Asia Market Attractiveness Analysis by End User, 2023 to 2033

Figure 172: South Asia Market Attractiveness Analysis by Country, 2023 to 2033

Figure 173: India Market Value Proportion Analysis, 2022

Figure 174: Global Vs. India Growth Comparison

Figure 175: India Market Share Analysis (%) by Laser Type, 2023 & 2033

Figure 176: India Market Share Analysis (%) by Indication, 2023 & 2033

Figure 177: India Market Share Analysis (%) by Device Modality, 2023 & 2033

Figure 178: India Market Share Analysis (%) by End User, 2023 & 2033

Figure 179: Indonesia Market Value Proportion Analysis, 2022

Figure 180: Global Vs. Indonesia Growth Comparison

Figure 181: Indonesia Market Share Analysis (%) by Laser Type, 2023 & 2033

Figure 182: Indonesia Market Share Analysis (%) by Indication, 2023 & 2033

Figure 183: Indonesia Market Share Analysis (%) by Device Modality, 2023 & 2033

Figure 184: Indonesia Market Share Analysis (%) by End User, 2023 & 2033

Figure 185: Malaysia Market Value Proportion Analysis, 2022

Figure 186: Global Vs. Malaysia Growth Comparison

Figure 187: Malaysia Market Share Analysis (%) by Laser Type, 2023 & 2033

Figure 188: Malaysia Market Share Analysis (%) by Indication, 2023 & 2033

Figure 189: Malaysia Market Share Analysis (%) by Device Modality, 2023 & 2033

Figure 190: Malaysia Market Share Analysis (%) by End User, 2023 & 2033

Figure 191: Thailand Market Value Proportion Analysis, 2022

Figure 192: Global Vs. Thailand Growth Comparison

Figure 193: Thailand Market Share Analysis (%) by Laser Type, 2023 & 2033

Figure 194: Thailand Market Share Analysis (%) by Indication, 2023 & 2033

Figure 195: Thailand Market Share Analysis (%) by Device Modality, 2023 & 2033

Figure 196: Thailand Market Share Analysis (%) by End User, 2023 & 2033

Figure 197: Oceania Market Value (US$ Million) Analysis, 2017 to 2022

Figure 198: Oceania Market Value (US$ Million) Forecast, 2022 to 2033

Figure 199: Oceania Market Value Share, by Laser Type (2023 E)

Figure 200: Oceania Market Value Share, by Indication (2023 E)

Figure 201: Oceania Market Value Share, by Device Modality (2023 E)

Figure 202: Oceania Market Value Share, by End User (2023 E)

Figure 203: Oceania Market Value Share, by Country (2023 E)

Figure 204: Oceania Market Attractiveness Analysis by Laser Type, 2023 to 2033

Figure 205: Oceania Market Attractiveness Analysis by Indication, 2023 to 2033

Figure 206: Oceania Market Attractiveness Analysis by Device Modality, 2023 to 2033

Figure 207: Oceania Market Attractiveness Analysis by End User, 2023 to 2033

Figure 208: Oceania Market Attractiveness Analysis by Country, 2023 to 2033

Figure 209: Australia Market Value Proportion Analysis, 2022

Figure 210: Global Vs. Australia Growth Comparison

Figure 211: Australia Market Share Analysis (%) by Laser Type, 2023 & 2033

Figure 212: Australia Market Share Analysis (%) by Indication, 2023 & 2033

Figure 213: Australia Market Share Analysis (%) by Device Modality, 2023 & 2033

Figure 214: Australia Market Share Analysis (%) by End User, 2023 & 2033

Figure 215: New Zealand Market Value Proportion Analysis, 2022

Figure 216: Global Vs New Zealand Growth Comparison

Figure 217: New Zealand Market Share Analysis (%) by Laser Type, 2023 & 2033

Figure 218: New Zealand Market Share Analysis (%) by Indication, 2023 & 2033

Figure 219: New Zealand Market Share Analysis (%) by Device Modality, 2023 & 2033

Figure 220: New Zealand Market Share Analysis (%) by End User, 2023 & 2033

Figure 221: Middle East & Africa Market Value (US$ Million) Analysis, 2017 to 2022

Figure 222: Middle East & Africa Market Value (US$ Million) Forecast, 2022 to 2033

Figure 223: Middle East & Africa Market Value Share, by Laser Type (2023 E)

Figure 224: Middle East & Africa Market Value Share, by Indication (2023 E)

Figure 225: Middle East & Africa Market Value Share, by Device Modality (2023 E)

Figure 226: Middle East & Africa Market Value Share, by End User (2023 E)

Figure 227: Middle East & Africa Market Value Share, by Country (2023 E)

Figure 228: Middle East & Africa Market Attractiveness Analysis by Laser Type, 2023 to 2033

Figure 229: Middle East & Africa Market Attractiveness Analysis by Indication, 2023 to 2033

Figure 230: Middle East & Africa Market Attractiveness Analysis by Device Modality, 2023 to 2033

Figure 231: Middle East & Africa Market Attractiveness Analysis by End User, 2023 to 2033

Figure 232: Middle East & Africa Market Attractiveness Analysis by Country, 2023 to 2033

Figure 233: GCC Countries Market Value Proportion Analysis, 2022

Figure 234: Global Vs GCC Countries Growth Comparison

Figure 235: GCC Countries Market Share Analysis (%) by Laser Type, 2023 & 2033

Figure 236: GCC Countries Market Share Analysis (%) by Indication, 2023 & 2033

Figure 237: GCC Countries Market Share Analysis (%) by Device Modality, 2023 & 2033

Figure 238: GCC Countries Market Share Analysis (%) by End User, 2023 & 2033

Figure 239: Türkiye Market Value Proportion Analysis, 2022

Figure 240: Global Vs. Türkiye Growth Comparison

Figure 241: Türkiye Market Share Analysis (%) by Laser Type, 2023 & 2033

Figure 242: Türkiye Market Share Analysis (%) by Indication, 2023 & 2033

Figure 243: Türkiye Market Share Analysis (%) by Device Modality, 2023 & 2033

Figure 244: Türkiye Market Share Analysis (%) by End User, 2023 & 2033

Figure 245: South Africa Market Value Proportion Analysis, 2022

Figure 246: Global Vs. South Africa Growth Comparison

Figure 247: South Africa Market Share Analysis (%) by Laser Type, 2023 & 2033

Figure 248: South Africa Market Share Analysis (%) by Indication, 2023 & 2033

Figure 249: South Africa Market Share Analysis (%) by Device Modality, 2023 & 2033

Figure 250: South Africa Market Share Analysis (%) by End User, 2023 & 2033

Figure 251: Northern Africa Market Value Proportion Analysis, 2022

Figure 252: Global Vs Northern Africa Growth Comparison

Figure 253: Northern Africa Market Share Analysis (%) by Laser Type, 2023 & 2033

Figure 254: Northern Africa Market Share Analysis (%) by Indication, 2023 & 2033

Figure 255: Northern Africa Market Share Analysis (%) by Device Modality, 2023 & 2033

Figure 256: Northern Africa Market Share Analysis (%) by End User, 2023 & 2033

Explore Healthcare Insights

View Reports

Retinal Laser Photocoagulation Market