The laser welding equipment market is expanding steadily, driven by increased demand for precision joining technologies across automotive, electronics, and aerospace industries. Fiber laser systems are gaining significant traction due to their high efficiency, superior beam quality, and reduced maintenance requirements compared to traditional methods.
The market benefits from rapid industrial automation, where integration of robotics and advanced control systems enhances productivity and accuracy. Adoption is also supported by the shift toward lightweight materials and complex geometries that require non-contact welding solutions.
Current trends indicate rising investments in high-speed production lines, enabling manufacturers to achieve tighter tolerances and improved surface finishes. The future outlook remains optimistic as fiber laser technology continues to replace conventional welding equipment, supported by declining equipment costs and the growing emphasis on energy-efficient manufacturing processes across multiple sectors.

| Metric | Value |
|---|---|
| Laser Welding Equipment Market Estimated Value in (2025 E) | USD 3064.3 million |
| Laser Welding Equipment Market Forecast Value in (2035 F) | USD 5334.4 million |
| Forecast CAGR (2025 to 2035) | 5.7% |

The market is segmented by Technology, Operation, Function, and End Use and region. By Technology, the market is divided into Fiber Laser, Solid State, Gas Laser, and Diode Laser. In terms of Operation, the market is classified into Automatic, Semi-Automatic, and Manual. Based on Function, the market is segmented into Spot And Seam Welding, Deposition Welding, Profile Welding, Scanner Welding, Hybrid Welding, and Other Functions. By End Use, the market is divided into Automotive, Electronics, Healthcare, Construction, Oil And Gas, Industrial Fabrication And Engineering, Jewelry Industry, and Others. Regionally, the market is classified into North America, Latin America, Western Europe, Eastern Europe, Balkan & Baltic Countries, Russia & Belarus, Central Asia, East Asia, South Asia & Pacific, and the Middle East & Africa.
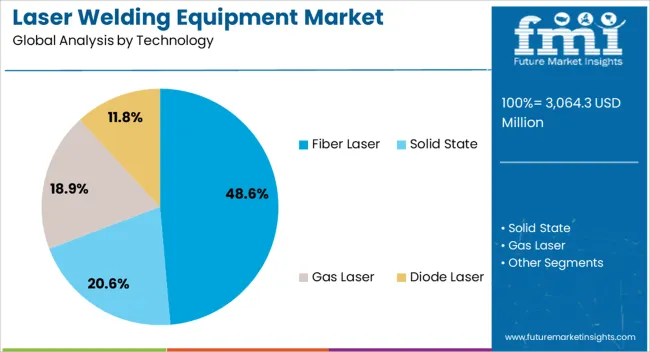
The fiber laser segment dominates the technology category with approximately 48.6% share, supported by its high energy efficiency, low maintenance needs, and superior welding precision. Fiber lasers are increasingly preferred for joining thin metals and reflective materials, offering better penetration control and minimal distortion.
Their compact design and high power output enable seamless integration into automated production lines. Industries such as automotive and electronics rely on fiber lasers for battery welding, sensor assembly, and micro-joining tasks requiring consistent quality.
The segment’s growth is reinforced by technological advances in laser diodes and beam delivery systems that enhance speed and accuracy. As the manufacturing sector continues its shift toward automation and sustainability, the fiber laser segment is projected to retain its leadership position.
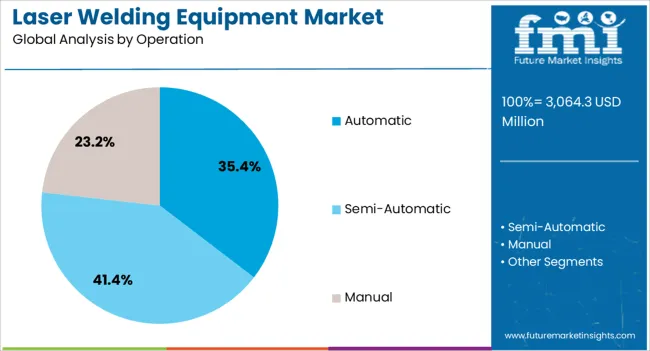
The automatic segment holds approximately 35.4% share of the operation category, reflecting the growing adoption of automated welding systems in large-scale manufacturing. Automation enhances productivity by reducing human error, ensuring repeatable weld quality, and improving process control.
The segment benefits from increasing investments in robotics, machine vision, and CNC-controlled systems, which enable high precision and faster cycle times. Cost savings achieved through reduced labor dependency further strengthen adoption in high-volume production environments.
The integration of smart sensors and AI-driven monitoring tools has elevated process reliability and reduced downtime. With manufacturers prioritizing efficiency and quality in mass production, the automatic segment is expected to maintain its robust growth trajectory throughout the forecast period.
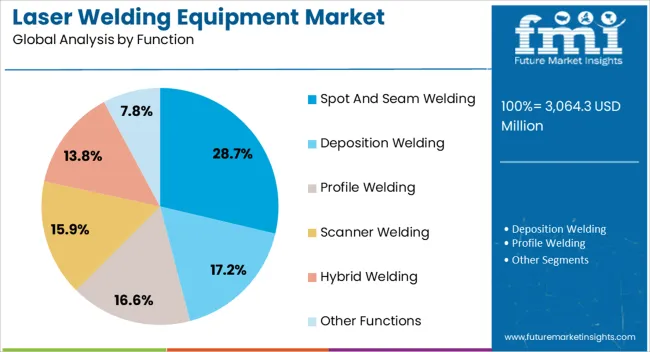
The spot and seam welding segment leads the function category with approximately 28.7% share, driven by its extensive application in automotive body construction, electronics, and metal fabrication. These techniques offer strong, durable joints ideal for both thin and thick material sections.
Spot welding provides high-speed performance suitable for repetitive operations, while seam welding ensures continuous, leak-proof joints for components such as fuel tanks and enclosures. The segment’s strength lies in its adaptability across ferrous and non-ferrous materials, making it widely used in precision manufacturing.
Advancements in laser control systems and real-time process monitoring have improved accuracy and heat distribution, reinforcing reliability. With the ongoing demand for structural integrity and aesthetic finishes, spot and seam welding are expected to sustain their prominence in industrial applications.
Market to Expand Nearly 1.7X through 2035
The demand for laser welding equipment is predicted to expand around 1.7X through 2035, amid a 3.3% increase in expected CAGR compared to the historical one. This is due to the increasing demand for high-precision, automated, and non-contact welding solutions across industries.
The demand for high-precision and accurate welding solutions, especially in industries like electronics, automotive, and medical, is raising the adoption of advanced technology laser welding machines.
The emerging trend towards automation in manufacturing processes further boosts the appeal of laser welding equipment, as it seamlessly integrates with automated systems, resulting in improved efficiency and productivity. By 2035, the total market revenue is set to reach USD 5,070.6 million.
East Asia Leads the Laser Welding Equipment Industry, with a Projected Share of 31.8% by the Year 2035
As per the analysis, East Asia is expected to retain its dominance in the laser welding equipment market over the forecast period. The East Asia region is poised to emerge as a frontrunner in driving the demand for laser welding equipment. East Asia's prominence in the market can be attributed to several factors contributing to its robust growth:
Key Market Dynamics
Key Factors Restraining the Market Growth
Global sales of laser welding equipment recorded a CAGR of 2.5% between 2020 and 2025. Total market revenue reached about USD 2,761.4 million in 2025. In the forecast period, the worldwide laser welding equipment industry is set to thrive at a CAGR of 5.7%.
The market witnessed moderate growth between 2020 and 2025 due to rising awareness of the benefits of using laser welding equipment to optimize processes and reduce manual errors.
During the Covid-19 pandemic, the significance of laser welding machines became pronounced as they played a pivotal role in the rapid production of essential medical equipment. From manufacturing ventilators to diagnostic devices, the precision and efficiency offered by laser welding technology proved crucial in meeting the heightened demand for critical medical apparatus.
The non-contact nature of laser welding also ensured the production of high-quality components, contributing to manufacturers' swift response to the evolving needs of the healthcare industry.
| Historical CAGR (2020 to 2025) | 2.5% |
|---|---|
| Forecast CAGR (2025 to 2035) | 5.7% |
The anticipated consistent growth of the market to reach a valuation of USD 5,070.6 million by 2035 is attributed to a combination of factors.
The below table shows the estimated growth rates of the top countries. South Korea, India, and Japan are set to record higher CAGRs of 7.1%, 6.4%, and 6.6%, respectively, through 2035.
| Countries | Laser Welding Equipment CAGR (2025 to 2035) |
|---|---|
| South Korea | 7.1% |
| India | 6.4% |
| Japan | 6.6% |
| China | 6.1% |
| United Kingdom | 4.4% |
| United States | 4.1% |

The United States laser welding equipment market size is projected to reach USD 5334.4 million by 2035. Over the assessment period, equipment demand in the United States is set to rise at 4.1% CAGR.
The market is experiencing dynamic growth and innovation, propelled by a confluence of factors driving advancements in industrial welding technologies.
The demand for laser welding equipment solutions is exhibiting an upswing in the United Kingdom. Leading factors that are impelling these equipment sales are:
Market revenue generated by the sales of laser welding equipment in the United Kingdom is expected to rise at a 4.4% CAGR through this period.
The laser welding equipment market in China is experiencing a consistent surge, propelled by the nation's rapid industrialization and notable technological advancements. As a key player in the global manufacturing landscape, China's embrace of laser welding technology reflects a strategic shift towards precision and efficiency in industrial processes. The demand for high-precision welding solutions in sectors such as automotive, electronics, and aerospace is a driving force behind this surge.
Sales of laser welding equipment in China are projected to soar at a CAGR of around 6.1% during the assessment period. Total valuation in the country is anticipated to reach USD 514.9 million by 2035.
India's manufacturing landscape is witnessing a remarkable surge in the adoption of laser welding equipment, marking a significant shift towards advanced and precise welding technologies. The dynamic growth is fueled by the country's expanding industrial sector, where laser welding is playing a pivotal role in enhancing efficiency and product quality.
The laser welding equipment market value in India is anticipated to total USD 163.2 million by 2035. Over the forecast period, laser welding equipment demand in the country is set to increase at a robust CAGR of 6.4%.
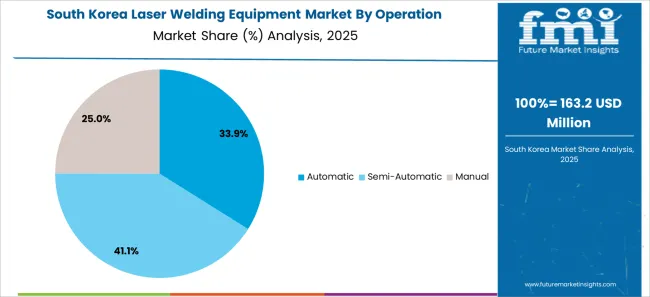
The South Korea market is anticipated to amount to USD 108.6 million by 2035. The market is predicted to register a CAGR of 7.1% through 2035. Top factors driving the industry are:
| Top Segment (Technology) | Fiber Laser |
|---|---|
| Forecast CAGR (2025 to 2035) | 5.4% |
The laser welding equipment industry witnesses a notable dominance in the fiber laser technology segment, underscoring its pivotal role and widespread influence. Fiber laser technology has emerged as a frontrunner in the market, owing to its superior performance and versatility. This segment's dominance is evident in its ability to provide high-quality, precise, and efficient welding solutions across various industries.
Integration of fiber lasers with automated systems, compact design, and cost-effectiveness solidify their dominance in the laser welding equipment landscape. As industries increasingly prioritize advanced and efficient welding processes, the fiber laser technology segment remains at the forefront, shaping the trajectory of the overall market.
Over the forecast period, demand for fiber lasers is forecast to rise at a CAGR of 5.4% CAGR. By 2035, the target segment is estimated to reach USD 2,091.2 million.
| Top Segment (End Use) | Automotive |
|---|---|
| Forecast CAGR (2025 to 2035) | 4.4% |
The demand for laser welding equipment in the automotive sector is poised to remain steady, exemplifying its crucial role in advancing manufacturing processes within the industry. Laser welding technology has become integral to automotive manufacturing due to its ability to deliver high-precision and efficient welding solutions.
As per the recent market report, the automotive segment is projected to thrive at 4.4% CAGR during the forecast period. It is set to attain a valuation of USD 1,398.7 million by 2035.
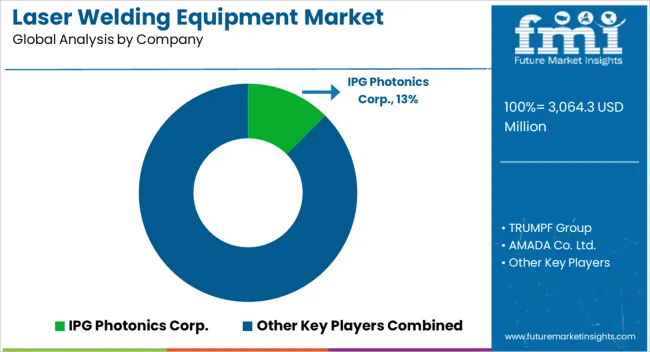
The global laser welding equipment market is fragmented, with leading players accounting for about 25% to 30% of the share. IPG Photonics Corp., TRUMPF Group., AMADA Co. Ltd., Coherent Corp., Emerson Electric Co., Huagong Tech Co. Ltd., and United Winners Laser Co. are the leading manufacturers and suppliers listed in the report.
Key laser welding equipment companies are investing in research and development to produce new products and increase their production capacity to meet end-user demand. They are also showing an inclination toward adopting strategies, including acquisitions, partnerships, mergers, and facility expansions, to strengthen their footprint.
Recent Developments
The global laser welding equipment market is estimated to be valued at USD 3,064.3 million in 2025.
The market size for the laser welding equipment market is projected to reach USD 5,334.4 million by 2035.
The laser welding equipment market is expected to grow at a 5.7% CAGR between 2025 and 2035.
The key product types in laser welding equipment market are fiber laser, solid state, gas laser and diode laser.
In terms of operation, automatic segment to command 35.4% share in the laser welding equipment market in 2025.


Our Research Products

The "Full Research Suite" delivers actionable market intel, deep dives on markets or technologies, so clients act faster, cut risk, and unlock growth.

The Leaderboard benchmarks and ranks top vendors, classifying them as Established Leaders, Leading Challengers, or Disruptors & Challengers.

Locates where complements amplify value and substitutes erode it, forecasting net impact by horizon

We deliver granular, decision-grade intel: market sizing, 5-year forecasts, pricing, adoption, usage, revenue, and operational KPIs—plus competitor tracking, regulation, and value chains—across 60 countries broadly.

Spot the shifts before they hit your P&L. We track inflection points, adoption curves, pricing moves, and ecosystem plays to show where demand is heading, why it is changing, and what to do next across high-growth markets and disruptive tech

Real-time reads of user behavior. We track shifting priorities, perceptions of today’s and next-gen services, and provider experience, then pace how fast tech moves from trial to adoption, blending buyer, consumer, and channel inputs with social signals (#WhySwitch, #UX).

Partner with our analyst team to build a custom report designed around your business priorities. From analysing market trends to assessing competitors or crafting bespoke datasets, we tailor insights to your needs.
Supplier Intelligence
Discovery & Profiling
Capacity & Footprint
Performance & Risk
Compliance & Governance
Commercial Readiness
Who Supplies Whom
Scorecards & Shortlists
Playbooks & Docs
Category Intelligence
Definition & Scope
Demand & Use Cases
Cost Drivers
Market Structure
Supply Chain Map
Trade & Policy
Operating Norms
Deliverables
Buyer Intelligence
Account Basics
Spend & Scope
Procurement Model
Vendor Requirements
Terms & Policies
Entry Strategy
Pain Points & Triggers
Outputs
Pricing Analysis
Benchmarks
Trends
Should-Cost
Indexation
Landed Cost
Commercial Terms
Deliverables
Brand Analysis
Positioning & Value Prop
Share & Presence
Customer Evidence
Go-to-Market
Digital & Reputation
Compliance & Trust
KPIs & Gaps
Outputs
Full Research Suite comprises of:
Market outlook & trends analysis
Interviews & case studies
Strategic recommendations
Vendor profiles & capabilities analysis
5-year forecasts
8 regions and 60+ country-level data splits
Market segment data splits
12 months of continuous data updates
DELIVERED AS:
PDF EXCEL ONLINE
Laser Welding Market Size and Share Forecast Outlook 2025 to 2035
Laser Welding Machine Market Size and Share Forecast Outlook 2025 to 2035
Welding Equipment And Consumables Market Size and Share Forecast Outlook 2025 to 2035
Laser Marking Equipment Market Size and Share Forecast Outlook 2025 to 2035
Laser Drilling Equipment Market Size and Share Forecast Outlook 2025 to 2035
Stud Welding Equipment Market Size and Share Forecast Outlook 2025 to 2035
Welding Fume Extraction Equipment Market Size and Share Forecast Outlook 2025 to 2035
Oxy-Fuel Welding Equipment Market Growth – Trends & Forecast 2025 to 2035
Underwater Welding Equipment Market Growth – Trends & Forecast 2024-2034
Selective Laser Sintering Equipment Market Growth - Trends & Forecast 2025 to 2035
4-Inch SiC Laser Annealing Equipment Market Size and Share Forecast Outlook 2025 to 2035
Demand for 4-Inch SiC Laser Annealing Equipment in UK Size and Share Forecast Outlook 2025 to 2035
Demand for 4-Inch SiC Laser Annealing Equipment in the USA Size and Share Forecast Outlook 2025 to 2035
Laser Frequency Splitting and Mode Competition Teaching Instrument Market Size and Share Forecast Outlook 2025 to 2035
Laser Component Analyzer Market Size and Share Forecast Outlook 2025 to 2035
Welding Electrodes and Rods Market Size and Share Forecast Outlook 2025 to 2035
Laser-Assisted Smart Lathes Market Size and Share Forecast Outlook 2025 to 2035
Welding Filler Metal Market Size and Share Forecast Outlook 2025 to 2035
Laser Transverse Mode Teaching Instrument Market Forecast and Outlook 2025 to 2035
Laser Ablation Systems Market Size and Share Forecast Outlook 2025 to 2035

Thank you!
You will receive an email from our Business Development Manager. Please be sure to check your SPAM/JUNK folder too.
Chat With
MaRIA