The global fiber laser market is valued at USD 4.3 billion in 2024 and is slated to reach USD 12.8 billion by 2034, recording an absolute increase of USD 8.5 billion over the forecast period. This translates into a total growth of 197.7%, with the market forecast to expand at a compound annual growth rate (CAGR) of 11.5% between 2024 and 2034. The overall market size is expected to grow by nearly 3.0X during the same period, supported by increasing automation in manufacturing processes, growing demand for precision cutting applications, and rising adoption of fiber laser solutions across diverse industrial applications.
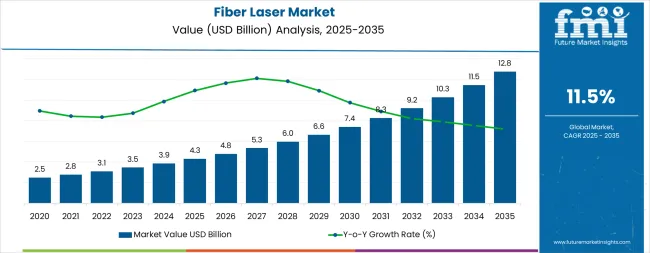
Between 2024 and 2029, the fiber laser market is projected to expand from USD 4.3 billion to USD 7.4 billion, resulting in a value increase of USD 3.1 billion, which represents 36.5% of the total forecast growth for the decade. This phase of development will be shaped by increasing industrial automation initiatives, rising demand for precision manufacturing, and growing adoption of fiber laser technologies in automotive and aerospace applications. Equipment manufacturers are expanding their production capabilities to address the growing demand for high-power laser solutions and enhanced cutting precision.
| Metric | Value |
|---|---|
| Estimated Value in (2024E) | USD 4.3 billion |
| Forecast Value in (2034F) | USD 12.8 billion |
| Forecast CAGR (2024 to 2034) | 11.5% |
From 2029 to 2034, the market is forecast to grow from USD 7.4 billion to USD 12.8 billion, adding another USD 5.4 billion, which constitutes 63.5% of the overall ten-year expansion. This period is expected to be characterized by the expansion of medical and healthcare applications, the integration of advanced fiber laser technologies, and the development of specialized cutting solutions for major industrial and manufacturing projects. The growing adoption of precision manufacturing programs and smart laser systems will drive demand for fiber lasers with enhanced operational capabilities and reduced operational complexity.
Between 2019 and 2024, the fiber laser market experienced steady growth, driven by increasing manufacturing automation and growing recognition of fiber laser technology as essential equipment for precision cutting and material processing. The market developed as industrial operators recognized the potential for advanced laser systems to enhance operational efficiency while reducing processing costs and improving product quality. Technological advancement in high-power fiber lasers and automated control systems began emphasizing the critical importance of maintaining cutting precision and operational reliability in manufacturing applications.
Market expansion is being supported by the increasing industrial automation activities and the corresponding need for precise cutting equipment that can maintain operational reliability and processing accuracy while supporting diverse manufacturing applications across various industrial environments. Modern manufacturing operators are increasingly focused on implementing laser solutions that can reduce processing time, minimize operational costs, and provide consistent performance in cutting and welding operations. Fiber lasers' proven ability to deliver enhanced cutting precision, reliable processing capabilities, and versatile manufacturing applications make them essential equipment for contemporary industrial operations and material processing solutions.
The growing emphasis on manufacturing automation and operational efficiency is driving demand for fiber lasers that can support high-speed cutting operations, reduce material waste, and enable efficient material processing across varying industrial configurations. Manufacturing operators' preference for equipment that combines precision with processing efficiency and cost-effectiveness is creating opportunities for innovative laser implementations. The rising influence of Industry 4.0 technologies and smart manufacturing systems is also contributing to increased adoption of fiber lasers that can provide advanced operational control without compromising performance or processing quality.
The fiber laser market is poised for robust growth and transformation. As manufacturing operators across both developed and emerging markets seek cutting equipment that is precise, efficient, automated, and cost-effective, fiber laser systems are gaining prominence not just as cutting tools but as strategic infrastructure for operational efficiency, product quality enhancement, manufacturing optimization, and competitive positioning.
Rising manufacturing automation and industrial development in North America, East Asia, and South Asia Pacific amplify demand, while manufacturers are picking up on innovations in high-power laser technologies and automated control systems. Pathways like high-power laser adoption, automation integration, and medical applications promise strong margin uplift, especially in developed markets. Geographic expansion and application diversification will capture volume, particularly where manufacturing activities are growing or industrial infrastructure requires modernization. Technology pressures around precision cutting, processing efficiency, operational automation, and cost optimization give structural support.
The market is segmented by output power, laser type, application, and region. By output power, the market is divided into low power (up to 100 W), medium power (100 W to 2000 W), and high power (more than 2000 W). By laser type, it covers CW, pulsed, and QCW. By application, it is segmented into cutting, welding & high power applications, marking, fine & microprocessing, medical, and communications & advanced applications. Regionally, the market is divided into North America, Latin America, Western Europe, Eastern Europe, East Asia, South Asia Pacific, and Middle East & Africa.
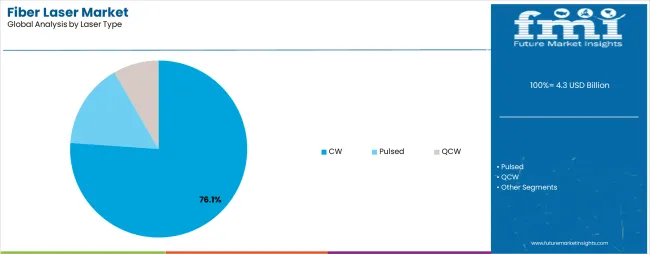
The CW laser type segment is projected to account for 76.1% of the fiber laser market in 2024, reaffirming its position as the leading technology category. Industrial operators and manufacturing companies increasingly utilize CW fiber lasers for their superior power efficiency, excellent beam quality, and reliable performance across cutting, welding, and material processing applications. CW laser technology's established operational procedures and consistent processing characteristics directly address the manufacturing requirements for reliable laser systems and operational efficiency in diverse industrial environments.
This laser type segment forms the foundation of current industrial laser operations, as it represents the technology with the greatest operational stability and proven processing compatibility across multiple applications and manufacturing scenarios. Operator investments in enhanced CW laser systems and processing optimization continue to strengthen adoption among manufacturing companies and industrial processors. With operators prioritizing processing reliability and equipment performance, CW fiber lasers align with both operational efficiency objectives and cost management requirements, making them the central component of comprehensive industrial laser strategies.
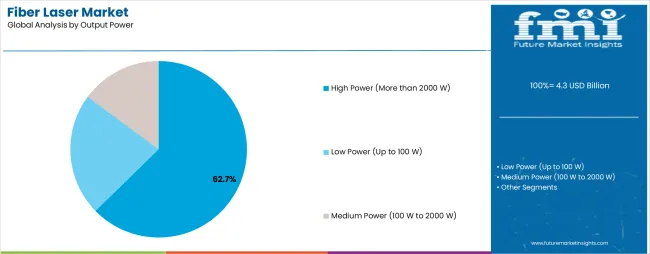
High power fiber lasers (more than 2000 W) are projected to represent 62.7% of fiber laser demand in 2024, underscoring their critical role as the primary power category for industrial cutting and heavy-duty manufacturing operations. Industrial operators prefer high power fiber lasers for their superior cutting capabilities, enhanced processing speeds, and ability to handle thick materials while supporting large-scale manufacturing and operational requirements. Positioned as essential equipment for modern industrial operations, high power lasers offer both performance advantages and operational benefits.
The segment is supported by continuous innovation in power scaling technology and the growing availability of specialized high-power configurations that enable efficient material processing with enhanced cutting capabilities. Manufacturing operators are investing in high-power laser solutions to support large-scale operations and heavy-duty material processing delivery. As industrial manufacturing becomes more prevalent and processing efficiency requirements increase, high power applications will continue to dominate the output power market while supporting advanced laser utilization and manufacturing operational strategies.
The fiber laser market is advancing steadily due to increasing manufacturing automation and growing adoption of precision cutting infrastructure that provides enhanced operational efficiency and processing accuracy across diverse industrial applications. However, the market faces challenges, including high equipment investment costs, specialized technical requirements, and varying application requirements across different manufacturing environments. Innovation in high-power laser technologies and automated control systems continues to influence equipment development and market expansion patterns.
The growing expansion of automated manufacturing and industrial development is enabling equipment manufacturers to develop fiber laser systems that provide superior cutting precision, enhanced processing capabilities, and reliable performance in high-volume manufacturing environments. Advanced fiber laser systems provide improved operational efficiency while allowing more effective material processing and consistent quality delivery across various applications and manufacturing requirements. Manufacturers are increasingly recognizing the competitive advantages of modern laser capabilities for operational efficiency and manufacturing optimization positioning.
Modern fiber laser manufacturers are incorporating high-power technologies and medical application capabilities to enhance cutting precision, reduce operational costs, and ensure consistent performance delivery to industrial and healthcare operators. These technologies improve processing reliability while enabling new applications, including surgical procedures and precision medical device manufacturing. Advanced technology integration also allows manufacturers to support premium equipment positioning and operational optimization beyond traditional laser cutting equipment supply.
| Country | CAGR (2024-2034) |
|---|---|
| India | 15.2% |
| Japan | 12.3% |
| South Korea | 12.2% |
| China | 11.7% |
| United States | 11.5% |
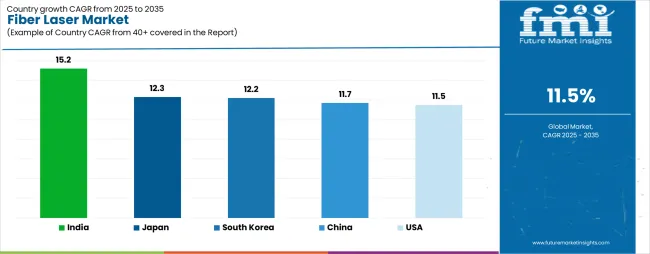
The fiber laser market is experiencing strong growth globally, with India leading at a 15.2% CAGR through 2034, driven by extensive manufacturing expansion programs, rapid industrialization projects, and significant adoption of automated laser solutions. Japan follows at 12.3%, supported by advanced manufacturing capabilities, precision engineering excellence, and growing adoption of high-tech laser technologies. South Korea shows growth at 12.2%, emphasizing semiconductor manufacturing and electronics industry development. China records 11.7%, focusing on manufacturing scale-up and industrial modernization. United States demonstrates 11.5% growth, supported by advanced manufacturing capabilities and automotive industry expansion.
The report covers an in-depth analysis of 40+ countries; five top-performing countries are highlighted below.
Revenue from fiber lasers in India is projected to exhibit exceptional growth with a CAGR of 15.2% through 2034, driven by extensive manufacturing expansion programs and rapidly growing adoption of automated laser solutions supported by industrialization initiatives and government manufacturing policies. The country's comprehensive industrial development strategy and increasing investment in advanced manufacturing technologies are creating substantial demand for fiber laser solutions. Major manufacturing companies and industrial operators are establishing comprehensive laser systems to serve both domestic production needs and export manufacturing requirements.
Revenue from fiber lasers in Japan is expanding at a CAGR of 12.3%, supported by the country's advanced manufacturing capabilities, comprehensive precision engineering programs, and increasing adoption of high-tech laser systems. The country's established industrial infrastructure and growing emphasis on technological innovation are driving sophisticated laser capabilities. Manufacturing companies and technology operators are establishing extensive laser operations to address the growing demand for precision processing and advanced manufacturing.
Revenue from fiber lasers in South Korea is growing at a CAGR of 12.2%, driven by expanding semiconductor manufacturing operations, increasing electronics industry development, and growing investment in precision manufacturing enhancement. The country's established technology sector and emphasis on manufacturing precision are supporting demand for advanced fiber laser technologies across major technology markets. Semiconductor operators and electronics companies are establishing comprehensive laser programs to serve both domestic technology needs and export manufacturing requirements.
Revenue from fiber lasers in China is expanding at a CAGR of 11.7%, supported by the country's focus on manufacturing scale-up, comprehensive industrial modernization programs, and strategic investment in automated manufacturing improvement. China's established manufacturing infrastructure and emphasis on production efficiency are driving demand for specialized laser technologies focusing on operational scale and manufacturing optimization. Industrial operators are investing in comprehensive laser modernization to serve both domestic manufacturing requirements and export production operations.
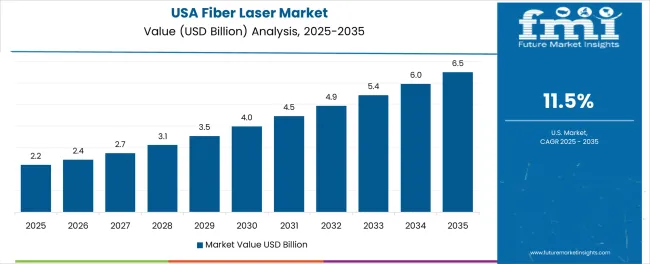
Revenue from fiber lasers in United States is expanding at a CAGR of 11.5%, supported by the country's focus on advanced manufacturing capabilities, comprehensive automotive industry programs, and strategic investment in precision manufacturing improvement. United States' established industrial sector and emphasis on manufacturing innovation are driving demand for specialized laser technologies focusing on operational precision and advanced manufacturing capabilities. Manufacturing operators are investing in comprehensive laser enhancement to serve both domestic industrial requirements and technological advancement initiatives.
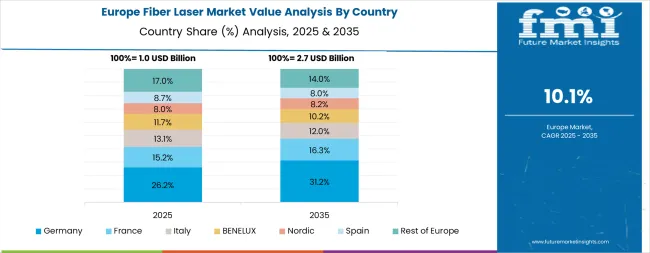
The fiber laser market in Europe is projected to grow from USD 1.1 billion in 2024 to USD 3.2 billion by 2034, registering a CAGR of 11.2% over the forecast period. Germany is expected to maintain its leadership position with a 35.4% market share in 2024, increasing to 36.1% by 2034, supported by its advanced manufacturing infrastructure, comprehensive precision engineering capabilities, and major automotive facilities serving European and international markets.
United Kingdom follows with a 18.7% share in 2024, projected to reach 19.2% by 2034, driven by advanced manufacturing programs, aerospace industry development, and established technology capabilities, but facing challenges from competitive pressures and infrastructure investment constraints. France holds a 16.3% share in 2024, expected to decline to 15.8% by 2034, supported by industrial modernization requirements and manufacturing development but facing challenges from regulatory adjustments and investment uncertainties. Italy commands a 12.9% share in 2024, projected to reach 13.1% by 2034, while Netherlands accounts for 8.2% in 2024, expected to reach 8.4% by 2034. The Rest of Europe region, including Nordic countries, Eastern European markets, Spain, and other European countries, is anticipated to gain momentum, expanding its collective share from 8.5% to 9.1% by 2034, attributed to increasing manufacturing development across Nordic countries and growing industrial modernization across various European markets implementing advanced laser upgrade programs.
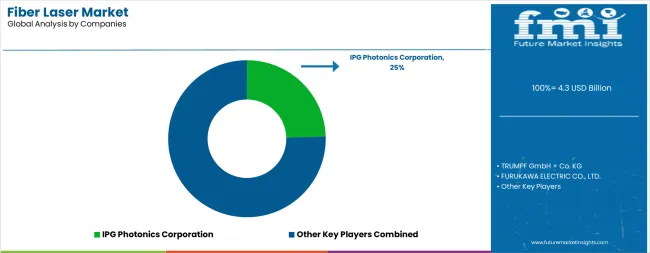
The fiber laser market is characterized by competition among established laser technology manufacturers, specialized fiber laser system providers, and integrated manufacturing equipment service companies. Companies are investing in advanced high-power laser research, automation technology development, medical application optimization, and comprehensive laser portfolios to deliver precise, reliable, and technologically-advanced fiber laser solutions. Innovation in laser technology systems, automated control technologies, and specialized application capabilities is central to strengthening market position and competitive advantage.
IPG Photonics Corporation leads the market with a strong presence, offering comprehensive fiber laser solutions with a focus on high-power technology and advanced engineering capabilities for industrial and manufacturing operations. TRUMPF GmbH + Co. KG provides specialized manufacturing equipment portfolios with an emphasis on precision engineering, automation capabilities, and comprehensive service support. Coherent Inc. delivers integrated laser technology and optical solutions with focus on innovation and technological advancement. FANUC CORPORATION specializes in industrial automation with emphasis on manufacturing integration and operational excellence. Wuhan Raycus Fiber Laser Technologies focuses on fiber laser manufacturing with cost-effective solutions and technical expertise.
| Items | Values |
|---|---|
| Quantitative Units (2024) | USD 4.3 billion |
| Output Power | Low Power (Up to 100 W), Medium Power (100 W to 2000 W), High Power (More than 2000 W) |
| Laser Type | CW, Pulsed, QCW |
| Application | Cutting, Welding & High Power Applications, Marking, Fine & Microprocessing, Medical, Communications & Advanced Applications |
| Regions Covered | North America, Latin America, Western Europe, Eastern Europe, East Asia, South Asia Pacific, Middle East & Africa |
| Countries Covered | United States, Canada, Germany, United Kingdom, France, China, India, Japan, South Korea, Australia, and 30+ countries |
| Key Companies Profiled | IPG Photonics Corporation, TRUMPF GmbH + Co. KG, Coherent Inc., FANUC CORPORATION, Wuhan Raycus Fiber Laser Technologies, and others |
| Additional Attributes | Equipment sales by power and type category, regional demand trends, competitive landscape, technological advancements in laser systems, automation development, medical applications innovation, and operational efficiency optimization |
The global fiber laser market is estimated to be valued at USD 4.3 billion in 2025.
The market size for the fiber laser market is projected to reach USD 12.8 billion by 2035.
The fiber laser market is expected to grow at a 11.5% CAGR between 2025 and 2035.
The key product types in fiber laser market are high power (more than 2000 w), low power (up to 100 w) and medium power (100 w to 2000 w).
In terms of laser type, cw segment to command 76.1% share in the fiber laser market in 2025.


Full Research Suite comprises of:
Market outlook & trends analysis
Interviews & case studies
Strategic recommendations
Vendor profiles & capabilities analysis
5-year forecasts
8 regions and 60+ country-level data splits
Market segment data splits
12 months of continuous data updates
DELIVERED AS:
PDF EXCEL ONLINE
Fiber Laser Coding System Market Size and Share Forecast Outlook 2025 to 2035
Laser Fiber In Medical Applications Market
Fiber Lid Market Forecast and Outlook 2025 to 2035
Fiberglass Tanks Market Size and Share Forecast Outlook 2025 to 2035
Fiber Sorter Market Size and Share Forecast Outlook 2025 to 2035
Fiber Reinforced Polymer Panel and Sheet Market Size and Share Forecast Outlook 2025 to 2035
Fiber Optic Tester Market Size and Share Forecast Outlook 2025 to 2035
Fiberglass Market Size and Share Forecast Outlook 2025 to 2035
Fiber Spinning Equipment Market Size and Share Forecast Outlook 2025 to 2035
Fiber Reinforced Plastic (FRP) Panels & Sheets Market Size and Share Forecast Outlook 2025 to 2035
Fiberglass Fabric Market Size and Share Forecast Outlook 2025 to 2035
Fiber Optic Connectivity Market Size and Share Forecast Outlook 2025 to 2035
Fiber Optic Collimating Lens Market Size and Share Forecast Outlook 2025 to 2035
Fiberglass Duct Wrap Insulation Market Size and Share Forecast Outlook 2025 to 2035
Fiber-Based Blister Pack Market Analysis - Size and Share Forecast Outlook 2025 to 2035
Fiber Optics Testing Market Size and Share Forecast Outlook 2025 to 2035
Fiber Optics Market Size and Share Forecast Outlook 2025 to 2035
Fiber Reinforced Polymer (FRP) Rebars Market Size and Share Forecast Outlook 2025 to 2035
Fiber Supplements Market Size and Share Forecast Outlook 2025 to 2035
Fiberglass Filters Market Size and Share Forecast Outlook 2025 to 2035

Thank you!
You will receive an email from our Business Development Manager. Please be sure to check your SPAM/JUNK folder too.
Chat With
MaRIA