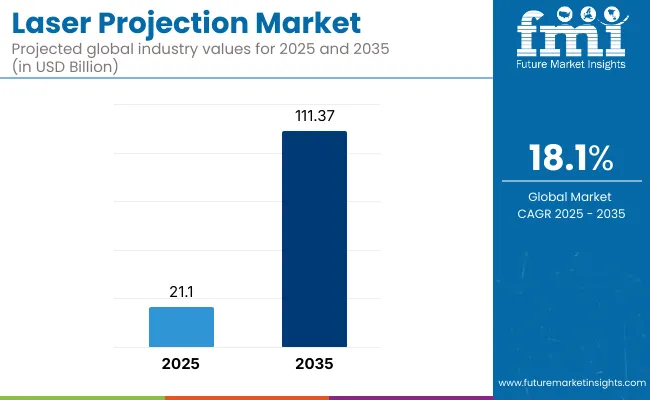
The laser projection market is valued at USD 21.1 billion in 2025. The industry is expected to grow at an 18.1% CAGR and reach USD 111.37 billion by 2035, according to FMI research. One of the major epicenters for growth in 2024 continued to be high-brightness applications, both at the commercial level and the home cinema level, spanning various applications, with the laser projector industry flourishing in 2024.

Increasing acceptance in corporate habitats, digital signage, and entertainment facilities propelled industry growth. Theme parks and cinemas invested in upgrading to laser projectors for better picture quality and energy efficiency. Suppliers continued improving laser longevity and color accuracy, prompting adoption.
The rise of hybrid work increased the demand for high-quality projection solutions in high-end conference rooms and collaborative spaces. Educational institutions increased spending on laser projectors for augmented learning. In the meantime, supply chains stabilized, and cost savings made high-performance projectors more affordable.
FMI research projects that advancements in 4K and 8K laser projection will drive further adoption. FMI projects that emerging applications across simulation, automotive heads-up displays, and augmented reality will provide new revenue channels. Demand will be driven by government spending on smart infrastructure and digitalization.
There is a rapidly growing industry for laser projection also known as laser display technology globally, fuelled by increasing demand for energy-efficient, high-resolution display solutions for entertainment, corporate, and education industries. According to FMI research, the rise in 4K and 8K projection and lower costs are driving uptake, sparking interest among both manufacturers and consumers due to better image quality. According to FMI, companies and organizations are shifting their focus towards long-term efficiency and sustainable, low-maintenance costs, signalling the end of lamp-based projectors.
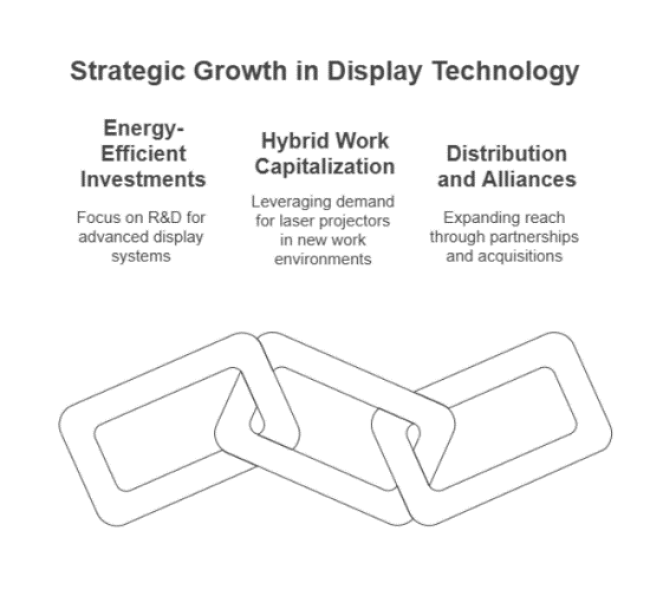
Consider Energy-Efficient and High-Resolution Investments
The next step is for executives to prioritize R&D spending on 4K and 8K laser display systems that offer enhanced brightness and colour. It will promote competitive distinction as well as future profitability for products with broadened product lines toward energy-saving and low-maintenance products.
Capitalize on the movement toward hybrid work and immersive learning
Companies should capitalize on the growing demand for laser projectors in business collaboration spaces, as well as educational institutions. New streams of income will emerge from building solutions tailored to remote and workplace hybrid settings as well as interactive learning experiences.
Expand the reach through distribution and alliances
These developments will not only accelerate growth but also lead to reinvestment in existing tools with AV integrators, entertainment theatres, and digital signage solutions suppliers. Businesses will enter into partnerships or acquire companies that specialize in AI-based projection effects and smart screen technologies.

| Risk | Probability & Impact |
|---|---|
| Supply Chain Disruptions | High Probability - High Impact |
| High Initial Costs Limiting Adoption | Medium Probability - High Impact |
| Competition from Emerging Display Technologies | Medium Probability - Medium Impact |
| Priority | Immediate Action |
|---|---|
| Accelerate R&D in High-Resolution Projection | Develop and test 4K/8K laser projectors with improved brightness and energy efficiency |
| Strengthen Corporate & Education Industry Presence | Initiate OEM feedback loop on hybrid work and immersive learning projector demand |
| Expand Distribution & Strategic Partnerships | Launch aftermarket channel partner incentive pilot to drive adoption |
To stay ahead companies must speed up their investment in energy-efficient, high-resolution laser-based projection technologies to stay ahead of shifting customer demand to remain competitive. According to FMI analysis, both business and educational sectors are shifting toward hybrid collaboration and immersive learning applications, driving demand for tailored product strategies.
FMI projects that partnerships with digital signage players and AV integrators will be critical for industry entry. For the next year, the leadership team should focus on achieving best-in-class R&D in 4K/8K projection, strengthening distribution channels, and integrating AI-driven features, and leveraging AI to drive differentiation and usefulness, given the intense industry dynamics expected in 2024
Regional Difference:
Strong growth in automation and smart features:
ROI Perspectives:
Global Cost Concerns:
Regional Differences:
Manufacturers:
Distributors:
End Users (Corporate & Educational Buyers):
Alignment:
Regulatory impact:
Conclusion: The industry adaptation strategy:
Key Variances:
Strategic Insight:
| Country | Policy & Regulatory Impact on the Laser Projection Industry |
|---|---|
| United States | Energy efficiency laws, like the Energy Star rating and California Title 24, require less power usage in laser projectors. The Federal Communications Commission (FCC) also governs laser emissions for safety standards. |
| United Kingdom | The product complies with UKCA (UK Conformity Assessed) marking after Brexit, superseding CE certification. Government incentives drive green projection technology under the Net Zero Strategy. |
| France | Conformity with EU Eco-design Directives and Restriction of Hazardous Substances (RoHS) is obligatory. Stringent energy efficiency regulations under the Grenelle II Act affect manufacturing. |
| Germany | Greener electronics are regulated by CE certification and Blauer Engel (Blue Angel) environmental labelling. The EU Digital Strategy encourages clever laser projection technology also known as laser imaging system in public infrastructure. |
| Italy | CE Marking and compliance with the Eco-design Directive is necessary. The Italian National Recovery and Resilience Plan (NRRP) offers green tech incentives. |
| South Korea | The product is fully compliant with the Korea Certification (KC) Mark, meeting both safety and electromagnetic requirements. The Green New Deal provides a government subsidy for energy-efficient display technology. |
| Japan | The product complies with Japan Industrial Standards (JIS) for quality and safety. Severe regulations on laser emissions under the Electrical Appliance and Material Safety Law (PSE Mark). |
| China | Compliance with China Compulsory Certification (CCC) and GB Standards of electronic safety and laser emissions is ensured. Domestic laser imaging system innovation is supported by the Made in China 2025 policy. |
| Australia-NZ | Laser projectors need compliance with the Regulatory Compliance Mark (RCM) and Australian Communications and Media Authority (ACMA) standards for energy efficiency and safety. |
| India | Subject to the Bureau of Indian Standards (BIS) certification and E-Waste Management Rules. The Make in India initiative by the government encourages domestic manufacturing of laser projection technology. |
The industry is dominated by the laser projector segment, which has the highest industry share owing to its extensive usage in cinemas, corporate places, and educational categories. High brightness, low maintenance, and energy efficiency drive its demand.
With the mainstream focus on 4K, upcoming 8K projection hardware, and the advent of AI-based image processing technology, these projectors enhance viewing experiences significantly. The fastest growing segment is the CAD laser display technology systems, within the automotive, aerospace, and industrial sectors. Their ability to provide accurate, high-resolution projections for manufacturing guidance and quality control drives demand.
The acceleration of the implementation of Industry 4.0 and the industry growth of smart factories are enhancing the expansion, and top industry players are investing in laser-guided production systems. The segment is also benefiting from increasing automation trends, particularly in developed economies. However, CAD laser projection systems will see exponential growth as precision engineering is leveraged to other industries due to wider use in robotics, prototyping, and industrial visualization applications worldwide.
The cinema vertical remains the prominent vertical within the landscape, represented by continued changes, particularly as companies slowly reject lamp-based projectors, supporting the general shift towards laser imaging system. The film industry is pouring big money into these RGB laser and phosphor-based projection systems with superior brightness, better colour accuracy, and lower cost of ownership.
Further growth in the cinema vertical will be driven by the expansion of multiplexes in emerging markets. The education vertical is a key growth driver, supported by the increasing adoption of smart classrooms and hybrid learning environments. In addition, schools and universities utilize interactive laser projection solutions, introducing innovative high-definition images, augmented reality support, and elements of virtual simulation in the educational process.
Government-sponsored digital education programs are further fuelling this growth. Enterprise space- Conference rooms, training centers, and corporate events are witnessing increasing demand for laser projectors. On the other hand, projection mapping and interactive digital signage are gaining traction in various public spaces, such as museums, amusement parks, and retail environments, expanding industry opportunities.

| Country | Industry Size in 2035 (USD Billion) |
|---|---|
| United Kingdom | 17.8% |
| Japan | 15.8% |
| United States | 19.5% |
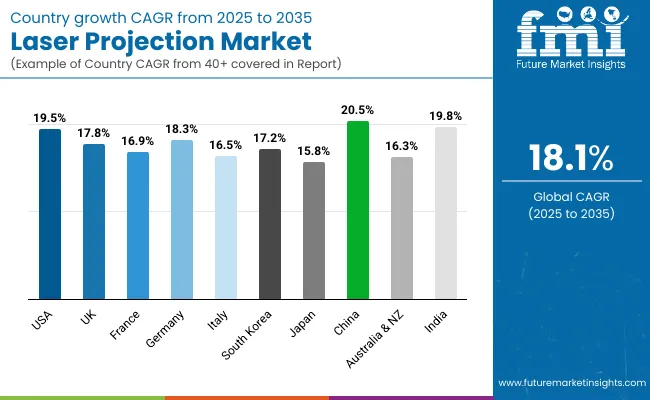
In the USA, the growth of the laser display technology industry will be 19.5% CAGR through 2025 to 2035, on demand from cinema, corporate, and education markets. Hollywood’s transition to laser projection also known as smart laser display and the growth of immersive entertainment (theme parks, museums) drive adoption.
Government programs like Energy Star certification and FCC guidelines encourage energy efficiency and adherence to safety standards, for instance. Such investment by tech majors in AR/VR facilitates innovation at lightning pace. Demand is powered by corporate spending on hybrid work solutions, and the likes of Epson and Barco up their ante. The USA is the largest industry due to significant investments in research, development, and rapid technological advancements.
Increasing demand for theatre, education, and corporate markets will drive the UK laser projection industry to expand at a 17.8% CAGR. The post-pandemic boom in live events and interactive experiences drive adoption. UKCA marking-a parting gift from Brexit replacing the CE mark-provides a clear path to regulatory compliance. Energy projection under the Net Zero Strategy further leads to green innovations and incentives.
From boardroom laser displays to data, the corporate exodus has created a hybrid workplace. Rise is further driven by major universities adopting interactive classrooms. In a landscape of changing display technology in Western Europe, low-maintenance and long-life projection systems are highly desirable, making the UK a vital growth center.
Industrial Applications Power Growth of France laser display technology market, Anticipated to Grow at 16.9% CAGR through 2030 The country’s vibrant art and culture sector, including museums and heritage sites, is using projection mapping to create interactive experiences. Strict energy efficiency levels regulated by European Eco-design Directives and the Grenelle II Act would force the migration to laser-based displays.
Commercial sector growth is based on corporate investment in intelligent workspaces. The use of interactive laser displays in education and high-end retail contributes to the market's growth. R&D about green projection technology continues to grow; France is among the top European centers of innovation.
It is anticipated that the industrial, corporate, and education segments will drive the growth of Germany's laser imaging system industry at a CAGR of 18.3%. The Blauer Engel environmental certification and CE marking further encourage the use of sustainable technology. Germany leads with smart factory ecosystems and meets the high-precision smart laser display needs in engineering and automotive industries.
Universities and research institutions are accelerating investment in interactive lecture theatres and digital education. Growth through public funding in Industry 4.0 and automatic production visualization With Germany transitioning to high-tech manufacturing, adoption of laser projection will continue to surge in corporate, industrial, and educational markets.
The eyeglasses segment in Italy, on the basis of type, will lead in the market, and the growth is ascribed to the utilization of IT C7-based laser display technology for cinema, retail, and tourism sectors in the country at a CAGR of 16.5% during the forecast period. Cinema in Italy is rapidly adopting laser projection, and theatres are switching to energy-saving systems.
The National Recovery and Resilience Plan (NRRP) in Italy promotes a green and digital transition, as well as offering advantages in the market. Projection mapping is a marketing tool for retail chains, while museums and monuments tend to apply it with interactivity. As Italy's corporate and education sectors gradually adopt low-maintenance green smart laser display, the country presents a significant growth opportunity.
Smart city initiatives, entertainment, and corporate usage are driving the 17.2% CAGR growth of the South Korean laser imaging system market. The KC Mark certifies that the product meets energy efficiency and safety requirements. The organization of high-tech infrastructures in Seoul has led to rising demand for large-scale digital displays and projection-mapping types so that advanced digital images and data can be utilized and shared.
Use of esports and virtual gaming also speeds adoption. Corporate offices in South Korea are purchasing laser projectors for interactive learning and intelligent meeting rooms. With the government's support for digital innovation, South Korea is emerging as a trendsetting country in next-generation display technology.
Business, entertainment, and training industries in Japan expect laser device projection requests to grow at a 15.8% CAGR. JIS: Japan Industrial Standards and PSE Mark regulate laser energy efficiency and safety. The increased penetration of smart classrooms and corporate automation is also fuelling demand. The growth is being challenged by high hardware prices and regulatory lags.
The premium retail segment in Japan is leaning into projection-based digital signage, with specialty demand for immersive laser displays driving a sub-category of the segment within theme parks and entertainment complexes. Despite weak growth relative to the other countries in the APAC region, Japan remains a key industry for best-in-class precision-based laser display technology.
China will grow laser projection sales at 20.5% CAGR, aided by government-sponsored digital initiatives. The CCC and GB Standards are national safety compliance requirements in China. The preference for local indigenous innovation, as seen in policies like Made in China 2025, spurs both indigenous smart laser display technologies and investment in them. Laser-based screens are rapidly replacing cinemas and corporate venues-and entering into schools.
Massive government spending on smart city projects fuels demand for large-scale projection mapping. Backed with strong local manufacturing capacity and AI-facilitated display technologies, China will stake its claim in the global laser imaging system plot.
The Australian and New Zealand laser projection industry is expected to grow at a CAGR of 16.3% during the forecast period, driven by entertainment, corporate, and education. The Regulatory Compliance Mark (RCM) and ACMA are in place to ensure adherence to safety and energy efficiency standards. The burgeoning industry for live entertainment and sports is placing its bets with projection systems that blanket stadiums.
Hybrid work models are driving corporate acceptance. Interactive smart laser display for lecture theatres: Universities and institutions are adopting it. The undeterred laser display technology coverage across Australia and New Zealand will only grow with the evolving long-term and sustainable display technology investment.
India, which accounts for the largest share of industry growth and revenue across all verticals in smart laser display, will grow at 19.8% CAGR led by the education, corporate, and entertainment industries. Both the Bureau of Indian Standards (BIS) and E-Waste Management Rules regulate the industry. Mass adoption is driven by government programs like the Digital India and Smart City missions. The growth in OTT media and multiplex growth drives the demand for quality cinema projection.
Education systems are implementing interactive laser-based learning. With the Make in India program, domestic manufacturing is on the rise, reducing reliance on imports. Given the rapid urbanization and digital infrastructure compliance that is happening, India is gradually evolving as a key laser projection marketplace in Asia.

Key players in the smart laser display industry are competing on pricing strategies, technology innovation, strategic agreements, and international expansions. Leaders claim they enhance their R&D spending in terms of better brightness, image resolution, and energy efficiency, as well as an infusion of AI-based image processing.
Price sensitivity is a crucial factor, particularly in the education and enterprise sectors. Companies are making deals with cinema operators, universities, and corporate customers to get long-term contracts. A key focus strategy remains geographic expansion to high-growth markets, including Asia-Pacific and the Middle East. Merger and acquisition business is booming, as companies acquire smaller technology firms to strengthen intellectual property, supply chains, and global industry access.
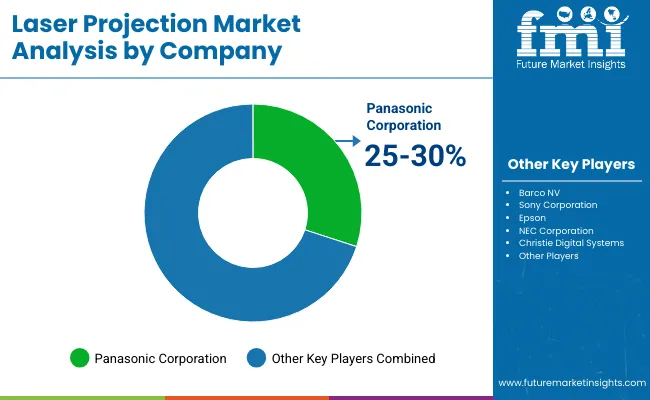
Panasonic Corporation
Market Share: ~25-30%
Panasonic is a industry leader in laser imaging system and has leveraged its experience developing high-brightness laser projectors for cinema, large venues, and simulation applications.
Barco NV
Industry Share: ~20-25%
Barco remains a formidable challenger, offering high-end laser display technology for entertainment, healthcare, and enterprise markets with an emphasis on 4K and HDR innovation.
Sony Corporation
Industry Share: ~15-20%
Ideal for digital cinema and professional AV, the laser projector is popular in Asia and North America, which are Sony's key markets.
Epson
Industry Share: ~10-15%
Epson specializes in 3LCD laser projectors for education and corporate markets, offering low-cost, power-saving options.
NEC Corporation
Industry Share: ~5-10%
NEC specializes in installations and sales of large-venue laser projectors, with demand growing for digital signage and simulation.
Christie Digital Systems
Industry Share: ~5-10%
Christie, a unit of Ushio Inc., commands the high-lumen laser projector industryfor theme parks, live events, and planetariums.
The industry is segmented into laser projector and CAD laser projection system
It is segmented into enterprise, public places, cinema, education and others
The industry is fragmented among North America, Latin America, Western Europe, Eastern Europe, South Asia and Pacific, East Asia and Middle East and Africa
More usage in cinemas, education, and corporations because of higher brightness and longer life with low maintenance.
Laser projectors offer superior energy efficiency, longer run time, and improved color accuracy barring a pricey consumable replacement of the lamp-based unit.
Digital classrooms, immersive experiences, and industrial visualization have the potential to put entertainment, education, and manufacturing on the hot list of temperature-responsive sectors in industries.
Image processing powered by AI, 8K resolution, ultra-short throw technology, and convergence with AR.
Flexible pricing models and/or leasing options and/or strategic partnerships to reduce acquisition costs and enhance accessibility.


Full Research Suite comprises of:
Market outlook & trends analysis
Interviews & case studies
Strategic recommendations
Vendor profiles & capabilities analysis
5-year forecasts
8 regions and 60+ country-level data splits
Market segment data splits
12 months of continuous data updates
DELIVERED AS:
PDF EXCEL ONLINE
Laser-Assisted Smart Lathes Market Size and Share Forecast Outlook 2025 to 2035
Laser Drilling Equipment Market Size and Share Forecast Outlook 2025 to 2035
Laser Transverse Mode Teaching Instrument Market Forecast and Outlook 2025 to 2035
Laser Welding Equipment Market Forecast and Outlook 2025 to 2035
Laser Welding Market Size and Share Forecast Outlook 2025 to 2035
Laser Ablation Systems Market Size and Share Forecast Outlook 2025 to 2035
Laser Measurement Integrating Sphere Market Size and Share Forecast Outlook 2025 to 2035
Laser Safety Cloths Market Size and Share Forecast Outlook 2025 to 2035
Laser Dazzler Market Size and Share Forecast Outlook 2025 to 2035
Laser Cable Marking Market Size and Share Forecast Outlook 2025 to 2035
Laser Cladding Market Size and Share Forecast Outlook 2025 to 2035
Laser Marking Equipment Market Size and Share Forecast Outlook 2025 to 2035
Laser Cutting Machines Market Size and Share Forecast Outlook 2025 to 2035
Laser Wire Marking Systems Market Size and Share Forecast Outlook 2025 to 2035
Laser Photomask Market Size and Share Forecast Outlook 2025 to 2035
Laser Measuring Instrument Market Size and Share Forecast Outlook 2025 to 2035
Laser Welding Machine Market Size and Share Forecast Outlook 2025 to 2035
Laser Technology Market Size and Share Forecast Outlook 2025 to 2035
Laser Interferometer Market Size and Share Forecast Outlook 2025 to 2035
The Laser Therapy Devices Market is segmented by Device Type and End User from 2025 to 2035

Thank you!
You will receive an email from our Business Development Manager. Please be sure to check your SPAM/JUNK folder too.
Chat With
MaRIA