Reports

- Global Locations -

Headquarters

Future Market Insights, Inc.

Christiana Corporate, 200
Continental Drive, Suite 401,
Newark, Delaware - 19713,
United States

T: +1-845-579-5705

Americas

Future Market Insights, Inc.

616 Corporate Way, Suite 2-9018,
Valley Cottage, NY 10989, United States

T: +1-347-918-3531

MEA

Future Market Insights

1602-6 Jumeirah Bay X2 Tower, Plot No: JLT-PH2-X2A,
Jumeirah Lakes Towers, Dubai,
United Arab Emirates

Europe

Future Market Insights

3rd Floor, 207 Regent Street,
W1B 3HH London
United Kingdom

T: + 44 (0) 20 8123 9659
D: +44 (0) 20 3287 4268

Asia Pacific

Future Market Insights

IndiaLand Global Tech Park, Unit UG-1, Behind Grand HighStreet, Phase 1, Hinjawadi, MH, Pune – 411057, India

Laser Technology Market Outlook (2022 to 2032)

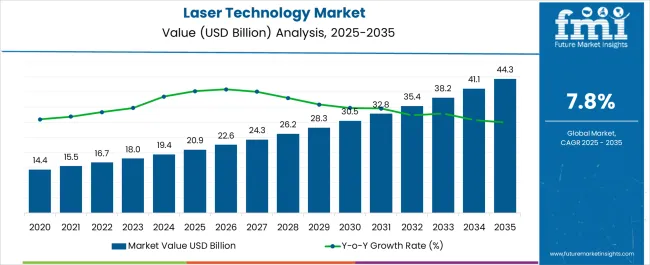
The global laser technology market size is forecast to increase from US$ 16.7 billion in 2022 to US$ 35.4 billion by 2032. Overall laser technology demand will surge at 7.8% CAGR between 2022 and 2032.

In 2021, global laser technology sales revenue totaled US$ 15.4 billion. Demand will remain high for solid lasers during the assessment period. This is due to rising usage of solid-state lasers across various industries such as defense.

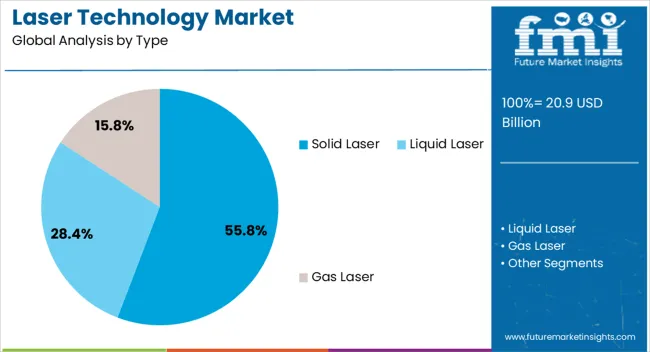
As per Future Market Insights, solid laser segment will expand at 7.7% from 2022 to 2032. This will make it a top revenue generation segment for laser manufacturing companies.

Key Trends Shaping the Laser Technology Demand

  • Rising applications in automotive and healthcare sectors to augment growth in the laser technology industry
  • Growing awareness about the advantages of laser-based techniques will elevate demand
  • Usage of Locus Beam Control (LBC) technology for improving laser system performance will bode well for the market.
  • Increasing popularity of ophthalmic lasers in eye treatments to create revenue-generation opportunities
  • Advancements in photonic technology and growing popularity of laser therapy will foster market development
  • High usage of lasers in optical communication applications will boost sales
  • Rising adoption of 3D laser scanning is likely to create growth prospects for the market
  • Widening applications of laser technology in defense & military sector will spur growth
  • Shift towards micro and nano-devices to stimulate market development
  • Advancements in laser technology will create new growth prospects for laser manufacturers
  • Penetration of digitalization and artificial intelligence opening new promising fields for laser technology

Since its development, laser technology has gained enormous traction worldwide. It has revolutionized various procedures and techniques performed across several industries. This includes automotive, healthcare, oil & gas, defense, manufacturing, etc.

Devices that emit light through an optical amplification process based on the stimulated emission of electromagnetic radiation are called lasers. They find applications in almost every section of modern society, including consumer electronics, medicine, military, and fiber-optic communication.

Lasers have become key components of various products that we use today. For instance, barcode scanners rely on lasers for information processing. DVD players depend on lasers to read information from disks. Lasers also find applications in several surgical procedures including LASIK eye surgery.

A few common applications of laser technology include

  • Laser material processing (cutting, engraving, marking, drilling, surface modification)
  • Laser surgery
  • Laser spectroscopy
  • Laser range finding
  • Optical communication
  • Bar code readers
  • Information processing (Blu-Ray and DVDs)
  • Holographic imaging

Growing usage of laser technology in automotive industry will boost the global market. Lasers provide high precision and accuracy in processes such as cutting and welding. They significantly improve productivity. As a result, they are being adopted by most automakers today.

Rising popularity of autonomous vehicles and integration of ADAS will also boost laser sales during the assessment period.

Another prominent factor that will fuel laser technology demand is the growing adoption of medical lasers. Lasers are being used in medical applications, such as surgery and ophthalmology.

They are showing promising results for the treatments of kidney stones, varicose veins, glaucoma, tumors, heart diseases, and other health conditions.

Rising prevalence of eye diseases such as cataracts is set to create lucrative opportunities for laser manufacturers. This is because these medical conditions can easily be treated with lasers.

Lasers allow medical professionals to accomplish more complex tasks, reduce chances of wound infection, decrease postoperative discomfort, and reduce blood loss. Hence, rising popularity of laser surgery will boost the global laser technology industry.

Besides this, increasing usage of laser technology in applications such as weaponry, telecommunication, and electronics will boost laser technology sales revenues.

With lasers becoming smaller and more powerful, application area of laser technology will keep increasing dramatically.

Attributes Key Insights
Laser Technology Market Size in 2022 US$ 16.7 billion
Projected Market Value (2032) US$ 35.4 billion
Value-based CAGR (2022 to 2032) 7.8%
USA Market CAGR (2022 to 2032) 6.6 %

Don't pay for what you don't need

Customize your report by selecting specific countries or regions and save 30%!

2017 to 2021 Laser Technology Sales Outlook Compared to Demand Forecast from 2022 to 2032

Global demand for laser technology increased at around 8.7% CAGR from 2017 to 2021. Total market value at the end of 2021 reached US$ 15.4 billion. Over the projection period, the worldwide laser technology industry will thrive at 7.8% CAGR, creating an absolute $ opportunity of US$ 18.7 billion.

Lasers are light-emitting devices that emit focused beams of light. Various industries, including manufacturing, communications, entertainment, and others, use laser technology in a variety of ways.

Several different manufacturing processes use lasers for cutting, welding, drilling, and marking. They provide high precision, speed, and accuracy, which can increase efficiency and lower costs.

Lasers are being increasingly adopted in the production of automobiles for cutting and welding metal components. Laser cutting and welding are precise and efficient which reduces manufacturing time and cost.

Laser headlights are also becoming more popular in high-end vehicles. Compared to conventional headlights, laser headlights are more energy-efficient and offer better visibility.

Advanced driver assistance systems (ADAS) use lasers to detect objects and roadblocks. This contributes to increased security and accident prevention. With rising adoption of ADAS, the demand for lasers is likely to increase at a healthy pace. This in turn will fuel market expansion.

There were around 82.6 million cars in 2021. It is projected that the number of cars produced by 2030 will reach about 111 million. Rising demand for automobiles will play a key role in boosting the laser technology industry. This is because lasers play a crucial role in the manufacturing process of automobiles.

Lasers are also used in a wide range of medical applications, such as surgery, dermatology, and ophthalmology. They are preferred over conventional methods due to the precise and minimally invasive procedures that are less painful and require less time to recover.

Diseases such as cancer, cataracts, and skin disorders are just a few of the conditions that can be treated with lasers. According to the World Health Organisation (WHO), in 2018 around 38.5 million people were suffering from blindness due to cataracts.

By 2030, it is estimated that around 56 million people will be suffering from blindness or severe visual impairments due to cataracts. As laser technology plays a crucial role in treating cataracts through surgery, rising cases of cataracts worldwide will elevate demand for lasers in the medical field.

Which Region Will Lead the Global Laser Technology Industry?

Asia Pacific to Create Lucrative Growth Avenues for the Laser Technology Manufacturers

As per Future Market Insights’ analysis, Asia Pacific will dominate the worldwide laser technology industry. It will create maximum growth opportunities for market expansion.

Asia Pacific laser technology market value reached US$ 8.1 billion in 2022. By the end of 2032, Asia Pacific market size will reach US$ 17.2 billion in 2032.

Booming automotive and consumer electronics industries supported by high adoption of laser technology in these sectors is driving the market.

Asia-Pacific is considered a manufacturing hub in the world due to large presence of various consumer electronics and automotive companies. Laser technology plays a crucial role in the manufacturing sector.

Laser technology has several advantages over traditional manufacturing methods, including greater precision, accuracy, and speed. It is commonly used to cut and weld materials such as metals, plastics, ceramics, and composites.

Laser cutting is a prevalent method for producing precise and intricate designs in sheet metal, whereas laser welding is used to connect two or more metal parts.

Asia-Pacific has a significant automobile market with a significant number of cars being sold and manufactured in the region. The region recorded around 32 million units of cars sold in the year 2020 which increased to around 34 million in 2021.

As lasers play a crucial role in the production of automobiles, rising demand for automobiles in the region will fuel expansion of laser technology industry.
Sudip Saha
Sudip Saha

Principal Consultant

Talk to Analyst

Find your sweet spots for generating winning opportunities in this market.

Comparative Analysis of Adjacent Markets

Mobile Laser Scanning Market:

Differentiating Aspects Mobile Laser Scanning Market
CAGR for 2022 to 2032 15.5%
Market Valuation in 2022 20.6 billion
Demand Drivers
  • Rising applications of mobile laser scanning in civil engineering will drive the market.
  • Development of advanced mobile laser scanning systems is likely to boost sales.

Safety Laser Scanner Market:

Differentiating Aspects Safety Laser Scanner Market
CAGR for 2022 to 2032 ~6.2%
Market Valuation in 2022 US$ 298.1 million
Demand Drivers
  • Growing usage of safety laser scanners in industries such as automotive and healthcare will boost the market.
  • Increasing Focus on improving safety of workers and machines will fuel sales.

Country-wise Insights

Country United States
Projected CAGR (2022 to 2032) 6.6%
Historical CAGR (2017 to 2021) 5.6%
Market Value (2032) US$ 5.6 billion
Country United Kingdom
Projected CAGR (2022 to 2032) 6.2%
Historical CAGR (2017 to 2021) 4.2%
Market Value (2032) US$ 904.3 million
Country China
Projected CAGR (2022 to 2032) 9.3%
Historical CAGR (2017 to 2021) 10.9%
Market Value (2032) US$ 8.9 billion
Country Japan
Projected CAGR (2022 to 2032) 8.0%
Historical CAGR (2017 to 2021) 9.0%
Market Value (2032) US$ 5.5 billion
Country South Korea
Projected CAGR (2022 to 2032) 8.2%
Historical CAGR (2017 to 2021) 10.2%
Market Value (2032) US$ 2.2 billion

What is Fueling Sales of Lasers in the United States?

Rising Applications of Laser Technology in Medical Industry Triggering Sales in the USA Market

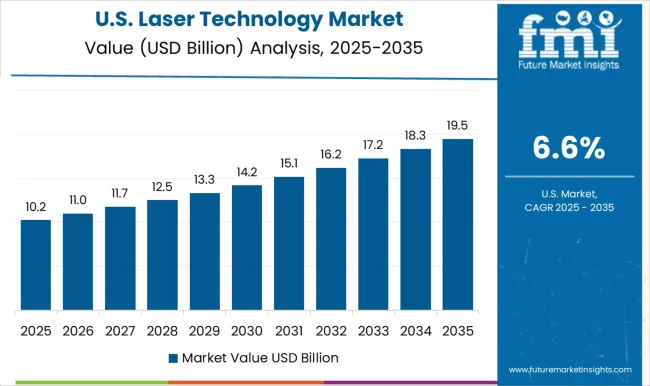
The United States laser technology market will cross a valuation of US$ 5.6 billion by 2032. It is likely to generate an absolute $ opportunity of US$ 2.6 billion through 2032. Overall laser technology in the country grew at 5.6% CAGR from 2017 to 2021.

Between 2022 and 2032, sales of lasers and laser systems in the United States will surge at 6.6% CAGR. Rising applications of laser technology in healthcare sector is a prominent factor fueling sales.

Similarly, rising cases of eye disorders and development of new advanced medical laser systems and ophthalmic lasers will boost the USA market.

In recent years, there has been a sharp rise in the cases of people with cataracts in the United States. For instance, around 25 million people were diagnosed with cataracts in 2018. It is projected that the number of people with cataracts will increase to around 38.5 million by 2030.

Rising cases of these eye disorders will in turn generate high demand for advanced lasers. This is because lasers play a crucial role in the treatment of cataracts by allowing for minimally invasive surgery and reduced recovery time.

Why is China Evolving as a Dominant Laser Technology Market?

High Adoption in Automotive Industry Elevating Demand for Laser Technology in China

As per the latest report, China will remain at the epicenter of laser technology industry through 2032. This is attributable to rising usage of laser technology in thriving automotive, electronics, and semiconductor sectors.

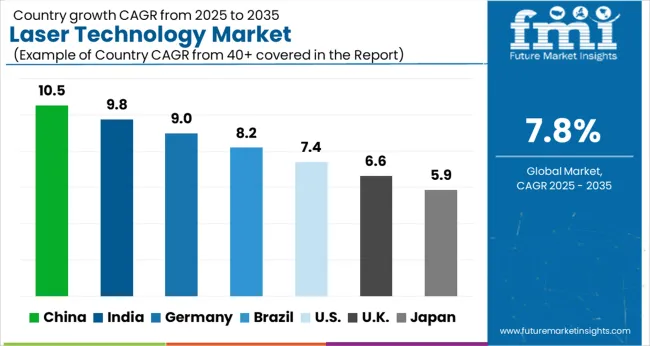
Laser technology demand in China increased at 10.9% CAGR between 2017 to 2021. Over the projection period, it will rise at a robust CAGR of 9.3%. By the end of 2032, China laser technology industry will top a valuation of US$ 8.9 billion.

China is a predominant hub for manufacturing in the world due to large presence of leading automobile and consumer electronics companies. It is also a predominant car manufacturer producing around 21 million cars in the year 2021.

With rising demand for automobiles, the demand for laser technology is also increasing in the country. This is because it provides an efficient and precise method of cutting and welding.

Laser technology is also used as a method of object detection in the ADAS (Advanced Driver Assistance System). Therefore, increasing usage of laser technology in thriving automotive industry will propel demand.
What Makes Japan a Lucrative Market for Laser Technology?

Increasing Adoption of Lasers in Consumer Electronics Boosting Japan Laser Technology Industry

The laser technology market size in Japan is set to reach US$ 5.5 billion by 2032. It will create absolute $ growth of US$ 3 billion over the next ten years. Laser technology sales revenue in Japan grew at a CAGR of 9% from 2017 to 2021.

Japan market will exhibit a CAGR of 8% during the assessment period from 2022 to 2032. Growing usage of laser technology in consumer electronics is a key factor driving the market.

Japan had around 107 million smartphone users in 2022 which is projected to increase to around 115 million by 2027. Laser technology is used in smartphones for various functions such as facial recognition and laser autofocus in the smartphone camera.

Therefore, with rising adoption of lasers in smartphones, the market for laser technology will expand at a healthy pace in the country during the assessment period.

Get the data you need at a Fraction of the cost

Personalize your report by choosing insights you need
and save 40%!

Category-wise Insights

Which Type of Laser Technology Will Remain High in Demand?

Demand to Remain High for Solid Lasers

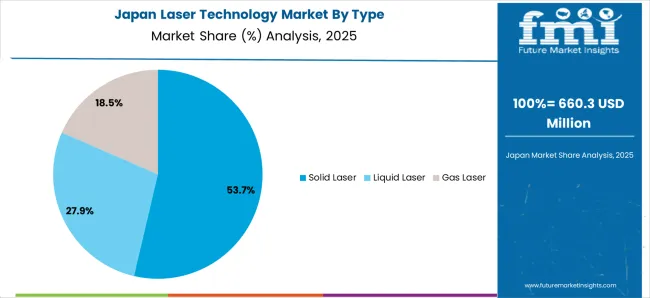
Based on type, demand in the market will remain high for solid lasers over the forecast period. The solid laser segment expanded at a CAGR of 8.5% between 2017 and 2021. Over the next ten years, it will progress at 7.7% CAGR.

A solid material, such as a crystal or a glass, is used as the gain medium in solid-state lasers. These lasers are extremely dependable and produce high-quality beams, making them ideal for a variety of applications such as industrial manufacturing, medical treatments, and scientific research.

Materials such as metals and plastics are cut, welded, drilled, and marked using solid-state lasers during the manufacturing processes. Solid Lasers are also ideal for high-volume production and customization due to their high precision and speed.

Solid-state lasers are widely used in a variety of medical procedures, including cancer therapies, dermatology procedures, and eye surgeries. They provide control and precision over the treatment area, reducing harm to adjacent tissues.

Which Product Will Remain Highly Sought-After in Laser Technology?

System Segment to Lead the Global Market Through 2032

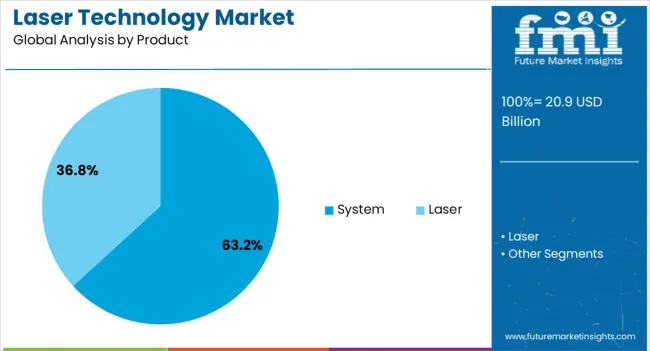
As per Future Market Insights, system segment will hold a prominent share of the market by 2032. This is due to rising adoption of laser systems across various industries.

The target segment registered a CAGR of 8.3% from 2017 to 2021. Between 2022 and 2032, laser systems demand is likely to soar at 7.6% CAGR.

Adoption of laser systems will increase across verticals such as automotive, medical, industrial, etc. This is due to their ability to perform a wide variety of functions including cutting, welding, engraving, etc.
Competitive Landscape

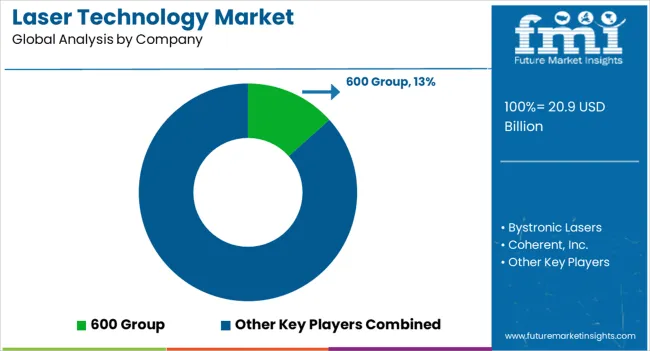
Leading laser technology manufacturers include 600 Group, Bystronic Lasers, Coherent, Inc., Epilog Laser, Euro Laser, Gravotech, Han's Laser Technology Co., Ltd., IPG Photonics, Jenoptik, and LaserStar.

New product launches, acquisitions, mergers, partnerships, and collaborations are few of the key strategies adopted by companies to stay relevant in the market.

Recent Developments

  • In July 2022, II-VI completed the acquisition of Coherent, Inc. Through this acquisition, II-VI expanded its presence in the laser market along with industrial, communications, and Electronics.
  • In June 2020, Coherent Inc launched HighLight FL4000CSM-ARM, a 4 KW fiber laser welding system for automobile welding. This new welding solution can improve the welding consistency, therefore, improving the overall weld quality.
  • In April 2020, Coherent Inc launched its new product HighLight DL HPSi. It is an industrial diode laser and can be used for various industrial processes such as metal cladding, heat treating, brazing, and welding.

Scope of the Report

Attribute Details
Current Market Size (2022) US$ 16.7 billion
Projected Market Size (2032) US$ 35.4 billion
Anticipated Growth Rate (2022 to 2032) 7.8% CAGR
Forecast Period 2022 to 2032
Historical Data Available for 2017 to 2021
Market Analysis US$ Million for Value and MT for Volume
Key Regions Covered North America, Latin America, Europe, Asia Pacific, and the Middle East & Africa
Key Countries Covered United States, Canada, Brazil, Mexico, Germany, United Kingdom, France, Italy, Spain, Nordic, Russia, Poland, China, India, Thailand, Indonesia, Australia and New Zealand, Japan, GCC countries, North Africa, South Africa, and others.
Key Segments Covered Type, Product, Application, Vertical, and Region
Key Companies Profiled
  • 600 Group
  • Bystronic Lasers
  • Coherent, Inc.
  • Epilog Laser
  • Euro Laser
  • Gravotech
  • Han's Laser Technology Co., Ltd.
  • IPG Photonics
  • Jenoptik
  • LaserStar
Report Coverage Market Forecast, Company Share Analysis, Competition Intelligence, Drivers Restraints Opportunity Trends Analysis, Market Dynamics and Challenges, and Strategic Growth Initiatives

Global Laser Technology Market Segmentation

By Type:

  • Solid Laser
  • Liquid Laser
  • Gas Laser

By Product:

  • System
  • Laser

Application:

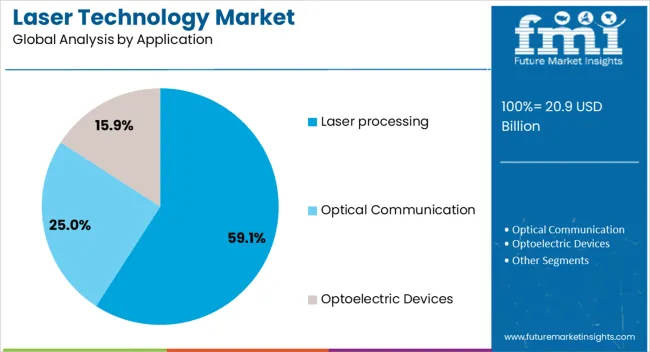
  • Laser processing
  • Optical Communication
  • Optoelectric Devices

By Vertical:

  • Telecommunication
  • Industrial
  • Semiconductor & Electronics
  • Commercial
  • Aerospace & Defense
  • Automotive
  • Medical
  • Research

By Region:

  • North America
  • Latin America
  • Europe
  • Asia Pacific
  • Middle East and Africa

Frequently Asked Questions

What was the Market Valuation in 2022?

The market was valued at US$ 16.7 billion in 2022.

What is the Growth Potential of the Market?

The growth potential of the market is 7.8% through 2032.

What is the Projected Size of the Market by 2032?

The global market size is estimated to reach US$ 35.4 billion by 2032.

Who are the Key Market Players?

600 Group, Bystronic Lasers and Coherent, Inc. are the key market players.

Which is the Top Opportunity in the Market?

Growing awareness about the advantages of laser-based techniques will elevate demand.

Table of Content

1. Executive Summary | Laser Technology Market

    1.1. Global Market Outlook

    1.2. Demand-side Trends

    1.3. Supply-side Trends

    1.4. Technology Roadmap Analysis

    1.5. Analysis and Recommendations

2. Market Overview

    2.1. Market Coverage / Taxonomy

    2.2. Market Definition / Scope / Limitations

3. Market Background

    3.1. Market Dynamics

        3.1.1. Drivers

        3.1.2. Restraints

        3.1.3. Opportunity

        3.1.4. Trends

    3.2. Scenario Forecast

        3.2.1. Demand in Optimistic Scenario

        3.2.2. Demand in Likely Scenario

        3.2.3. Demand in Conservative Scenario

    3.3. Opportunity Map Analysis

    3.4. Investment Feasibility Matrix

    3.5. PESTLE and Porter’s Analysis

    3.6. Regulatory Landscape

        3.6.1. By Key Regions

        3.6.2. By Key Countries

    3.7. Regional Parent Market Outlook

4. Global Market Analysis 2017 to 2021 and Forecast, 2022 to 2032

    4.1. Historical Market Size Value (US$ Million) Analysis, 2017 to 2021

    4.2. Current and Future Market Size Value (US$ Million) Projections, 2022 to 2032

        4.2.1. Y-o-Y Growth Trend Analysis

        4.2.2. Absolute $ Opportunity Analysis

5. Global Market Analysis 2017 to 2021 and Forecast 2022 to 2032, By Type

    5.1. Introduction / Key Findings

    5.2. Historical Market Size Value (US$ Million) Analysis By Type, 2017 to 2021

    5.3. Current and Future Market Size Value (US$ Million) Analysis and Forecast By Type, 2022 to 2032

        5.3.1. Solid Laser

            5.3.1.1. Fiber Laser

            5.3.1.2. Ruby Laser

            5.3.1.3. Yttrium Aluminum Garnet Laser

            5.3.1.4. Semiconductor Laser

            5.3.1.5. Thin-disk Laser

        5.3.2. Liquid Laser

            5.3.2.1. X-ray Laser

            5.3.2.2. Dye Laser

        5.3.3. Gas Laser

            5.3.3.1. CO2 Laser

            5.3.3.2. Excimer Laser

            5.3.3.3. Helium-Neon Laser

            5.3.3.4. Argon Laser

            5.3.3.5. Chemical Laser

        5.3.4. Others

    5.4. Y-o-Y Growth Trend Analysis By Type, 2017 to 2021

    5.5. Absolute $ Opportunity Analysis By Type, 2022 to 2032

6. Global Market Analysis 2017 to 2021 and Forecast 2022 to 2032, By Product

    6.1. Introduction / Key Findings

    6.2. Historical Market Size Value (US$ Million) Analysis By Product, 2017 to 2021

    6.3. Current and Future Market Size Value (US$ Million) Analysis and Forecast By Product, 2022 to 2032

        6.3.1. System

        6.3.2. Laser

    6.4. Y-o-Y Growth Trend Analysis By Product, 2017 to 2021

    6.5. Absolute $ Opportunity Analysis By Product, 2022 to 2032

7. Global Market Analysis 2017 to 2021 and Forecast 2022 to 2032, By Application

    7.1. Introduction / Key Findings

    7.2. Historical Market Size Value (US$ Million) Analysis By Application, 2017 to 2021

    7.3. Current and Future Market Size Value (US$ Million) Analysis and Forecast By Application, 2022 to 2032

        7.3.1. Laser Processing

            7.3.1.1. Macro Processing

            7.3.1.2. Micro Processing

            7.3.1.3. Advanced Processing

        7.3.2. Optical Communication

        7.3.3. Optoelectronic Devices

        7.3.4. Others

    7.4. Y-o-Y Growth Trend Analysis By Application, 2017 to 2021

    7.5. Absolute $ Opportunity Analysis By Application, 2022 to 2032

8. Global Market Analysis 2017 to 2021 and Forecast 2022 to 2032, By Vertical

    8.1. Introduction / Key Findings

    8.2. Historical Market Size Value (US$ Million) Analysis By Vertical, 2017 to 2021

    8.3. Current and Future Market Size Value (US$ Million) Analysis and Forecast By Vertical, 2022 to 2032

        8.3.1. Telecommunications

        8.3.2. Industrial

        8.3.3. Semiconductor & Electronics

            8.3.3.1. Memory

            8.3.3.2. Microprocessor

            8.3.3.3. Photonic Integrated Circuit - PIC

        8.3.4. Commercial

        8.3.5. Aerospace & Defense

            8.3.5.1. Aerospace

            8.3.5.2. Missile

            8.3.5.3. Space

            8.3.5.4. Combat Vehicle

            8.3.5.5. Ammunition & Weapon

        8.3.6. Automotive

        8.3.7. Medical

            8.3.7.1. Laser Vision Correction

            8.3.7.2. Confocal Microscope

            8.3.7.3. Optogenetics

        8.3.8. Research

        8.3.9. Others

    8.4. Y-o-Y Growth Trend Analysis By Vertical, 2017 to 2021

    8.5. Absolute $ Opportunity Analysis By Vertical, 2022 to 2032

9. Global Market Analysis 2017 to 2021 and Forecast 2022 to 2032, By Region

    9.1. Introduction

    9.2. Historical Market Size Value (US$ Million) Analysis By Region, 2017 to 2021

    9.3. Current Market Size Value (US$ Million) Analysis and Forecast By Region, 2022 to 2032

        9.3.1. North America

        9.3.2. Latin America

        9.3.3. Europe

        9.3.4. Asia Pacific

        9.3.5. Middle East & Africa

    9.4. Market Attractiveness Analysis By Region

10. North America Market Analysis 2017 to 2021 and Forecast 2022 to 2032, By Country

    10.1. Historical Market Size Value (US$ Million) Trend Analysis By Market Taxonomy, 2017 to 2021

    10.2. Market Size Value (US$ Million) Forecast By Market Taxonomy, 2022 to 2032

        10.2.1. By Country

            10.2.1.1. USA

            10.2.1.2. Canada

        10.2.2. By Type

        10.2.3. By Product

        10.2.4. By Application

        10.2.5. By Vertical

    10.3. Market Attractiveness Analysis

        10.3.1. By Country

        10.3.2. By Type

        10.3.3. By Product

        10.3.4. By Application

        10.3.5. By Vertical

    10.4. Key Takeaways

11. Latin America Market Analysis 2017 to 2021 and Forecast 2022 to 2032, By Country

    11.1. Historical Market Size Value (US$ Million) Trend Analysis By Market Taxonomy, 2017 to 2021

    11.2. Market Size Value (US$ Million) Forecast By Market Taxonomy, 2022 to 2032

        11.2.1. By Country

            11.2.1.1. Brazil

            11.2.1.2. Mexico

            11.2.1.3. Rest of Latin America

        11.2.2. By Type

        11.2.3. By Product

        11.2.4. By Application

        11.2.5. By Vertical

    11.3. Market Attractiveness Analysis

        11.3.1. By Country

        11.3.2. By Type

        11.3.3. By Product

        11.3.4. By Application

        11.3.5. By Vertical

    11.4. Key Takeaways

12. Europe Market Analysis 2017 to 2021 and Forecast 2022 to 2032, By Country

    12.1. Historical Market Size Value (US$ Million) Trend Analysis By Market Taxonomy, 2017 to 2021

    12.2. Market Size Value (US$ Million) Forecast By Market Taxonomy, 2022 to 2032

        12.2.1. By Country

            12.2.1.1. Germany

            12.2.1.2. United Kingdom

            12.2.1.3. France

            12.2.1.4. Spain

            12.2.1.5. Italy

            12.2.1.6. Rest of Europe

        12.2.2. By Type

        12.2.3. By Product

        12.2.4. By Application

        12.2.5. By Vertical

    12.3. Market Attractiveness Analysis

        12.3.1. By Country

        12.3.2. By Type

        12.3.3. By Product

        12.3.4. By Application

        12.3.5. By Vertical

    12.4. Key Takeaways

13. Asia Pacific Market Analysis 2017 to 2021 and Forecast 2022 to 2032, By Country

    13.1. Historical Market Size Value (US$ Million) Trend Analysis By Market Taxonomy, 2017 to 2021

    13.2. Market Size Value (US$ Million) Forecast By Market Taxonomy, 2022 to 2032

        13.2.1. By Country

            13.2.1.1. China

            13.2.1.2. Japan

            13.2.1.3. South Korea

            13.2.1.4. Singapore

            13.2.1.5. Thailand

            13.2.1.6. Indonesia

            13.2.1.7. Australia

            13.2.1.8. New Zealand

            13.2.1.9. Rest of Asia Pacific

        13.2.2. By Type

        13.2.3. By Product

        13.2.4. By Application

        13.2.5. By Vertical

    13.3. Market Attractiveness Analysis

        13.3.1. By Country

        13.3.2. By Type

        13.3.3. By Product

        13.3.4. By Application

        13.3.5. By Vertical

    13.4. Key Takeaways

14. Middle East & Africa Market Analysis 2017 to 2021 and Forecast 2022 to 2032, By Country

    14.1. Historical Market Size Value (US$ Million) Trend Analysis By Market Taxonomy, 2017 to 2021

    14.2. Market Size Value (US$ Million) Forecast By Market Taxonomy, 2022 to 2032

        14.2.1. By Country

            14.2.1.1. GCC Countries

            14.2.1.2. South Africa

            14.2.1.3. Israel

            14.2.1.4. Rest of Middle East & Africa

        14.2.2. By Type

        14.2.3. By Product

        14.2.4. By Application

        14.2.5. By Vertical

    14.3. Market Attractiveness Analysis

        14.3.1. By Country

        14.3.2. By Type

        14.3.3. By Product

        14.3.4. By Application

        14.3.5. By Vertical

    14.4. Key Takeaways

15. Key Countries Market Analysis

    15.1. USA

        15.1.1. Pricing Analysis

        15.1.2. Market Share Analysis, 2022

            15.1.2.1. By Type

            15.1.2.2. By Product

            15.1.2.3. By Application

            15.1.2.4. By Vertical

    15.2. Canada

        15.2.1. Pricing Analysis

        15.2.2. Market Share Analysis, 2022

            15.2.2.1. By Type

            15.2.2.2. By Product

            15.2.2.3. By Application

            15.2.2.4. By Vertical

    15.3. Brazil

        15.3.1. Pricing Analysis

        15.3.2. Market Share Analysis, 2022

            15.3.2.1. By Type

            15.3.2.2. By Product

            15.3.2.3. By Application

            15.3.2.4. By Vertical

    15.4. Mexico

        15.4.1. Pricing Analysis

        15.4.2. Market Share Analysis, 2022

            15.4.2.1. By Type

            15.4.2.2. By Product

            15.4.2.3. By Application

            15.4.2.4. By Vertical

    15.5. Germany

        15.5.1. Pricing Analysis

        15.5.2. Market Share Analysis, 2022

            15.5.2.1. By Type

            15.5.2.2. By Product

            15.5.2.3. By Application

            15.5.2.4. By Vertical

    15.6. United Kingdom

        15.6.1. Pricing Analysis

        15.6.2. Market Share Analysis, 2022

            15.6.2.1. By Type

            15.6.2.2. By Product

            15.6.2.3. By Application

            15.6.2.4. By Vertical

    15.7. France

        15.7.1. Pricing Analysis

        15.7.2. Market Share Analysis, 2022

            15.7.2.1. By Type

            15.7.2.2. By Product

            15.7.2.3. By Application

            15.7.2.4. By Vertical

    15.8. Spain

        15.8.1. Pricing Analysis

        15.8.2. Market Share Analysis, 2022

            15.8.2.1. By Type

            15.8.2.2. By Product

            15.8.2.3. By Application

            15.8.2.4. By Vertical

    15.9. Italy

        15.9.1. Pricing Analysis

        15.9.2. Market Share Analysis, 2022

            15.9.2.1. By Type

            15.9.2.2. By Product

            15.9.2.3. By Application

            15.9.2.4. By Vertical

    15.10. China

        15.10.1. Pricing Analysis

        15.10.2. Market Share Analysis, 2022

            15.10.2.1. By Type

            15.10.2.2. By Product

            15.10.2.3. By Application

            15.10.2.4. By Vertical

    15.11. Japan

        15.11.1. Pricing Analysis

        15.11.2. Market Share Analysis, 2022

            15.11.2.1. By Type

            15.11.2.2. By Product

            15.11.2.3. By Application

            15.11.2.4. By Vertical

    15.12. South Korea

        15.12.1. Pricing Analysis

        15.12.2. Market Share Analysis, 2022

            15.12.2.1. By Type

            15.12.2.2. By Product

            15.12.2.3. By Application

            15.12.2.4. By Vertical

    15.13. Singapore

        15.13.1. Pricing Analysis

        15.13.2. Market Share Analysis, 2022

            15.13.2.1. By Type

            15.13.2.2. By Product

            15.13.2.3. By Application

            15.13.2.4. By Vertical

    15.14. Thailand

        15.14.1. Pricing Analysis

        15.14.2. Market Share Analysis, 2022

            15.14.2.1. By Type

            15.14.2.2. By Product

            15.14.2.3. By Application

            15.14.2.4. By Vertical

    15.15. Indonesia

        15.15.1. Pricing Analysis

        15.15.2. Market Share Analysis, 2022

            15.15.2.1. By Type

            15.15.2.2. By Product

            15.15.2.3. By Application

            15.15.2.4. By Vertical

    15.16. Australia

        15.16.1. Pricing Analysis

        15.16.2. Market Share Analysis, 2022

            15.16.2.1. By Type

            15.16.2.2. By Product

            15.16.2.3. By Application

            15.16.2.4. By Vertical

    15.17. New Zealand

        15.17.1. Pricing Analysis

        15.17.2. Market Share Analysis, 2022

            15.17.2.1. By Type

            15.17.2.2. By Product

            15.17.2.3. By Application

            15.17.2.4. By Vertical

    15.18. GCC Countries

        15.18.1. Pricing Analysis

        15.18.2. Market Share Analysis, 2022

            15.18.2.1. By Type

            15.18.2.2. By Product

            15.18.2.3. By Application

            15.18.2.4. By Vertical

    15.19. South Africa

        15.19.1. Pricing Analysis

        15.19.2. Market Share Analysis, 2022

            15.19.2.1. By Type

            15.19.2.2. By Product

            15.19.2.3. By Application

            15.19.2.4. By Vertical

    15.20. Israel

        15.20.1. Pricing Analysis

        15.20.2. Market Share Analysis, 2022

            15.20.2.1. By Type

            15.20.2.2. By Product

            15.20.2.3. By Application

            15.20.2.4. By Vertical

16. Market Structure Analysis

    16.1. Competition Dashboard

    16.2. Competition Benchmarking

    16.3. Market Share Analysis of Top Players

        16.3.1. By Regional

        16.3.2. By Type

        16.3.3. By Product

        16.3.4. By Application

        16.3.5. By Vertical

17. Competition Analysis

    17.1. Competition Deep Dive

        17.1.1. 600 Group

            17.1.1.1. Overview

            17.1.1.2. Product Portfolio

            17.1.1.3. Profitability by Market Segments

            17.1.1.4. Sales Footprint

            17.1.1.5. Strategy Overview

                17.1.1.5.1. Marketing Strategy

        17.1.2. Bystronic Lasers

            17.1.2.1. Overview

            17.1.2.2. Product Portfolio

            17.1.2.3. Profitability by Market Segments

            17.1.2.4. Sales Footprint

            17.1.2.5. Strategy Overview

                17.1.2.5.1. Marketing Strategy

        17.1.3. Coherent, Inc.

            17.1.3.1. Overview

            17.1.3.2. Product Portfolio

            17.1.3.3. Profitability by Market Segments

            17.1.3.4. Sales Footprint

            17.1.3.5. Strategy Overview

                17.1.3.5.1. Marketing Strategy

        17.1.4. Epilog Laser

            17.1.4.1. Overview

            17.1.4.2. Product Portfolio

            17.1.4.3. Profitability by Market Segments

            17.1.4.4. Sales Footprint

            17.1.4.5. Strategy Overview

                17.1.4.5.1. Marketing Strategy

        17.1.5. Euro Laser

            17.1.5.1. Overview

            17.1.5.2. Product Portfolio

            17.1.5.3. Profitability by Market Segments

            17.1.5.4. Sales Footprint

            17.1.5.5. Strategy Overview

                17.1.5.5.1. Marketing Strategy

        17.1.6. Gravotech

            17.1.6.1. Overview

            17.1.6.2. Product Portfolio

            17.1.6.3. Profitability by Market Segments

            17.1.6.4. Sales Footprint

            17.1.6.5. Strategy Overview

                17.1.6.5.1. Marketing Strategy

        17.1.7. Han's Co., Ltd.

            17.1.7.1. Overview

            17.1.7.2. Product Portfolio

            17.1.7.3. Profitability by Market Segments

            17.1.7.4. Sales Footprint

            17.1.7.5. Strategy Overview

                17.1.7.5.1. Marketing Strategy

        17.1.8. IPG Photonics

            17.1.8.1. Overview

            17.1.8.2. Product Portfolio

            17.1.8.3. Profitability by Market Segments

            17.1.8.4. Sales Footprint

            17.1.8.5. Strategy Overview

                17.1.8.5.1. Marketing Strategy

        17.1.9. Jenoptik

            17.1.9.1. Overview

            17.1.9.2. Product Portfolio

            17.1.9.3. Profitability by Market Segments

            17.1.9.4. Sales Footprint

            17.1.9.5. Strategy Overview

                17.1.9.5.1. Marketing Strategy

        17.1.10. LaserStar

            17.1.10.1. Overview

            17.1.10.2. Product Portfolio

            17.1.10.3. Profitability by Market Segments

            17.1.10.4. Sales Footprint

            17.1.10.5. Strategy Overview

                17.1.10.5.1. Marketing Strategy

18. Assumptions & Acronyms Used

19. Research Methodology

List of Tables

Table 1: Global Market Value (US$ Million) Forecast by Region, 2017 to 2032

Table 2: Global Market Value (US$ Million) Forecast by Type, 2017 to 2032

Table 3: Global Market Value (US$ Million) Forecast by Product, 2017 to 2032

Table 4: Global Market Value (US$ Million) Forecast by Application, 2017 to 2032

Table 5: Global Market Value (US$ Million) Forecast by Vertical, 2017 to 2032

Table 6: North America Market Value (US$ Million) Forecast by Country, 2017 to 2032

Table 7: North America Market Value (US$ Million) Forecast by Type, 2017 to 2032

Table 8: North America Market Value (US$ Million) Forecast by Product, 2017 to 2032

Table 9: North America Market Value (US$ Million) Forecast by Application, 2017 to 2032

Table 10: North America Market Value (US$ Million) Forecast by Vertical, 2017 to 2032

Table 11: Latin America Market Value (US$ Million) Forecast by Country, 2017 to 2032

Table 12: Latin America Market Value (US$ Million) Forecast by Type, 2017 to 2032

Table 13: Latin America Market Value (US$ Million) Forecast by Product, 2017 to 2032

Table 14: Latin America Market Value (US$ Million) Forecast by Application, 2017 to 2032

Table 15: Latin America Market Value (US$ Million) Forecast by Vertical, 2017 to 2032

Table 16: Europe Market Value (US$ Million) Forecast by Country, 2017 to 2032

Table 17: Europe Market Value (US$ Million) Forecast by Type, 2017 to 2032

Table 18: Europe Market Value (US$ Million) Forecast by Product, 2017 to 2032

Table 19: Europe Market Value (US$ Million) Forecast by Application, 2017 to 2032

Table 20: Europe Market Value (US$ Million) Forecast by Vertical, 2017 to 2032

Table 21: Asia Pacific Market Value (US$ Million) Forecast by Country, 2017 to 2032

Table 22: Asia Pacific Market Value (US$ Million) Forecast by Type, 2017 to 2032

Table 23: Asia Pacific Market Value (US$ Million) Forecast by Product, 2017 to 2032

Table 24: Asia Pacific Market Value (US$ Million) Forecast by Application, 2017 to 2032

Table 25: Asia Pacific Market Value (US$ Million) Forecast by Vertical, 2017 to 2032

Table 26: Middle East & Africa Market Value (US$ Million) Forecast by Country, 2017 to 2032

Table 27: Middle East & Africa Market Value (US$ Million) Forecast by Type, 2017 to 2032

Table 28: Middle East & Africa Market Value (US$ Million) Forecast by Product, 2017 to 2032

Table 29: Middle East & Africa Market Value (US$ Million) Forecast by Application, 2017 to 2032

Table 30: Middle East & Africa Market Value (US$ Million) Forecast by Vertical, 2017 to 2032

List of Charts

Figure 1: Global Market Value (US$ Million) by Type, 2022 to 2032

Figure 2: Global Market Value (US$ Million) by Product, 2022 to 2032

Figure 3: Global Market Value (US$ Million) by Application, 2022 to 2032

Figure 4: Global Market Value (US$ Million) by Vertical, 2022 to 2032

Figure 5: Global Market Value (US$ Million) by Region, 2022 to 2032

Figure 6: Global Market Value (US$ Million) Analysis by Region, 2017 to 2032

Figure 7: Global Market Value Share (%) and BPS Analysis by Region, 2022 to 2032

Figure 8: Global Market Y-o-Y Growth (%) Projections by Region, 2022 to 2032

Figure 9: Global Market Value (US$ Million) Analysis by Type, 2017 to 2032

Figure 10: Global Market Value Share (%) and BPS Analysis by Type, 2022 to 2032

Figure 11: Global Market Y-o-Y Growth (%) Projections by Type, 2022 to 2032

Figure 12: Global Market Value (US$ Million) Analysis by Product, 2017 to 2032

Figure 13: Global Market Value Share (%) and BPS Analysis by Product, 2022 to 2032

Figure 14: Global Market Y-o-Y Growth (%) Projections by Product, 2022 to 2032

Figure 15: Global Market Value (US$ Million) Analysis by Application, 2017 to 2032

Figure 16: Global Market Value Share (%) and BPS Analysis by Application, 2022 to 2032

Figure 17: Global Market Y-o-Y Growth (%) Projections by Application, 2022 to 2032

Figure 18: Global Market Value (US$ Million) Analysis by Vertical, 2017 to 2032

Figure 19: Global Market Value Share (%) and BPS Analysis by Vertical, 2022 to 2032

Figure 20: Global Market Y-o-Y Growth (%) Projections by Vertical, 2022 to 2032

Figure 21: Global Market Attractiveness by Type, 2022 to 2032

Figure 22: Global Market Attractiveness by Product, 2022 to 2032

Figure 23: Global Market Attractiveness by Application, 2022 to 2032

Figure 24: Global Market Attractiveness by Vertical, 2022 to 2032

Figure 25: Global Market Attractiveness by Region, 2022 to 2032

Figure 26: North America Market Value (US$ Million) by Type, 2022 to 2032

Figure 27: North America Market Value (US$ Million) by Product, 2022 to 2032

Figure 28: North America Market Value (US$ Million) by Application, 2022 to 2032

Figure 29: North America Market Value (US$ Million) by Vertical, 2022 to 2032

Figure 30: North America Market Value (US$ Million) by Country, 2022 to 2032

Figure 31: North America Market Value (US$ Million) Analysis by Country, 2017 to 2032

Figure 32: North America Market Value Share (%) and BPS Analysis by Country, 2022 to 2032

Figure 33: North America Market Y-o-Y Growth (%) Projections by Country, 2022 to 2032

Figure 34: North America Market Value (US$ Million) Analysis by Type, 2017 to 2032

Figure 35: North America Market Value Share (%) and BPS Analysis by Type, 2022 to 2032

Figure 36: North America Market Y-o-Y Growth (%) Projections by Type, 2022 to 2032

Figure 37: North America Market Value (US$ Million) Analysis by Product, 2017 to 2032

Figure 38: North America Market Value Share (%) and BPS Analysis by Product, 2022 to 2032

Figure 39: North America Market Y-o-Y Growth (%) Projections by Product, 2022 to 2032

Figure 40: North America Market Value (US$ Million) Analysis by Application, 2017 to 2032

Figure 41: North America Market Value Share (%) and BPS Analysis by Application, 2022 to 2032

Figure 42: North America Market Y-o-Y Growth (%) Projections by Application, 2022 to 2032

Figure 43: North America Market Value (US$ Million) Analysis by Vertical, 2017 to 2032

Figure 44: North America Market Value Share (%) and BPS Analysis by Vertical, 2022 to 2032

Figure 45: North America Market Y-o-Y Growth (%) Projections by Vertical, 2022 to 2032

Figure 46: North America Market Attractiveness by Type, 2022 to 2032

Figure 47: North America Market Attractiveness by Product, 2022 to 2032

Figure 48: North America Market Attractiveness by Application, 2022 to 2032

Figure 49: North America Market Attractiveness by Vertical, 2022 to 2032

Figure 50: North America Market Attractiveness by Country, 2022 to 2032

Figure 51: Latin America Market Value (US$ Million) by Type, 2022 to 2032

Figure 52: Latin America Market Value (US$ Million) by Product, 2022 to 2032

Figure 53: Latin America Market Value (US$ Million) by Application, 2022 to 2032

Figure 54: Latin America Market Value (US$ Million) by Vertical, 2022 to 2032

Figure 55: Latin America Market Value (US$ Million) by Country, 2022 to 2032

Figure 56: Latin America Market Value (US$ Million) Analysis by Country, 2017 to 2032

Figure 57: Latin America Market Value Share (%) and BPS Analysis by Country, 2022 to 2032

Figure 58: Latin America Market Y-o-Y Growth (%) Projections by Country, 2022 to 2032

Figure 59: Latin America Market Value (US$ Million) Analysis by Type, 2017 to 2032

Figure 60: Latin America Market Value Share (%) and BPS Analysis by Type, 2022 to 2032

Figure 61: Latin America Market Y-o-Y Growth (%) Projections by Type, 2022 to 2032

Figure 62: Latin America Market Value (US$ Million) Analysis by Product, 2017 to 2032

Figure 63: Latin America Market Value Share (%) and BPS Analysis by Product, 2022 to 2032

Figure 64: Latin America Market Y-o-Y Growth (%) Projections by Product, 2022 to 2032

Figure 65: Latin America Market Value (US$ Million) Analysis by Application, 2017 to 2032

Figure 66: Latin America Market Value Share (%) and BPS Analysis by Application, 2022 to 2032

Figure 67: Latin America Market Y-o-Y Growth (%) Projections by Application, 2022 to 2032

Figure 68: Latin America Market Value (US$ Million) Analysis by Vertical, 2017 to 2032

Figure 69: Latin America Market Value Share (%) and BPS Analysis by Vertical, 2022 to 2032

Figure 70: Latin America Market Y-o-Y Growth (%) Projections by Vertical, 2022 to 2032

Figure 71: Latin America Market Attractiveness by Type, 2022 to 2032

Figure 72: Latin America Market Attractiveness by Product, 2022 to 2032

Figure 73: Latin America Market Attractiveness by Application, 2022 to 2032

Figure 74: Latin America Market Attractiveness by Vertical, 2022 to 2032

Figure 75: Latin America Market Attractiveness by Country, 2022 to 2032

Figure 76: Europe Market Value (US$ Million) by Type, 2022 to 2032

Figure 77: Europe Market Value (US$ Million) by Product, 2022 to 2032

Figure 78: Europe Market Value (US$ Million) by Application, 2022 to 2032

Figure 79: Europe Market Value (US$ Million) by Vertical, 2022 to 2032

Figure 80: Europe Market Value (US$ Million) by Country, 2022 to 2032

Figure 81: Europe Market Value (US$ Million) Analysis by Country, 2017 to 2032

Figure 82: Europe Market Value Share (%) and BPS Analysis by Country, 2022 to 2032

Figure 83: Europe Market Y-o-Y Growth (%) Projections by Country, 2022 to 2032

Figure 84: Europe Market Value (US$ Million) Analysis by Type, 2017 to 2032

Figure 85: Europe Market Value Share (%) and BPS Analysis by Type, 2022 to 2032

Figure 86: Europe Market Y-o-Y Growth (%) Projections by Type, 2022 to 2032

Figure 87: Europe Market Value (US$ Million) Analysis by Product, 2017 to 2032

Figure 88: Europe Market Value Share (%) and BPS Analysis by Product, 2022 to 2032

Figure 89: Europe Market Y-o-Y Growth (%) Projections by Product, 2022 to 2032

Figure 90: Europe Market Value (US$ Million) Analysis by Application, 2017 to 2032

Figure 91: Europe Market Value Share (%) and BPS Analysis by Application, 2022 to 2032

Figure 92: Europe Market Y-o-Y Growth (%) Projections by Application, 2022 to 2032

Figure 93: Europe Market Value (US$ Million) Analysis by Vertical, 2017 to 2032

Figure 94: Europe Market Value Share (%) and BPS Analysis by Vertical, 2022 to 2032

Figure 95: Europe Market Y-o-Y Growth (%) Projections by Vertical, 2022 to 2032

Figure 96: Europe Market Attractiveness by Type, 2022 to 2032

Figure 97: Europe Market Attractiveness by Product, 2022 to 2032

Figure 98: Europe Market Attractiveness by Application, 2022 to 2032

Figure 99: Europe Market Attractiveness by Vertical, 2022 to 2032

Figure 100: Europe Market Attractiveness by Country, 2022 to 2032

Figure 101: Asia Pacific Market Value (US$ Million) by Type, 2022 to 2032

Figure 102: Asia Pacific Market Value (US$ Million) by Product, 2022 to 2032

Figure 103: Asia Pacific Market Value (US$ Million) by Application, 2022 to 2032

Figure 104: Asia Pacific Market Value (US$ Million) by Vertical, 2022 to 2032

Figure 105: Asia Pacific Market Value (US$ Million) by Country, 2022 to 2032

Figure 106: Asia Pacific Market Value (US$ Million) Analysis by Country, 2017 to 2032

Figure 107: Asia Pacific Market Value Share (%) and BPS Analysis by Country, 2022 to 2032

Figure 108: Asia Pacific Market Y-o-Y Growth (%) Projections by Country, 2022 to 2032

Figure 109: Asia Pacific Market Value (US$ Million) Analysis by Type, 2017 to 2032

Figure 110: Asia Pacific Market Value Share (%) and BPS Analysis by Type, 2022 to 2032

Figure 111: Asia Pacific Market Y-o-Y Growth (%) Projections by Type, 2022 to 2032

Figure 112: Asia Pacific Market Value (US$ Million) Analysis by Product, 2017 to 2032

Figure 113: Asia Pacific Market Value Share (%) and BPS Analysis by Product, 2022 to 2032

Figure 114: Asia Pacific Market Y-o-Y Growth (%) Projections by Product, 2022 to 2032

Figure 115: Asia Pacific Market Value (US$ Million) Analysis by Application, 2017 to 2032

Figure 116: Asia Pacific Market Value Share (%) and BPS Analysis by Application, 2022 to 2032

Figure 117: Asia Pacific Market Y-o-Y Growth (%) Projections by Application, 2022 to 2032

Figure 118: Asia Pacific Market Value (US$ Million) Analysis by Vertical, 2017 to 2032

Figure 119: Asia Pacific Market Value Share (%) and BPS Analysis by Vertical, 2022 to 2032

Figure 120: Asia Pacific Market Y-o-Y Growth (%) Projections by Vertical, 2022 to 2032

Figure 121: Asia Pacific Market Attractiveness by Type, 2022 to 2032

Figure 122: Asia Pacific Market Attractiveness by Product, 2022 to 2032

Figure 123: Asia Pacific Market Attractiveness by Application, 2022 to 2032

Figure 124: Asia Pacific Market Attractiveness by Vertical, 2022 to 2032

Figure 125: Asia Pacific Market Attractiveness by Country, 2022 to 2032

Figure 126: Middle East & Africa Market Value (US$ Million) by Type, 2022 to 2032

Figure 127: Middle East & Africa Market Value (US$ Million) by Product, 2022 to 2032

Figure 128: Middle East & Africa Market Value (US$ Million) by Application, 2022 to 2032

Figure 129: Middle East & Africa Market Value (US$ Million) by Vertical, 2022 to 2032

Figure 130: Middle East & Africa Market Value (US$ Million) by Country, 2022 to 2032

Figure 131: Middle East & Africa Market Value (US$ Million) Analysis by Country, 2017 to 2032

Figure 132: Middle East & Africa Market Value Share (%) and BPS Analysis by Country, 2022 to 2032

Figure 133: Middle East & Africa Market Y-o-Y Growth (%) Projections by Country, 2022 to 2032

Figure 134: Middle East & Africa Market Value (US$ Million) Analysis by Type, 2017 to 2032

Figure 135: Middle East & Africa Market Value Share (%) and BPS Analysis by Type, 2022 to 2032

Figure 136: Middle East & Africa Market Y-o-Y Growth (%) Projections by Type, 2022 to 2032

Figure 137: Middle East & Africa Market Value (US$ Million) Analysis by Product, 2017 to 2032

Figure 138: Middle East & Africa Market Value Share (%) and BPS Analysis by Product, 2022 to 2032

Figure 139: Middle East & Africa Market Y-o-Y Growth (%) Projections by Product, 2022 to 2032

Figure 140: Middle East & Africa Market Value (US$ Million) Analysis by Application, 2017 to 2032

Figure 141: Middle East & Africa Market Value Share (%) and BPS Analysis by Application, 2022 to 2032

Figure 142: Middle East & Africa Market Y-o-Y Growth (%) Projections by Application, 2022 to 2032

Figure 143: Middle East & Africa Market Value (US$ Million) Analysis by Vertical, 2017 to 2032

Figure 144: Middle East & Africa Market Value Share (%) and BPS Analysis by Vertical, 2022 to 2032

Figure 145: Middle East & Africa Market Y-o-Y Growth (%) Projections by Vertical, 2022 to 2032

Figure 146: Middle East & Africa Market Attractiveness by Type, 2022 to 2032

Figure 147: Middle East & Africa Market Attractiveness by Product, 2022 to 2032

Figure 148: Middle East & Africa Market Attractiveness by Application, 2022 to 2032

Figure 149: Middle East & Africa Market Attractiveness by Vertical, 2022 to 2032

Figure 150: Middle East & Africa Market Attractiveness by Country, 2022 to 2032

Recommendations

Technology

Sensor Fusion Market

Published : June 2023

Technology

Mobile Laser Scanning Market

Published : January 2023

Technology

Safety Laser Scanner Market

Published : July 2022

Explore Technology Insights

View Reports