The laser welding industry stands at the threshold of a decade-long expansion trajectory that promises to reshape precision joining technology, automated manufacturing solutions, and advanced welding applications. The market's journey from USD 2.9 billion in 2025 to USD 4.2 billion by 2035 represents substantial growth, demonstrating the accelerating adoption of advanced laser configurations and fiber optic technology across automotive, metal fabrication, electronics, and aerospace sectors.
The first half of the decade (2025-2030) will witness the market climbing from USD 2.9 billion to approximately USD 3.5 billion, adding USD 0.6 billion in value, which constitutes 45% of the total forecast growth period. This phase will be characterized by the rapid adoption of fiber laser welding systems, driven by increasing electric vehicle battery manufacturing requirements and the growing need for high-performance precision joining equipment worldwide. Advanced single-mode fiber capabilities and automated quality monitoring systems will become standard expectations rather than premium options.
The latter half (2030-2035) will witness sustained growth from USD 3.5 billion to USD 4.2 billion, representing an addition of USD 0.7 billion or 55% of the decade's expansion. This period will be defined by mass market penetration of specialized remote laser welding systems, integration with comprehensive Industry 4.0 platforms, and seamless compatibility with existing manufacturing infrastructure. The market trajectory signals fundamental shifts in how manufacturers approach production efficiency optimization and weld quality management, with participants positioned to benefit from sustained demand across multiple laser types and industrial application segments.
Equipment integration challenges emerge when laser welding systems must coordinate with robotic handling equipment while maintaining beam alignment precision throughout complex motion profiles. Process control becomes complicated when real-time monitoring systems generate extensive data streams that require immediate analysis to prevent weld defects, yet processing capabilities often lag behind data generation rates. Quality assurance departments struggle with validation procedures when visual inspection methods cannot adequately assess internal weld characteristics that determine long-term joint reliability.
Power management infrastructure becomes increasingly complex when high-power laser systems require specialized electrical distribution and cooling systems that often exceed existing facility capabilities. Utilities coordination challenges surface when power quality fluctuations affect laser stability while facilities must balance energy consumption optimization against consistent weld penetration requirements. Maintenance scheduling creates operational difficulties when laser component replacements demand specialized technicians with limited availability while production schedules allow minimal downtime windows.
Regulatory compliance documentation expands when aerospace and medical applications demand extensive process validation and traceability records that require detailed parameter logging and statistical process control implementation. Quality system maintenance creates administrative burdens when multiple industry standards require parallel documentation approaches and periodic recertification audits that consume significant engineering resources within this rapidly advancing manufacturing technology market.
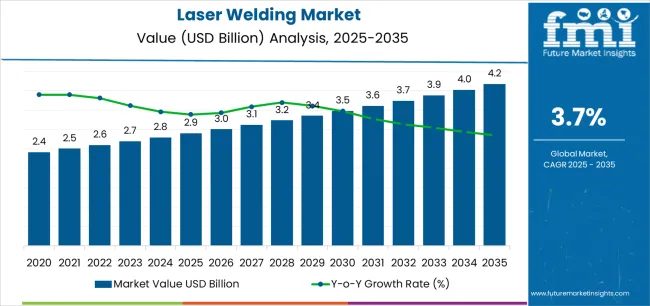
The market demonstrates distinct growth phases with varying market characteristics and competitive dynamics. Between 2025 and 2030, the market progresses through its electrification transition phase, expanding from USD 2.9 billion to USD 3.5 billion with steady annual increments averaging 3.7% growth. This period showcases the transition from conventional resistance and arc welding to advanced fiber laser systems with enhanced beam quality and integrated process monitoring becoming mainstream features.
The 2025-2030 phase adds USD 0.6 billion to market value, representing 45% of total decade expansion. Market maturation factors include standardization of fiber laser protocols, declining component costs for high-brightness laser sources, and increasing industry awareness of productivity benefits reaching 40-50% cycle time reduction in automotive body-in-white applications. Competitive landscape evolution during this period features established laser manufacturers like IPG Photonics and TRUMPF expanding their fiber laser portfolios while specialty manufacturers focus on advanced beam shaping development and enhanced copper welding capabilities.
From 2030 to 2035, market dynamics shift toward advanced automation integration and global manufacturing expansion, with growth continuing from USD 3.5 billion to USD 4.2 billion, adding USD 0.7 billion or 55% of total expansion. This phase transition centers on fully integrated robotic welding cells, compatibility with comprehensive manufacturing execution systems, and deployment across diverse industrial and precision assembly scenarios, becoming standard rather than specialized applications. The competitive environment matures with focus shifting from basic welding capability to comprehensive quality assurance systems and integration with predictive maintenance platforms.
| Metric | Value |
|---|---|
| Market Value (2025) | USD 2.9 billion |
| Market Forecast (2035) | USD 4.2 billion |
| Growth Rate | 3.7% CAGR |
| Leading Technology | Fiber Laser Product Type |
| Primary End Use | Automotive Industry Segment |
The market demonstrates strong fundamentals with fiber laser systems capturing a dominant share through advanced beam quality and operational efficiency capabilities. Automotive applications drive primary demand, supported by increasing electric vehicle production and body-in-white manufacturing technology requirements. Geographic expansion remains concentrated in developed manufacturing regions with established automotive infrastructure, while emerging economies show accelerating adoption rates driven by production localization and rising quality standards.
Market expansion rests on three fundamental shifts driving adoption across the automotive, electronics, and metal fabrication sectors. First, electric vehicle production acceleration creates compelling joining advantages through laser welding that provides precise battery cell connections without excessive heat input, enabling manufacturers to achieve reliable electrical contacts while maintaining structural integrity and reducing thermal stress on sensitive components. Second, manufacturing automation advancement worldwide as industrial facilities seek advanced robotic welding systems that replace manual processes, enabling productivity enhancement and quality consistency that align with Industry 4.0 standards and labor optimization objectives.
Third, lightweight material adoption drives uptake from automotive and aerospace manufacturers requiring effective dissimilar metal joining solutions that address aluminum-to-steel connections while maintaining structural performance during multi-material assembly and weight reduction initiatives. The growth faces headwinds from capital investment barriers that vary across small manufacturers regarding the procurement of advanced fiber laser systems and robotic integration, which may limit adoption in price-sensitive fabrication environments. Technical complexity also persists regarding process parameter optimization and copper material welding that may reduce effectiveness in battery manufacturing and electrical applications, which affect production yield and quality assurance.
The market represents a specialized yet critical manufacturing opportunity driven by expanding electric vehicle production, industrial automation advancement, and the need for superior joint quality in diverse precision applications. As manufacturers worldwide seek to achieve 40-50% productivity improvement, reduce defect rates by 60-70%, and integrate advanced process monitoring with quality management systems, laser welding is evolving from niche precision technology to mainstream joining solutions ensuring manufacturing excellence and operational efficiency.
The market's growth trajectory from USD 2.9 billion in 2025 to USD 4.2 billion by 2035 at a 3.7% CAGR reflects fundamental shifts in automotive electrification requirements and automation optimization. Geographic expansion opportunities are particularly pronounced in Asia Pacific manufacturing hubs, while the dominance of fiber laser systems (48.6% market share) and automotive applications (34.2% share) provides clear strategic focus areas.
Strengthening the dominant fiber laser segment (48.6% market share) through enhanced single-mode beam configurations (58.0% of fiber laser), superior brightness capability, and automated parameter control systems. This pathway focuses on optimizing beam delivery technology, improving copper welding capability, extending equipment effectiveness to battery manufacturing applications, and developing specialized systems for diverse industrial requirements. Market leadership consolidation through photonics engineering and process monitoring integration enables premium positioning while defending competitive advantages against solid-state alternatives. Expected revenue pool: USD 50-65 million
Rapid electric vehicle production growth and manufacturing localization across Asia Pacific creates substantial opportunities through regional service network development and application engineering support. Growing automotive supplier base and battery manufacturing investment drive sustained demand for precision welding systems. Regional market strategies enhance parts availability, enable faster technical support, and position companies advantageously for OEM qualification programs while accessing growing industrial markets. Expected revenue pool: USD 45-60 million
Expansion within the dominant automotive segment (34.2% market share) through specialized equipment addressing battery pack assembly (38.0% of automotive) and e-powertrain manufacturing requirements. This pathway encompasses battery cell tab welding, housing seam joining, and compatibility with diverse battery chemistry assembly workflows. Premium positioning reflects superior process stability and comprehensive quality validation supporting modern electric vehicle production. Expected revenue pool: USD 40-52 million
Strategic advancement in remote laser welding (55.0% of spot & seam welding) requires enhanced scanner speed capabilities and specialized programming addressing body-in-white assembly requirements. This pathway addresses rapid positioning capability, multi-seam processing, and adaptive focus control with advanced optical systems. Premium pricing reflects cycle time reduction and operational flexibility through programmable beam delivery. Expected revenue pool: USD 35-45 million
Development of accessible laser welding systems for metal fabrication segment (15.0% market share) addressing contract manufacturing and small-batch production requirements. This pathway encompasses handheld laser welding, portable systems, and simplified programming for diverse material and thickness applications. Technology differentiation through user-friendly interfaces enables market expansion while reducing traditional capital and skill barriers facing fabrication shops. Expected revenue pool: USD 30-40 million
Expansion targeting electronics manufacturing (12.0% market share) through specialized micro-welding equipment for semiconductor packaging, connector assembly, and precision component joining. This pathway encompasses pulse control optimization, vision system integration, and specialized fixturing for micro-scale applications. Market development through process capability validation enables differentiated positioning while accessing high-mix low-volume electronics requiring precision joining. Expected revenue pool: USD 25-33 million
Development of comprehensive in-process monitoring systems addressing zero-defect manufacturing and real-time quality validation requirements across laser welding installations. This pathway encompasses coaxial monitoring, acoustic emission sensing, and comprehensive data analytics platforms. Premium positioning reflects quality assurance advancement and total cost of ownership optimization while enabling access to automotive Tier-1 suppliers requiring 100% inspection capability. Expected revenue pool: USD 22-28 million
Primary Classification: The market segments by product type into Fiber Laser, Solid-State Laser, CO₂ Laser, and Others categories, representing the evolution from conventional gas lasers to advanced fiber optic solutions for comprehensive industrial welding optimization.
Secondary Classification: End-use industry segmentation divides the market into Automotive, Metal Fabrication, Electronics, Transportation, Energy, Aerospace, Communications, Medical Devices, and Others, reflecting distinct requirements for precision joining, production volume, and quality standards.
Tertiary Classification: Welding process segmentation encompasses Spot & Seam Welding, Scanner Welding, Tube Welding, Profile Welding, and Deposit/Cladding, representing diverse joining techniques for manufacturing applications.
Regional Classification: Geographic distribution covers Asia Pacific, North America, Europe, Latin America, Africa, and the Middle East, with developed automotive markets leading technology adoption while emerging economies show accelerating growth patterns driven by manufacturing localization programs.
The segmentation structure reveals technology progression from conventional CO₂ lasers toward advanced fiber laser systems with enhanced beam quality and process monitoring capabilities, while application diversity spans from high-volume automotive production to specialized medical device assembly requiring comprehensive precision welding solutions.
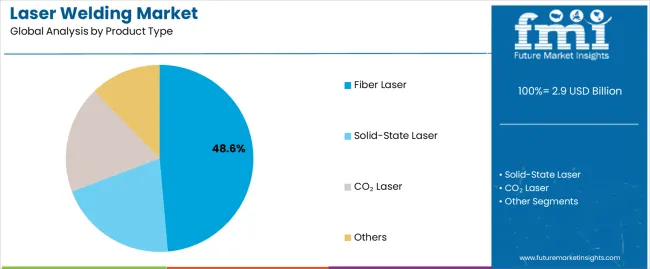
Market Position: Fiber laser systems command the leading position in the laser welding market with approximately 48.6% market share through advanced beam quality features, including superior brightness, efficient electrical-to-optical conversion, and operational flexibility that enable manufacturers to achieve optimal weld quality across diverse material and thickness applications.
Value Drivers: The segment benefits from manufacturer preference for maintenance-free laser sources that provide consistent beam characteristics, reduced operating costs, and integration flexibility without requiring gas supplies or extensive cooling infrastructure. Advanced single-mode fiber lasers (58.0% of fiber laser segment) enable precise micro-welding and deep penetration capability through high beam parameter product, where beam quality and reliability represent critical manufacturing requirements.
Competitive Advantages: Fiber laser systems differentiate through proven uptime reliability, optimal operational cost ratios, and integration with robotic automation that enhance production capability while maintaining total cost of ownership suitable for diverse industrial applications and high-volume manufacturing.
Key market characteristics:
Solid-state laser systems maintain 22.4% market share due to their proven high-power capability for thick material welding and industrial applications. CO₂ lasers capture 18.0% share through deep penetration welding, non-metallic material processing, and established installation base in legacy manufacturing facilities. Other laser technologies demonstrate 11.0% adoption including disk lasers, diode lasers, and specialized hybrid systems for niche applications.
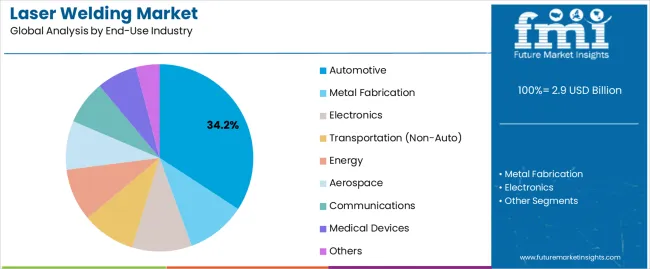
Market Context: Automotive applications dominate the laser welding market with approximately 34.2% market share due to widespread adoption of body-in-white assembly technology and increasing focus on electric vehicle battery manufacturing, e-powertrain production, and lightweight material joining applications that maximize structural performance while maintaining production efficiency standards.
Appeal Factors: Automotive manufacturers prioritize cycle time reduction, zero-defect quality capability, and integration with robotic production lines that enable coordinated assembly operations across multiple welding stations. The segment benefits from substantial electric vehicle investment and battery manufacturing capacity expansion that emphasize laser welding adoption for battery cell tab connections (38.0% of automotive segment), housing seam welding, and busbar joining applications.
Growth Drivers: Electric vehicle platform launches incorporate laser welding as essential technology for battery pack assembly, hairpin stator welding, and aluminum-intensive body structure joining, while body-in-white modernization (34.0% of automotive) increases demand for remote laser welding capabilities that comply with production rate requirements and optimize fixture utilization.
Market Challenges: Varying material combinations and thickness requirements may necessitate process optimization across different vehicle platforms and production scenarios.
Application dynamics include:
Metal fabrication maintains 15.0% market share through contract manufacturing, structural steel fabrication, and job shop applications requiring flexible welding capability. Electronics capture 12.0% share via semiconductor packaging, connector assembly, and precision component joining for consumer devices. Transportation non-automotive accounts for 9.0% through rail vehicle manufacturing, shipbuilding, and aerospace applications requiring high-quality structural welds.
Growth Accelerators: Electric vehicle production acceleration drives primary adoption as laser welding provides precise battery cell connections and aluminum body structure joining that enable automotive manufacturers to achieve reliable electrical performance and structural integrity without excessive heat input, supporting range optimization and safety compliance that align with electrification timelines and regulatory standards. Manufacturing automation investment demand accelerates market expansion as facilities seek robotic laser welding cells that eliminate manual arc welding while maintaining productivity standards during Industry 4.0 transformation and labor optimization initiatives. Lightweight material adoption spending increases worldwide, creating sustained demand for dissimilar metal joining equipment that complements aluminum-to-steel connections, magnesium component integration, and multi-material assembly processes providing structural effectiveness in weight-sensitive applications.
Growth Inhibitors: Capital cost barriers vary across small fabrication shops regarding the procurement of fiber laser systems and robotic integration, which may limit market penetration in price-sensitive manufacturing environments or regions with lower automation investment capacity. Process complexity persists regarding copper material welding and parameter optimization that may reduce effectiveness in battery tab applications, electrical busbar joining, or operations requiring consistent performance across reflective materials, affecting production yield and quality consistency. Market fragmentation across multiple laser wavelengths and process specifications creates compatibility concerns between different equipment suppliers and existing manufacturing infrastructure.
Market Evolution Patterns: Adoption accelerates in automotive Tier-1 suppliers and large manufacturing facilities where quality and productivity benefits justify laser welding investments, with geographic concentration in automotive production regions transitioning toward mainstream adoption in metal fabrication sectors driven by equipment cost reduction and handheld system availability. Technology development focuses on enhanced copper welding capability through blue and green laser wavelengths, improved process monitoring with coaxial sensing, and integration with manufacturing execution systems enabling comprehensive production data analytics. The market could face disruption if alternative joining technologies including solid-state welding or advanced adhesive bonding significantly address applications currently dominated by laser welding, though the industry's fundamental need for precise non-contact joining continues to make laser technology essential in advanced manufacturing.
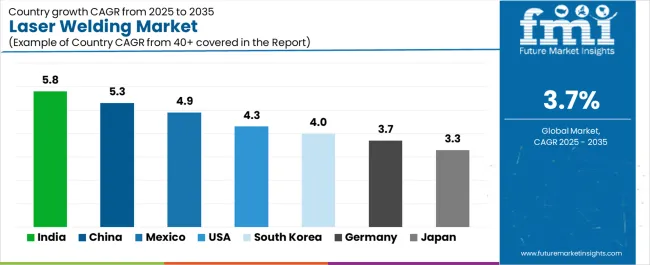
The laser welding market demonstrates varied regional dynamics with Growth Leaders including India (5.8% CAGR) and China (5.3% CAGR) driving expansion through electric vehicle manufacturing incentives and automation investment programs. Emerging Markets encompass Mexico (4.9% CAGR) benefiting from automotive near-shoring and manufacturing localization. Technology Adopters feature the United States (4.3% CAGR), South Korea (4.0% CAGR), and Germany (3.7% CAGR), supported by EV platform launches and Industry 4.0 integration. Mature Markets include Japan (3.3% CAGR), where precision electronics and medical device manufacturing support consistent growth patterns.
| Country | CAGR (2025-2035) |
|---|---|
| India | 5.8% |
| China | 5.3% |
| Mexico | 4.9% |
| United States | 4.3% |
| South Korea | 4.0% |
| Germany | 3.7% |
| Japan | 3.3% |
Regional synthesis reveals Asia Pacific markets leading adoption through electric vehicle battery manufacturing and automotive supplier development, while North American countries maintain robust growth supported by manufacturing reshoring and automation retrofits. European markets show steady expansion driven by premium automotive production and Industry 4.0 compliance requirements.
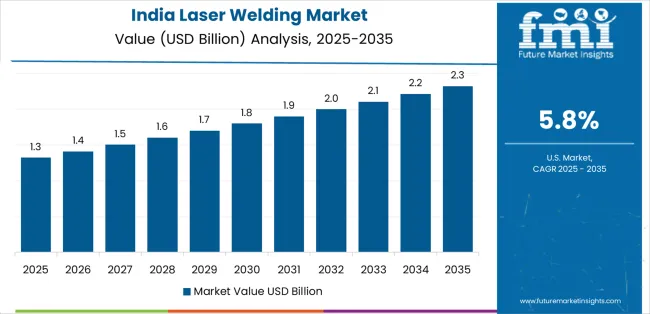
India leads growth momentum with a 5.8% CAGR, driven by electric vehicle manufacturing incentives through PLI schemes, growth in metal fabrication and railway manufacturing, and battery pack localization across automotive hubs including Pune, Chennai, Gujarat, and NCR Delhi. Government Production Linked Incentive programs for electric vehicles and advanced chemistry cell manufacturing drive laser welding adoption for battery assembly operations, while expanding automotive supplier base requires precision joining capability. Railway infrastructure investment including metro rail and high-speed corridor development creates industrial welding demand for vehicle manufacturing and track system fabrication.
The convergence of automotive electrification requiring battery manufacturing capability, government incentive programs supporting domestic production, and industrial infrastructure investment positions India as a key growth market for laser welding. Two-wheeler electrification and commercial vehicle battery integration create diverse application opportunities, while metal fabrication sector modernization drives equipment upgrades from conventional welding to laser technology supporting export competitiveness.
Performance Metrics:
The Chinese market emphasizes extensive electric vehicle battery production with documented adoption effectiveness in cell manufacturing, pack assembly, and renewable energy applications through integration with automated production lines and quality control systems. The country leverages manufacturing scale and government industrial policy to maintain strong market presence at 5.3% CAGR. Battery manufacturing hubs including Jiangsu, Guangdong, Fujian, and Sichuan provinces showcase extensive installations where laser welding systems integrate with comprehensive battery assembly platforms and automotive supply chains to optimize production throughput and quality consistency. Chinese manufacturers prioritize high-speed welding capability, automation integration, and competitive pricing that create demand for domestically produced and international systems meeting production volume requirements. The market benefits from government new energy vehicle policies, renewable energy infrastructure investment, and industrial upgrading initiatives that emphasize advanced manufacturing technology adoption.
Electric vehicle battery manufacturers including CATL, BYD, and CALB drive substantial laser welding procurement for gigafactory-scale production facilities. Automotive OEMs implementing body-in-white automation and aluminum-intensive platform transitions require advanced remote laser welding systems for production line integration.
Market Intelligence Brief:
Mexico's expanding automotive market demonstrates substantial laser welding deployment with documented operational effectiveness in supply chain near-shoring and manufacturing localization through integration with North American OEM production networks at 4.9% CAGR. The country leverages proximity to USA market and trade agreement advantages to attract automotive and industrial investment requiring advanced manufacturing technology. Automotive component manufacturing including body panels, chassis assemblies, and battery pack production for electric vehicle platforms drives laser welding demand supporting OEM production in United States and Canada. Appliance manufacturing and metal fabrication export sectors utilize laser welding for stainless steel component assembly and precision joining applications.
Near-shoring initiatives by automotive suppliers relocating from Asia to North America create manufacturing capacity investment including laser welding system installations. Free trade agreement advantages under USMCA support automotive content requirements driving local manufacturing and technology adoption.
Strategic Market Indicators:
The USA market emphasizes automotive manufacturing retooling with documented effectiveness in electric vehicle platform transitions, aerospace production recovery, and automation retrofits through integration with robotic systems and quality monitoring at 4.3% CAGR. American automotive manufacturers prioritize laser welding for aluminum-intensive body structures, battery pack assembly, and e-powertrain manufacturing supporting EV platform launches from Detroit Three and transplant facilities. Aerospace sector recovery including commercial aircraft backlog production and defense programs drives precision welding demand for aluminum and titanium airframe assemblies. Industrial automation retrofits replace aging resistance welding equipment with fiber laser systems improving productivity and quality capability.
Automotive OEM investment exceeding USD 100 billion in electric vehicle production capacity through 2030 creates sustained laser welding demand for battery manufacturing and body shop modernization. Aerospace manufacturers including Boeing and suppliers ramp production supporting post-pandemic demand recovery.
Strategic Development Indicators:
South Korea demonstrates advanced adoption at 4.0% CAGR characterized by electronics manufacturing precision welding, e-mobility component production, and high-brightness fiber laser deployment for battery cell and tab welding applications. The Korean market focuses on secondary battery manufacturing where precision laser welding addresses cylindrical and prismatic cell tab connections, busbar assemblies, and pack-level electrical joining for electric vehicle and energy storage applications. Electronics manufacturing including semiconductor packaging, connector assembly, and consumer device component joining requires micro-welding capability with precise heat control. Automotive component suppliers produce e-powertrain systems including hairpin stator welding for traction motors requiring high-brightness fiber lasers.
Battery manufacturers including LG Energy Solution, Samsung SDI, and SK On drive substantial laser welding investment for domestic and overseas production facilities. Electronics companies require precision welding for 5G infrastructure components, smartphone assemblies, and advanced packaging applications.
Performance Metrics:
Germany maintains steady expansion at 3.7% CAGR through premium automotive body-in-white production, powertrain electrification manufacturing, and Industry 4.0 integration of quality monitoring and process data systems. German automotive manufacturers emphasize laser welding for aluminum body structures, roof seam welding, and multi-material joining supporting lightweight vehicle design and structural performance requirements. Electric vehicle platform development including battery housing production and e-motor stator welding drives fiber laser adoption with process monitoring integration. Industry 4.0 initiatives incorporate closed-loop quality control, real-time process monitoring, and manufacturing execution system integration enabling comprehensive production data analytics and predictive maintenance.
Premium automotive brands including Mercedes-Benz, BMW, and Audi implement advanced laser welding technology for body shop automation and e-mobility component production. Tier-1 suppliers including Bosch and Continental require precision welding for powertrain and battery system manufacturing.
Market Characteristics:
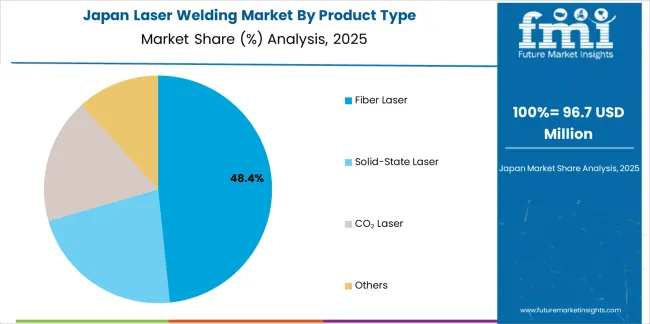
Japan demonstrates specialized market presence at 3.3% CAGR through precision electronics manufacturing, medical device micro-welding, and compact factory retrofits emphasizing quality and automation. The Japanese market focuses on high-precision applications where micro-welding addresses semiconductor packaging, connector assembly, and miniature component joining for consumer electronics and industrial sensors. Medical device manufacturing requires precision welding for surgical instruments, implantable devices, and diagnostic equipment assemblies with stringent quality and biocompatibility standards. Compact manufacturing facilities in urban locations utilize space-efficient robotic laser welding cells maximizing automation in constrained footprints.
Electronics manufacturers including component suppliers and assembly operations drive precision laser welding demand for miniaturization trends. Medical device companies require validated processes meeting regulatory standards for implantable and surgical product manufacturing.
Market Development Factors:
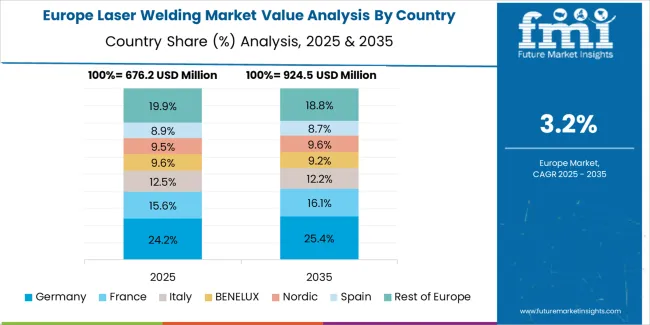
The laser welding market in Europe is projected to grow from USD 0.9 billion in 2025 to USD 1.3 billion by 2035, registering a CAGR of approximately 3.6% over the forecast period. Europe accounts for 31.0% of global laser welding revenues in 2025. Within Europe, Germany maintains leadership with a 27.0% share supported by premium automotive body-in-white production lines, powertrain electrification including battery modules and hairpin stator welding, and Industry 4.0 integration of closed-loop quality monitoring systems.
Italy follows with a 14.0% share driven by automotive component manufacturing, metal fabrication exports, and machinery production requiring precision joining capabilities. United Kingdom holds a 13.0% share supported by aerospace manufacturing, automotive Tier-1 suppliers, and advanced engineering sectors. France commands a 12.0% share through automotive production, aerospace programs, and energy sector applications. The Nordic countries collectively represent 8.0% with strong adoption in automotive suppliers, industrial automation, and offshore energy equipment manufacturing. Spain accounts for 7.0% share reflecting automotive component production and metal fabrication sector activity. Central & Eastern Europe holds 11.0% driven by automotive manufacturing expansion, foreign direct investment in production facilities, and supplier base development supporting Western European OEMs. Rest of Europe represents 8.0% share across diverse manufacturing sectors and regional industrial clusters.
The European market mix is anchored by premium automotive body-in-white assembly lines, powertrain electrification manufacturing including battery modules and e-motor hairpin welding, and high-specification metal fabrication operations. The region demonstrates strong adoption of fiber laser technology, closed-loop process monitoring systems, and robotic welding cells reflecting advanced automation and quality standards requirements across automotive and industrial manufacturing sectors.
Japan demonstrates advanced market development characterized by precision electronics micro-welding, medical device manufacturing, and compact factory automation that emphasize quality control, process validation, and space-efficient production systems. The Japanese market focuses on high-precision joining applications where laser welding addresses semiconductor packaging, miniature connector assembly, and sensor manufacturing for automotive electronics and industrial automation. Equipment procurement emphasizes reliability, precision control, and comprehensive process validation that align with Japanese manufacturing standards and zero-defect quality expectations. The market benefits from domestic laser manufacturers including Amada and Panasonic maintaining technology development capabilities and comprehensive service networks, while international premium brands appeal to automotive and medical device segments requiring advanced beam quality and process monitoring features.
Market Development Factors:
South Korea demonstrates sophisticated market characteristics focused on secondary battery manufacturing, electronics precision welding, and e-mobility component production reflecting technology leadership and manufacturing excellence. The Korean market emphasizes battery cell tab welding where high-brightness fiber lasers address copper and aluminum conductor joining for cylindrical, prismatic, and pouch cell formats supporting electric vehicle and energy storage applications. Electronics manufacturing operations utilize laser micro-welding for semiconductor advanced packaging, 5G component assembly, and consumer device production requiring precision and throughput. Automotive component suppliers produce e-powertrain systems including hairpin stator welding for traction motors and power electronics assembly.
Strategic Development Indicators:
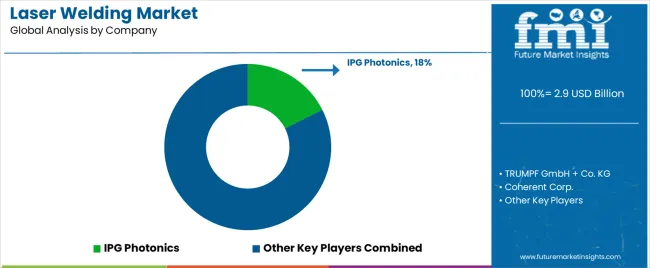
The Laser Welding Market is expanding as manufacturers pursue high-precision joining technologies that improve production speed, reduce thermal distortion, and support automation. Demand is rising across automotive lightweighting, battery and EV component manufacturing, aerospace assembly, medical device fabrication, and precision electronics. Laser welding’s ability to produce narrow, clean weld seams with minimal finishing makes it a preferred alternative to arc and resistance welding, especially when working with thin metals, dissimilar alloys, and heat-sensitive components. The market is also benefiting from the integration of robotics, vision-based seam tracking, and real-time process monitoring.
IPG Photonics and TRUMPF GmbH + Co. KG lead in high-power fiber and disk laser systems used in large-scale industrial welding cells and automated production lines. Coherent Corp. and Han’s Laser Technology Industry Group Co., Ltd. supply versatile laser welding platforms that serve electronics, automotive components, and precision mechanical parts production. Laserline GmbH continues to advance high-brightness diode lasers for applications that require large weld spots and deep penetration.
Amada Weld Tech and Emerson Electric Co. (Branson) focus on micro-joining and precision welding for medical devices, sensors, and fine mechanical assemblies. FANUC Corporation and Panasonic Welding Systems integrate laser welding directly with robotic arms, enabling flexible, high-speed automated stations. Jenoptik AG provides turnkey laser processing solutions and quality monitoring tools for industry lines requiring repeatable weld performance. As electrification, automation, and lightweight engineering accelerate, laser welding is becoming a central technology in advanced manufacturing workflows.
| Item | Value |
|---|---|
| Quantitative Units | USD 2.9 billion |
| Product Type | Fiber Laser (Single-Mode, Multi-Mode), Solid-State Laser, CO₂ Laser, Others |
| End-Use Industry | Automotive (EV Battery & E-Powertrain, Body-in-White & Closures, Conventional Powertrain & Exhaust), Metal Fabrication, Electronics, Transportation (Non-Auto), Energy, Aerospace, Communications, Medical Devices, Others |
| Welding Process | Spot & Seam Welding (Remote Laser Welding, Conduction/Keyhole Seam), Scanner Welding, Tube Welding, Profile Welding, Deposit/Cladding |
| Regions Covered | Asia Pacific, North America, Europe, Latin America, Africa, Middle East |
| Countries Covered | India, China, Mexico, United States, South Korea, Germany, Japan, and 25+ additional countries |
| Key Companies Profiled | IPG Photonics, TRUMPF GmbH + Co. KG, Coherent Corp., Han’s Laser Technology Industry Group Co., Ltd., Laserline GmbH, Amada Weld Tech, Emerson Electric Co. (Branson), FANUC Corporation, Panasonic Welding Systems, and Jenoptik AG |
| Additional Attributes | Dollar sales by product type, end-use industry, and welding process categories, regional adoption trends across Asia Pacific, North America, and Europe, competitive landscape with laser manufacturers and beam delivery system suppliers, manufacturer preferences for beam quality and process monitoring, integration with robotic platforms and quality assurance systems, innovations in high-brightness fiber configurations and copper welding capabilities, and development of Industry 4.0 solutions with enhanced automation and manufacturing optimization capabilities. |
The global laser welding market is estimated to be valued at USD 2.9 billion in 2025.
The market size for the laser welding market is projected to reach USD 4.2 billion by 2035.
The laser welding market is expected to grow at a 3.7% CAGR between 2025 and 2035.
The key product types in laser welding market are fiber laser , solid-state laser, co₂ laser and others.
In terms of end-use industry, automotive segment to command 34.2% share in the laser welding market in 2025.


Our Research Products

The "Full Research Suite" delivers actionable market intel, deep dives on markets or technologies, so clients act faster, cut risk, and unlock growth.

The Leaderboard benchmarks and ranks top vendors, classifying them as Established Leaders, Leading Challengers, or Disruptors & Challengers.

Locates where complements amplify value and substitutes erode it, forecasting net impact by horizon

We deliver granular, decision-grade intel: market sizing, 5-year forecasts, pricing, adoption, usage, revenue, and operational KPIs—plus competitor tracking, regulation, and value chains—across 60 countries broadly.

Spot the shifts before they hit your P&L. We track inflection points, adoption curves, pricing moves, and ecosystem plays to show where demand is heading, why it is changing, and what to do next across high-growth markets and disruptive tech

Real-time reads of user behavior. We track shifting priorities, perceptions of today’s and next-gen services, and provider experience, then pace how fast tech moves from trial to adoption, blending buyer, consumer, and channel inputs with social signals (#WhySwitch, #UX).

Partner with our analyst team to build a custom report designed around your business priorities. From analysing market trends to assessing competitors or crafting bespoke datasets, we tailor insights to your needs.
Supplier Intelligence
Discovery & Profiling
Capacity & Footprint
Performance & Risk
Compliance & Governance
Commercial Readiness
Who Supplies Whom
Scorecards & Shortlists
Playbooks & Docs
Category Intelligence
Definition & Scope
Demand & Use Cases
Cost Drivers
Market Structure
Supply Chain Map
Trade & Policy
Operating Norms
Deliverables
Buyer Intelligence
Account Basics
Spend & Scope
Procurement Model
Vendor Requirements
Terms & Policies
Entry Strategy
Pain Points & Triggers
Outputs
Pricing Analysis
Benchmarks
Trends
Should-Cost
Indexation
Landed Cost
Commercial Terms
Deliverables
Brand Analysis
Positioning & Value Prop
Share & Presence
Customer Evidence
Go-to-Market
Digital & Reputation
Compliance & Trust
KPIs & Gaps
Outputs
Full Research Suite comprises of:
Market outlook & trends analysis
Interviews & case studies
Strategic recommendations
Vendor profiles & capabilities analysis
5-year forecasts
8 regions and 60+ country-level data splits
Market segment data splits
12 months of continuous data updates
DELIVERED AS:
PDF EXCEL ONLINE
Laser Welding Equipment Market Forecast and Outlook 2025 to 2035
Laser Welding Machine Market Size and Share Forecast Outlook 2025 to 2035
Laser Frequency Splitting and Mode Competition Teaching Instrument Market Size and Share Forecast Outlook 2025 to 2035
Laser Component Analyzer Market Size and Share Forecast Outlook 2025 to 2035
Welding Electrodes and Rods Market Size and Share Forecast Outlook 2025 to 2035
Laser-Assisted Smart Lathes Market Size and Share Forecast Outlook 2025 to 2035
Welding Filler Metal Market Size and Share Forecast Outlook 2025 to 2035
Laser Drilling Equipment Market Size and Share Forecast Outlook 2025 to 2035
Laser Transverse Mode Teaching Instrument Market Forecast and Outlook 2025 to 2035
Laser Ablation Systems Market Size and Share Forecast Outlook 2025 to 2035
Laser Measurement Integrating Sphere Market Size and Share Forecast Outlook 2025 to 2035
Laser Safety Cloths Market Size and Share Forecast Outlook 2025 to 2035
Laser Dazzler Market Size and Share Forecast Outlook 2025 to 2035
Laser Cable Marking Market Size and Share Forecast Outlook 2025 to 2035
Laser Cladding Market Size and Share Forecast Outlook 2025 to 2035
Laser Marking Equipment Market Size and Share Forecast Outlook 2025 to 2035
Laser Cutting Machines Market Size and Share Forecast Outlook 2025 to 2035
Welding Fume Extraction Equipment Market Size and Share Forecast Outlook 2025 to 2035
Laser Wire Marking Systems Market Size and Share Forecast Outlook 2025 to 2035
Laser Photomask Market Size and Share Forecast Outlook 2025 to 2035

Thank you!
You will receive an email from our Business Development Manager. Please be sure to check your SPAM/JUNK folder too.
Chat With
MaRIA