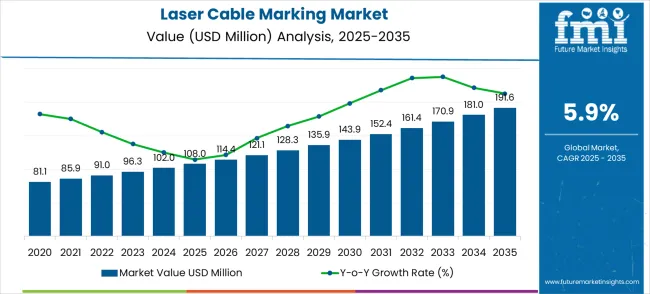
The global laser cable marking market is projected to grow from USD 108.0 million in 2025 to approximately USD 191.6 million by 2035, recording an absolute increase of USD 83.6 million over the forecast period. This translates into a total growth of 77.4%, with the market forecast to expand at a compound annual growth rate (CAGR) of 5.9% between 2025 and 2035. The overall market size is expected to grow by nearly 1.77X during the same period, supported by the rising adoption of precision marking technologies in cable manufacturing and increasing demand for permanent identification solutions in industrial applications.
| Metric | Value |
|---|---|
| Market Value (2025) | USD 108 million |
| Market Forecast Value (2035) | USD 191.6 million |
| Forecast CAGR (2025-2035) | 5.9% |
Between 2025 and 2030, the Laser Cable Marking market is projected to expand from USD 108.0 million to USD 143.9 million, resulting in a value increase of USD 35.9 million, which represents 42.9% of the total forecast growth for the decade. This phase of growth will be shaped by rising adoption of automated marking systems in cable manufacturing, increasing focus on traceability requirements in industrial applications, and growing awareness among manufacturers about the importance of permanent cable identification. Equipment manufacturers are expanding their marking capabilities to address the growing complexity of modern cable production systems.
From 2030 to 2035, the market is forecast to grow from USD 143.9 million to USD 191.6 million, adding another USD 47.7 million, which constitutes 57.1% of the overall ten-year expansion. This period is expected to be characterized by expansion of high-speed laser marking technologies, integration of AI-enabled quality control systems, and development of standardized marking protocols across different cable manufacturers. The growing adoption of smart manufacturing and Industry 4.0 technologies will drive demand for more sophisticated marking solutions and specialized technical expertise.
Between 2020 and 2025, the Laser Cable Marking market experienced steady expansion, driven by increasing automation in cable manufacturing and growing awareness of traceability requirements in industrial applications. The market developed as cable manufacturers recognized the need for permanent marking solutions to ensure product identification and compliance with regulatory standards. Industrial companies and aerospace manufacturers began emphasizing accurate cable marking to improve maintenance efficiency and ensure system reliability.
Market expansion is being supported by the rapid increase in cable manufacturing worldwide and the corresponding need for precise identification marking in various applications. Modern cable production relies on accurate marking systems to ensure proper identification, traceability, and compliance with industry standards. Even minor improvements in marking quality can result in significant cost savings and operational efficiency improvements throughout the cable lifecycle.
The growing complexity of industrial systems and increasing regulatory requirements are driving demand for professional marking solutions from certified providers with appropriate equipment and technical expertise. Manufacturing companies are increasingly requiring permanent marking documentation for quality control and compliance purposes. Regulatory requirements and industry specifications are establishing standardized marking procedures that require specialized laser systems and trained operators.
The market is segmented by process, application, and region. By process, the market is divided into laser engraving, laser etching, and others. Based on application, the market is categorized into industrial, medical industry, defense, aerospace, and others. Regionally, the market is divided into North America, Europe, East Asia, South Asia & Pacific, Latin America, and Middle East & Africa.
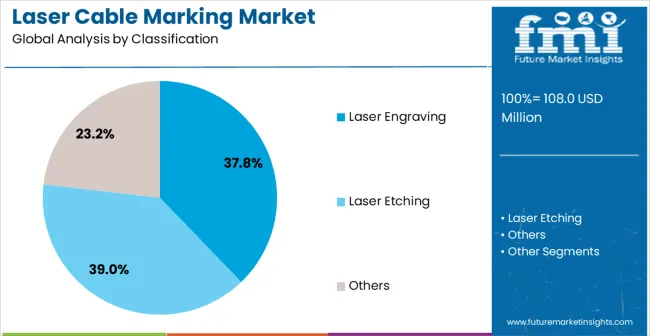
The laser engraving process is projected to capture 37.8% of the global laser cable marking market in 2025, maintaining its leading position. This dominance is largely driven by the technology’s ability to deliver permanent, high-precision markings on a wide range of cable types, including PVC, Teflon, and polyurethane. Laser engraving provides excellent readability, durability, and long-term traceability, making it suitable for critical applications in industrial, aerospace, automotive, and energy sectors. The process eliminates the need for consumables such as ink or labels, lowering operational costs and minimizing maintenance requirements. Advances in fiber and CO₂ laser technologies have enhanced marking speed, precision, and automation compatibility, allowing integration into high-volume production lines. A well-established supplier ecosystem, offering compact and industrial-scale equipment, further supports adoption. As industries scale operations and regulatory compliance requirements grow, laser engraving is expected to sustain its market dominance across diverse manufacturing and infrastructure applications.
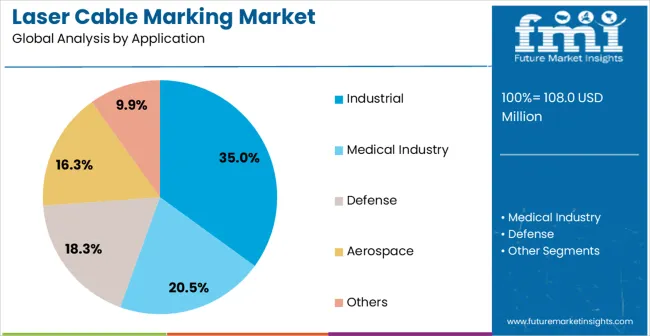
The industrial segment is expected to represent 35% of laser cable marking demand in 2025, making it the largest application sector. Growth is driven by adoption across manufacturing, automation, and energy industries, where complex cable networks require durable, legible markings for safety, installation, and maintenance purposes. Industrial operations often involve harsh environments with chemical exposure, high temperatures, and abrasion, where laser-engraved markings provide reliable performance. Regulatory mandates and industry standards for traceability, documentation, and safety further reinforce demand in this segment. Companies increasingly integrate automated marking systems into production and assembly lines to reduce human error, streamline operations, and improve maintenance efficiency. Awareness of operational benefits such as faster troubleshooting, minimized downtime, and improved compliance is driving adoption across industrial facilities. As cable networks grow more complex and manufacturing operations expand, demand for high-quality laser cable marking solutions will continue to rise, ensuring sustained growth for the industrial segment.
The Laser Cable Marking market is advancing steadily due to increasing automation adoption and growing recognition of permanent marking importance. However, the market faces challenges including high equipment costs, need for continuous training on new marking technologies, and varying marking requirements across different cable manufacturers. Standardization efforts and certification programs continue to influence marking quality and market development patterns.
The growing deployment of high-speed laser marking systems is enabling rapid cable processing across manufacturing operations. Advanced units equipped with precision laser systems provide improved throughput and reduced processing time for cable manufacturers while expanding production capability reach. These technologies are particularly valuable for high-volume manufacturers and automated production lines that require continuous cable marking without operational delays.
Modern marking system providers are incorporating artificial intelligence and automated quality inspection that improve accuracy and reduce operational overhead. Integration of real-time quality monitoring and automated verification systems enables more precise marking control and comprehensive production documentation. Advanced AI systems also support integration of next-generation manufacturing technologies including predictive maintenance and automated quality assurance.
| Country | CAGR (2025–2035) |
|---|---|
| China | 8.0% |
| India | 7.4% |
| Germany | 6.8% |
| Brazil | 6.2% |
| United States | 5.6% |
| United Kingdom | 5.0% |
| Japan | 4.4% |
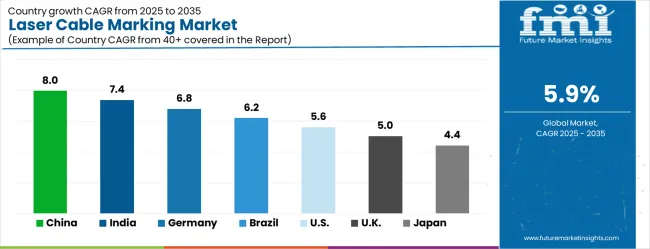
The laser cable marking market is growing robustly across major economies, with China leading at an 8.0% CAGR through 2035, driven by rapid industrial expansion, government manufacturing mandates, and expanding cable production networks. India follows at 7.4%, supported by rising manufacturing activity in electronics and telecommunications infrastructure development. Germany grows at 6.8%, emphasizing technological innovation, quality standards, and advanced manufacturing integration. Brazil records 6.2%, integrating marking solutions into its established industrial manufacturing sector. The USA shows growth at 5.6%, focusing on aerospace and defense applications with standardized marking procedures. The UK demonstrates 5.0% growth, while Japan records 4.4%, both emphasizing precision and reliability in manufacturing operations.
The report covers an in-depth analysis of 40+ countries top-performing countries are highlighted below.
Revenue from laser cable marking in China is projected to grow at a CAGR of 8.0% through 2035, driven by rapid industrial expansion and rising adoption of automated marking technologies in cable production facilities. The electronics manufacturing and telecommunications sectors are creating significant demand for precise, traceable cable identification solutions. Government modernization programs mandate certified marking systems, while industrial automation initiatives facilitate operator training and advanced facility capabilities. Major cable manufacturers and marking system providers are expanding production networks across industrial zones to meet growing demand. Combined initiatives are improving operational efficiency, quality compliance, and traceability, supporting long-term adoption of laser marking technology across multiple manufacturing sectors.
Revenue from laser cable marking in India is projected to expand at a CAGR of 7.4% through 2035, supported by electronics manufacturing growth and expanding infrastructure projects. The increasing demand for precise cable identification in telecommunications and industrial applications is driving adoption of professional-grade marking solutions. Authorized dealers and system providers are establishing capabilities to serve the growing population of cable manufacturing facilities. Industrial development programs promote operator training, standardized workflows, and compliance with international quality standards. Combined with workforce skill development initiatives, these factors are enabling widespread implementation of advanced marking technologies across emerging industrial hubs, improving production traceability, operational efficiency, and long-term market growth.
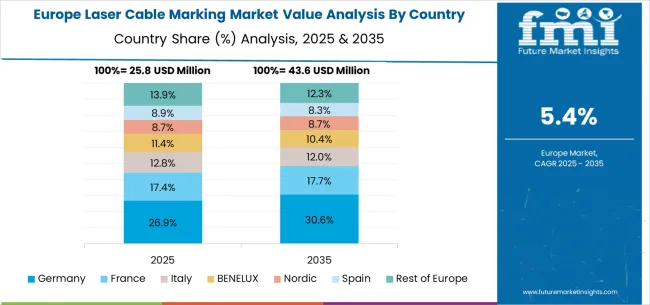
Demand for laser cable marking in Germany is projected to grow at a CAGR of 6.8% through 2035, supported by the country’s precision manufacturing and technological innovation focus. German cable manufacturers are adopting laser marking systems to meet strict quality and regulatory standards. Investments in high-precision technologies improve efficiency, reduce errors, and ensure traceable documentation. Professional certification programs equip operators with technical expertise, enabling support for diverse cable types and manufacturing requirements. Integration with smart factory and industrial automation systems further enhances operational reliability. The market emphasizes accurate, standardized marking processes and efficiency, fostering long-term adoption of laser cable marking systems across multiple industrial sectors.
Revenue from laser cable marking in Brazil is projected to grow at a CAGR of 6.2% through 2035, driven by industrial modernization and recognition of permanent marking importance in cable production. Manufacturing sectors including electronics, automotive, and industrial cabling are adopting precision marking systems to meet modern production requirements. Companies are investing in professional-grade equipment, operator training, and quality management programs. Industrial initiatives enhance traceability, reduce errors, and maintain compliance with local and international standards. Workforce skill development and rising awareness of operational efficiency are supporting adoption across Brazil’s industrial regions, ensuring reliable cable identification, production quality, and long-term market growth in the manufacturing sector.
Revenue from laser cable marking in the USA is projected to grow at a CAGR of 5.6% through 2035, driven by aerospace, defense, and industrial applications requiring precise cable identification. Large manufacturers and cable producers are integrating laser marking solutions to ensure permanent traceability and documentation compliance. Industry standards and government regulations further drive technology adoption. Professional training and certification programs develop specialized technical expertise among operators. Combined with integration of automated marking technologies with manufacturing execution systems, these factors improve operational efficiency, accuracy, and quality compliance, supporting long-term adoption across aerospace, defense, and industrial manufacturing sectors.
Revenue from laser cable marking in the UK is projected to grow at a CAGR of 5.0% through 2035, supported by precision manufacturing and adherence to quality standards. Cable manufacturers are implementing laser marking systems for traceability, efficiency, and regulatory compliance. Industrial modernization and automation initiatives support operator training and technical expertise development. Advanced marking technology adoption reduces errors, improves operational efficiency, and ensures compliance with national and international standards. Demand is fueled by electronics, aerospace, and telecommunications applications requiring reliable identification, documentation, and process standardization, ensuring long-term growth in the British industrial and manufacturing sectors.
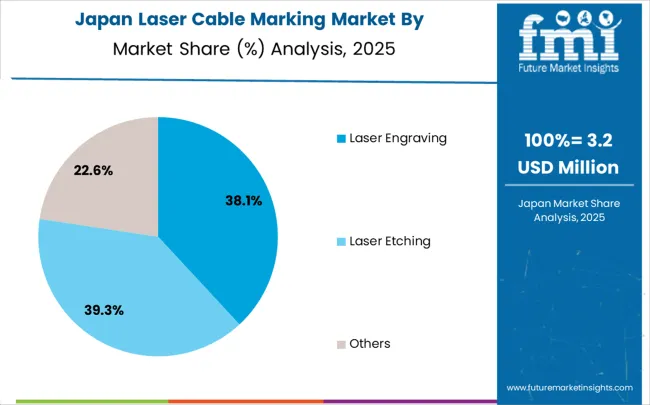
Revenue from laser cable marking in Japan is projected to grow at a CAGR of 4.4% through 2035, driven by electronics manufacturing and demand for precise cable identification. Japanese manufacturers are integrating laser marking solutions into automotive and industrial electronics production to improve operational efficiency, traceability, and compliance. Industrial modernization initiatives facilitate standardized workflows and workforce skill development. Operator training programs and technical development initiatives enhance expertise in advanced marking technologies. Adoption of precision marking systems supports smart manufacturing, quality standards, and documentation compliance, sustaining long-term market growth across Japan’s technologically advanced industrial sectors.
The laser cable marking market is defined by competition among specialized marking system providers, cable manufacturing equipment companies, and industrial automation suppliers. Companies are investing in advanced laser technologies, high-speed marking solutions, standardized integration procedures, and technical training to deliver precise, reliable, and cost-effective marking solutions. Strategic partnerships, technological innovation, and geographic expansion are central to strengthening product portfolios and market presence.
Komax Group offers comprehensive cable marking solutions with a focus on precision, automation, and manufacturing integration. WireMasters provides specialized marking systems integrated with cable processing equipment. HeatSign delivers technologically advanced marking services with standardized procedures and quality control integration. Schleuniger emphasizes precision marking and comprehensive technical support for cable manufacturing operations.
Canwest Aerospace offers marking solutions specialized for aerospace and defense applications. Cord Master provides marking systems integrated into cable assembly and processing operations. ConexSmart delivers advanced marking technologies with automated quality verification systems. ELFON LTD, BAE Systems Filton, Ionix Systems, Amphenol Corporation, IMA Tech Wiring, CarlisleIT, Celltron, TYKMA Electrox, Videojet Technologies, and Gravotech offer specialized marking expertise, standardized integration procedures, and system reliability across global and regional manufacturing networks.
| Item | Value |
|---|---|
| Quantitative Units | USD 108 million |
| Process | Laser Engraving, Laser Etching, and Others |
| Application | Industrial, Medical Industry, Defense, Aerospace, and Others |
| Regions Covered | North America, Europe, East Asia, South Asia & Pacific, Latin America, Middle East & Africa |
| Country Covered | China, India, Germany, Brazil, United States, United Kingdom, Japan |
| Key Companies Profiled | Komax Group, WireMasters, HeatSign, Schleuniger, Canwest Aerospace, Cord Master, ConexSmart, ELFON LTD, BAE Systems Filton, Ionix Systems, Amphenol Corporation, IMA Tech Wiring, CarlisleIT, Celltron, TYKMA Electrox, Videojet Technologies, Gravotech |
| Additional Attributes | Dollar sales by process and application, regional demand trends across Asia-Pacific, Europe, and North America, competitive landscape with established equipment manufacturers and specialized marking providers, manufacturer preferences for integrated versus standalone marking systems, integration with Industry 4.0 manufacturing platforms, innovations in high-speed laser technology and automated quality control capabilities, and adoption of smart marking solutions with embedded monitoring systems and real-time verification features for enhanced manufacturing efficiency. |
The global laser cable marking market is estimated to be valued at USD 108.0 million in 2025.
The market size for the laser cable marking market is projected to reach USD 191.6 million by 2035.
The laser cable marking market is expected to grow at a 5.9% CAGR between 2025 and 2035.
The key product types in laser cable marking market are laser engraving, laser etching and others.
In terms of application, industrial segment to command 35.0% share in the laser cable marking market in 2025.


Our Research Products

The "Full Research Suite" delivers actionable market intel, deep dives on markets or technologies, so clients act faster, cut risk, and unlock growth.

The Leaderboard benchmarks and ranks top vendors, classifying them as Established Leaders, Leading Challengers, or Disruptors & Challengers.

Locates where complements amplify value and substitutes erode it, forecasting net impact by horizon

We deliver granular, decision-grade intel: market sizing, 5-year forecasts, pricing, adoption, usage, revenue, and operational KPIs—plus competitor tracking, regulation, and value chains—across 60 countries broadly.

Spot the shifts before they hit your P&L. We track inflection points, adoption curves, pricing moves, and ecosystem plays to show where demand is heading, why it is changing, and what to do next across high-growth markets and disruptive tech

Real-time reads of user behavior. We track shifting priorities, perceptions of today’s and next-gen services, and provider experience, then pace how fast tech moves from trial to adoption, blending buyer, consumer, and channel inputs with social signals (#WhySwitch, #UX).

Partner with our analyst team to build a custom report designed around your business priorities. From analysing market trends to assessing competitors or crafting bespoke datasets, we tailor insights to your needs.
Supplier Intelligence
Discovery & Profiling
Capacity & Footprint
Performance & Risk
Compliance & Governance
Commercial Readiness
Who Supplies Whom
Scorecards & Shortlists
Playbooks & Docs
Category Intelligence
Definition & Scope
Demand & Use Cases
Cost Drivers
Market Structure
Supply Chain Map
Trade & Policy
Operating Norms
Deliverables
Buyer Intelligence
Account Basics
Spend & Scope
Procurement Model
Vendor Requirements
Terms & Policies
Entry Strategy
Pain Points & Triggers
Outputs
Pricing Analysis
Benchmarks
Trends
Should-Cost
Indexation
Landed Cost
Commercial Terms
Deliverables
Brand Analysis
Positioning & Value Prop
Share & Presence
Customer Evidence
Go-to-Market
Digital & Reputation
Compliance & Trust
KPIs & Gaps
Outputs
Full Research Suite comprises of:
Market outlook & trends analysis
Interviews & case studies
Strategic recommendations
Vendor profiles & capabilities analysis
5-year forecasts
8 regions and 60+ country-level data splits
Market segment data splits
12 months of continuous data updates
DELIVERED AS:
PDF EXCEL ONLINE
Laser Frequency Splitting and Mode Competition Teaching Instrument Market Size and Share Forecast Outlook 2025 to 2035
Laser Component Analyzer Market Size and Share Forecast Outlook 2025 to 2035
Laser-Assisted Smart Lathes Market Size and Share Forecast Outlook 2025 to 2035
Laser Drilling Equipment Market Size and Share Forecast Outlook 2025 to 2035
Laser Transverse Mode Teaching Instrument Market Forecast and Outlook 2025 to 2035
Laser Welding Equipment Market Forecast and Outlook 2025 to 2035
Laser Welding Market Size and Share Forecast Outlook 2025 to 2035
Laser Ablation Systems Market Size and Share Forecast Outlook 2025 to 2035
Laser Measurement Integrating Sphere Market Size and Share Forecast Outlook 2025 to 2035
Laser Safety Cloths Market Size and Share Forecast Outlook 2025 to 2035
Laser Dazzler Market Size and Share Forecast Outlook 2025 to 2035
Laser Cladding Market Size and Share Forecast Outlook 2025 to 2035
Laser Cutting Machines Market Size and Share Forecast Outlook 2025 to 2035
Laser Photomask Market Size and Share Forecast Outlook 2025 to 2035
Laser Measuring Instrument Market Size and Share Forecast Outlook 2025 to 2035
Laser Welding Machine Market Size and Share Forecast Outlook 2025 to 2035
Laser Technology Market Size and Share Forecast Outlook 2025 to 2035
Laser Interferometer Market Size and Share Forecast Outlook 2025 to 2035
The Laser Therapy Devices Market is segmented by Device Type and End User from 2025 to 2035
Laser Safety Glasses Market Growth – Trends & Forecast 2025 to 2035

Thank you!
You will receive an email from our Business Development Manager. Please be sure to check your SPAM/JUNK folder too.
Chat With
MaRIA