Laser Component Analyzer Market Forecast and Outlook 2025 to 2035

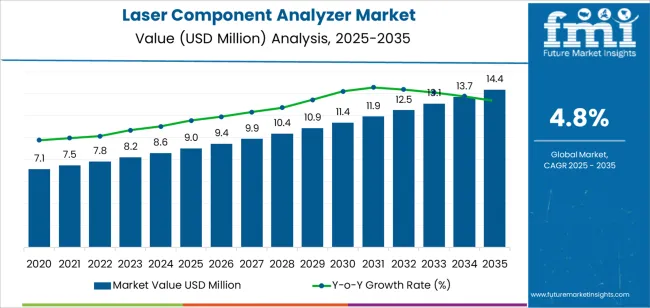
The laser component analyzer market is valued at USD 9.0 million in 2025 and is projected to reach USD 14.4 million by 2035, growing at a CAGR of 4.8% over the assessment period. Growth is driven by rising demand for precise, real-time particle size measurement in pharmaceutical formulation development, nanomaterials characterization, and industrial quality control workflows. Increasing reliance on particle size distribution data for evaluating product performance characteristics, dissolution behavior, viscosity control, and stability has positioned laser-based analyzers as indispensable analytical tools across research and production environments.

Compared to traditional microscopy and sieve-based measurement methods, laser analyzers deliver faster analysis time, a broader measurable size range from nanoscale to millimeter scale particles, and consistent repeatability across sample types, accelerating formulation cycles and reducing analytical turnaround times by up to 40–60%. Between 2025 and 2030, adoption will expand in pharmaceutical R&D and materials research laboratories, supported by integration with automated sampling systems and laboratory information management platforms. From 2030 to 2035, uptake will increase across industrial manufacturing and real-time process monitoring lines as companies pursue continuous production models and data-centric quality programs. Portable units will account for the dominant device share due to operational flexibility, multi-site deployment efficiency, and lower capital costs relative to desktop research-grade analyzers. Asia Pacific will lead global growth, anchored by China and India’s expanding research ecosystem, while Europe and North America sustain adoption through regulatory-driven quality assurance requirements. LANSCIENCE, Hefei Jinxing, Thermo Fisher Scientific, Anton Paar, and Malvern Panalytical remain key players shaping technology capability, performance benchmarks, and application support services.
Quick Stats for Laser Component Analyzer Market

  • Laser Component Analyzer Market Value (2025): USD 9.0 million
  • Laser Component Analyzer Market Forecast Value (2035): USD 14.4 million
  • Laser Component Analyzer Market Forecast CAGR: 4.8%
  • Leading Device Type in Laser Component Analyzer Market: Portable
  • Key Growth Regions in Laser Component Analyzer Market: Asia Pacific, Europe, and North America
  • Top Key Players in Laser Component Analyzer Market: LANSCIENCE, Hefei Jinxing Intelligent Control Technology Co., Ltd., Thermo Fisher Scientific, Anton Paar GmbH, Beckman Coulter, TSI Incorporated, Malvern Panalytical Ltd, Microtrac

Laser Component Analyzer Market Market Value Analysis

The market demonstrates strong momentum across developed and emerging research economies, where analytical laboratories are transitioning from conventional particle sizing methods to advanced laser-based systems that offer superior measurement range characteristics. Laser component analyzer technology addresses critical analytical challenges including broad particle size distribution measurement spanning nanometers to millimeters in single analyses, high-throughput sample processing in pharmaceutical batch release testing, and non-destructive measurement capability across diverse material types and suspension media.

The pharmaceutical sector's shift toward nanomedicine formulations and complex drug delivery systems creates steady demand for analytical solutions capable of characterizing submicron particles, evaluating suspension stability, and monitoring crystallization processes with minimal sample preparation and consistent measurement output. Materials research laboratories are adopting laser component analyzers for powder characterization where particle size distribution directly impacts material properties and processing behavior requirements. The technology's ability to provide rapid multimodal distribution analysis with excellent resolution reduces method development time and accelerates research workflows.

Industrial quality control departments and contract testing laboratories are investing in laser component analyzer systems to enhance analytical capabilities through improved measurement speed and expanded size range coverage. The integration of advanced optical configurations and optimized scattering detection geometries enables these instruments to achieve measurement ranges from 10 nanometers to 3500 micrometers while maintaining measurement precision. The initial capital investment requirements for research-grade analytical systems and technical expertise barriers for optimal method development may pose challenges to market expansion in budget-constrained research facilities and regions with limited access to applications support resources.

Laser Component Analyzer Market Year-over-Year Forecast (2025-2035)

Between 2025 and 2030, the market is projected to expand from USD 9.0 million to USD 23.0 million, resulting in a value increase of USD 14.0 million, which represents 44.7% of the total forecast growth for the decade. This phase of development will be shaped by rising demand for particle characterization solutions in pharmaceutical and materials science sectors, product innovation in laser optics technology and detection systems, as well as expanding integration with automated laboratory platforms and quality management systems. Companies are establishing competitive positions through investment in advanced optical designs, measurement algorithm development, and strategic market expansion across pharmaceutical quality control laboratories, materials research facilities, and industrial process monitoring applications.

From 2030 to 2035, the market is forecast to grow from USD 23.0 million to USD 14.4 million, adding another USD 17.3 million, which constitutes 55.3% of the overall ten-year expansion. This period is expected to be characterized by the expansion of specialized analytical systems, including multi-wavelength laser configurations and integrated imaging capabilities tailored for specific particle types and measurement applications, strategic collaborations between analytical instrument manufacturers and pharmaceutical companies, and an enhanced focus on measurement automation and data integrity compliance. The growing focus on pharmaceutical quality by design and advanced materials development will drive demand for advanced, high-performance laser component analyzer solutions across diverse research and industrial applications.

Laser Component Analyzer Market Key Takeaways

Metric Value
Market Value (2025) USD 9.0 million
Market Forecast Value (2035) USD 14.4 million
Forecast CAGR (2025-2035) 4.8%

Why is the Laser Component Analyzer Market Growing?

The laser component analyzer market grows by enabling researchers to achieve superior measurement accuracy and analytical throughput while reducing sample preparation time in particle characterization applications. Research laboratories face mounting pressure to improve analytical productivity and data quality, with laser component analyzer systems typically providing 40-60% time reduction over conventional microscopy methods, making these specialized instruments essential for competitive pharmaceutical development and materials research operations. The pharmaceutical and materials science industries' need for precise particle size distribution data creates demand for advanced laser analyzer solutions that can measure broad size ranges, achieve excellent resolution in multimodal distributions, and ensure consistent measurement repeatability across diverse sample types and concentration ranges.

Laboratory automation initiatives promoting integrated analytical workflows drive adoption in pharmaceutical quality control, materials characterization, and industrial process monitoring applications, where particle analysis efficiency has a direct impact on product development timelines and manufacturing costs. The global shift toward quality by design principles and nanomaterials research accelerates laser component analyzer demand as analytical laboratories seek instrumentation that minimizes operator influence and maximizes measurement consistency. Limited awareness of optimal measurement protocols and higher initial instrument costs compared to basic particle sizing equipment may limit adoption rates among smaller research groups and regions with traditional analytical practices and limited technical support infrastructure.

What factors drive the dominance of the portable device type and scientific research application segments in the laser component analyzer market?

The market is segmented by device type, application, and region. By device type, the market is divided into portable and desktop. Based on application, the market is categorized into scientific research, industrial manufacturing, and other. Regionally, the market is divided into Asia Pacific, Europe, North America, Latin America, and Middle East & Africa.
By Device Type, the Portable Segment Accounts for a Dominant Market Share

Laser Component Analyzer Market Analysis By Device Type

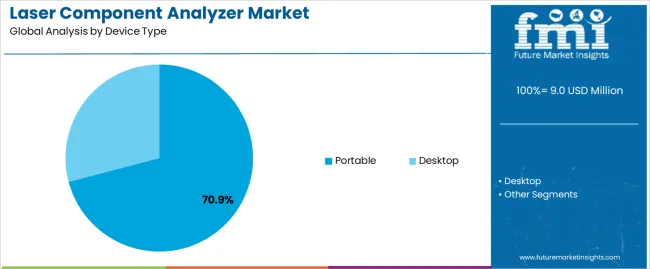
The portable segment represents the dominant force in the market, capturing approximately 70.9% of total market share in 2025. This advanced category encompasses handheld configurations, battery-powered field units, and compact benchtop variants optimized for on-site measurement applications, delivering convenient particle analysis capabilities and flexible deployment options in diverse testing environments. The portable segment's market leadership stems from its operational flexibility enabling at-line process monitoring, reduced footprint requirements facilitating laboratory space optimization, and cost-effective solutions suitable for research groups with multiple sampling locations across manufacturing facilities.

The desktop segment maintains a substantial 29.1% market share, serving research laboratories who require maximum measurement performance through sophisticated optical systems, extended size range capabilities, and advanced software features that support comprehensive particle characterization in controlled laboratory environments.

Key advantages driving the portable segment include:
  • Operational convenience enabling rapid measurements at production locations with minimal sample transport and reduced analysis turnaround times
  • Proven versatility across diverse sampling environments including manufacturing floors, field testing sites, and multiple laboratory locations
  • Simplified maintenance requirements with integrated optical alignment and automated calibration verification systems
  • Lower capital investment facilitating deployment of multiple units across distributed research or production facilities

By Application, the Scientific Research Segment Accounts for the Largest Market Share

Laser Component Analyzer Market Analysis By Application

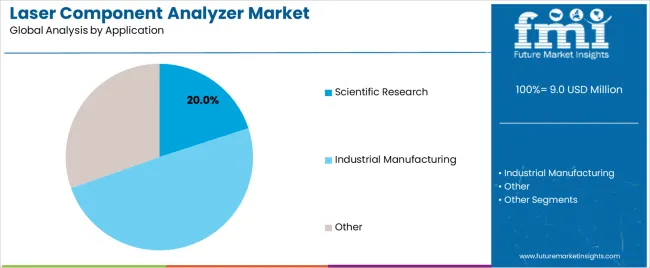
Scientific research applications dominate the market with approximately 20.0% market share in 2025, reflecting the extensive adoption of laser particle sizing solutions across pharmaceutical development laboratories, materials science research centers, and academic analytical facilities. The scientific research segment's market leadership is reinforced by widespread implementation in drug formulation development, nanomaterials characterization, and polymer science research, which provide essential particle size data and distribution analysis in exploratory research and formulation optimization studies.

The industrial manufacturing segment represents 20.9% market share through specialized applications including production quality control, batch release testing, and process monitoring operations. Other applications constitute 59.1% market share, encompassing environmental monitoring, food and beverage analysis, cosmetics development, and specialized industrial particle characterization requirements.

Key market dynamics supporting application preferences include:

  • Scientific research operations requiring precise particle size distribution data with comprehensive statistical analysis and method validation documentation
  • Industrial manufacturing applications demanding rapid measurement throughput and consistent quality verification for production batch release decisions
  • Pharmaceutical development emphasizing formulation optimization and stability assessment through detailed particle characterization and morphology evaluation
  • Growing adoption across biotechnology applications seeking particle analysis solutions for protein aggregation monitoring and biopharmaceutical product development

What are the Drivers, Restraints, and Key Trends of the Laser Component Analyzer Market?

The market is driven by three concrete demand factors tied to analytical quality and research productivity outcomes. First, pharmaceutical industry expansion creates increasing requirements for particle characterization instruments, with global pharmaceutical research spending exceeding 200 billion USD annually in major markets worldwide, requiring reliable laser component analyzer systems for drug formulation development, quality control testing, and stability assessment programs. Second, nanomaterials research growth and advanced materials development requirements drive adoption of precision particle sizing technology, with laser component analyzers enabling submicron particle measurement while providing rapid analysis in colloidal dispersions and nanoparticle suspensions used extensively in materials science research applications. Third, quality by design initiatives and regulatory focus on pharmaceutical quality accelerate deployment across analytical laboratories, with laser component analyzers integrating seamlessly into validated analytical methods and enabling real-time particle monitoring capabilities in pharmaceutical manufacturing environments.

Market restraints include initial investment barriers affecting smaller research laboratories and budget-constrained academic institutions, particularly where conventional particle sizing methods remain adequate for less demanding applications and where equipment budgets constrain adoption of advanced analytical instrumentation. Technical expertise requirements for optimal method development pose adoption challenges for facilities lacking experienced analytical scientists, as laser component analyzer performance depends heavily on proper sample preparation, optical model selection, and measurement parameter optimization that vary significantly across material types and particle morphology characteristics. Limited availability of application-specific technical support in emerging research markets creates additional barriers, as analytical laboratories require specialized training in instrument operation procedures, troubleshooting methods, and data interpretation techniques to achieve target measurement quality levels.

Key trends indicate accelerated adoption in Asian pharmaceutical research hubs, particularly China and India, where drug development capabilities and materials science research programs are expanding rapidly through government research funding initiatives and pharmaceutical industry investment in analytical infrastructure. Technology advancement trends toward multi-angle light scattering detection with enhanced sensitivity, integrated particle imaging for morphology characterization, and cloud-connected data management systems enabling remote instrument monitoring are driving next-generation product development. The market thesis could face disruption if advanced imaging technologies achieve breakthrough capabilities in automated particle analysis with comparable measurement speed, potentially reducing demand for conventional laser diffraction systems in specific application segments where particle shape information proves critical for material characterization.
Analysis of the Laser Component Analyzer Market by Key Country

Laser Component Analyzer Market Cagr Analysis By Country

Country CAGR (2025-2035)
China 6.5%
India 6.0%
Germany 5.5%
Brazil 5.0%
USA 4.6%
UK 4.1%
Japan 3.6%

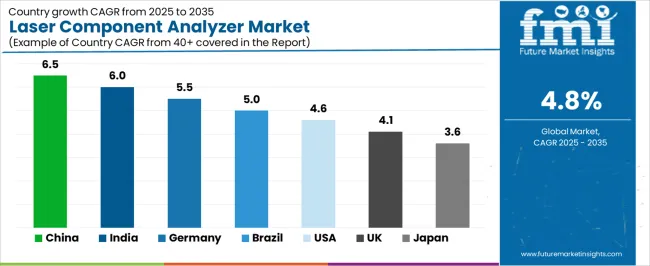
The market is gaining momentum worldwide, with China taking the leads to aggressive pharmaceutical research expansion and materials science laboratory development programs. Close behind, India benefits from growing drug development activities and government research initiatives, positioning itself as a strategic growth hub in the Asia-Pacific region. Brazil shows strong advancement, where expanding pharmaceutical manufacturing operations and materials research infrastructure development strengthen its role in South American scientific supply chains. The USA demonstrates robust growth through advanced materials research initiatives and pharmaceutical sector investment, signaling continued adoption in precision analytical applications. Japan stands out for its materials characterization expertise and advanced analytical technology integration, while UK and Germany continue to record consistent progress driven by pharmaceutical research centers and materials science facilities. China and India anchor the global expansion story, while established markets build stability and technology leadership into the market's growth path.

The report covers an in-depth analysis of 40+ countries, top-performing countries are highlighted below.
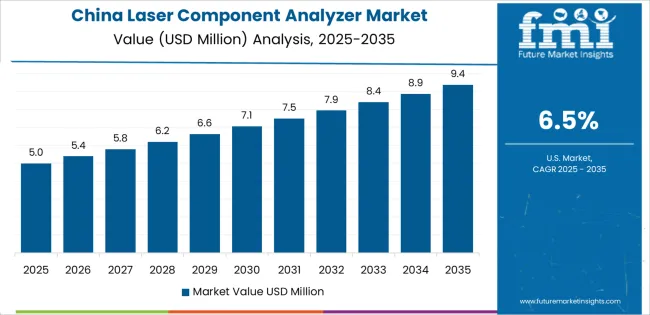
Why does China lead global market expansion?

Laser Component Analyzer Market Country Value Analysis

China demonstrates the strongest growth potential in the market with a CAGR of 6.5% through 2035. The country's leadership position stems from comprehensive pharmaceutical research expansion, intensive materials science development programs, and aggressive analytical laboratory modernization targets driving adoption of advanced particle characterization technologies. Growth is concentrated in major research regions, including Beijing, Shanghai, Jiangsu, and Guangdong, where pharmaceutical companies, materials research institutes, and quality control laboratories are implementing laser component analyzer systems for formulation development and materials characterization. Distribution channels through analytical instrument distributors, laboratory equipment specialists, and direct manufacturer relationships expand deployment across pharmaceutical research parks, university research centers, and industrial quality control facilities. The country's Made in China 2025 initiative provides policy support for advanced analytical technology adoption, including subsidies for research equipment procurement and laboratory infrastructure upgrades.

Key market factors:

  • Research intensity in pharmaceutical and materials science clusters with comprehensive laboratory modernization programs
  • Government support through research infrastructure schemes providing 20-30% equipment subsidies for advanced analytical instrument adoption
  • Comprehensive supply chain ecosystem including established laboratory equipment distributors and technical service providers with proven capabilities
  • Technology integration featuring automated sampling systems, laboratory information management platforms, and quality control systems enabling advanced analytical operations

Why is India emerging as a high-growth market?

In the National Capital Region, Maharashtra, Karnataka, and Telangana research zones, the adoption of laser component analyzer systems is accelerating across pharmaceutical development laboratories, materials research facilities, and industrial quality control operations, driven by Make in India initiatives and increasing focus on research competitiveness. The market demonstrates strong growth momentum with a CAGR of 6.0% through 2035, linked to comprehensive pharmaceutical sector expansion and increasing investment in analytical capabilities. Indian researchers are implementing laser component analyzer technology and advanced particle sizing platforms to improve analytical productivity while meeting stringent data quality requirements in pharmaceutical development and materials characterization serving domestic and export markets. The country's National Science and Technology Policy creates steady demand for advanced analytical solutions, while increasing focus on quality standards drives adoption of precision particle sizing systems that enhance research capabilities.

  • Leading research development regions, including Delhi, Mumbai, Bangalore, and Hyderabad, driving laser component analyzer system adoption across pharmaceutical research clusters
  • Government incentive programs enabling 25-40% capital subsidy support for research equipment procurement and laboratory technology upgrades
  • Technology collaboration agreements accelerating deployment with international analytical instrument manufacturers and laboratory technology providers
  • Policy support through pharmaceutical research incentive schemes and analytical capability enhancement programs linked to advanced instrumentation adoption

How does Germany maintain regional leadership?

Germany's advanced research sector demonstrates sophisticated implementation of laser component analyzer systems, with documented case studies showing 35-50% productivity improvement in pharmaceutical particle characterization through optimized analytical strategies. The country's research infrastructure in major scientific regions, including Bavaria, Baden-Württemberg, North Rhine-Westphalia, and Hesse, showcases integration of precision particle sizing technologies with existing analytical laboratories, leveraging expertise in pharmaceutical development and materials science research. German researchers emphasize measurement quality standards and method validation, creating demand for reliable laser component analyzer solutions that support data integrity commitments and stringent analytical accuracy requirements. The market maintains strong growth through focus on Industry 4.0 integration and analytical excellence, with a CAGR of 5.5% through 2035.

Key development areas:

  • Pharmaceutical research centers and materials science laboratories enabling precision particle analysis with comprehensive measurement validation programs
  • Technical training infrastructure providing skilled analytical personnel with documented 90% optimal method utilization rates
  • Strategic partnerships between analytical instrument suppliers and research institutions expanding integrated solution offerings
  • Integration of digital laboratory systems and comprehensive data management capabilities for optimized analytical operations

Why does Brazil show strong industrial development?

The Brazilian market leads in Latin American laser component analyzer adoption based on expanding pharmaceutical research operations and growing analytical laboratory infrastructure in major research centers. The country shows solid potential with a CAGR of 5.0% through 2035, driven by pharmaceutical sector investment and increasing domestic demand for precision analytical instruments across drug development, materials characterization, and industrial quality control sectors. Brazilian researchers are adopting laser component analyzer technology for compliance with pharmaceutical quality standards, particularly in generic drug development requiring bioequivalence studies and in materials research where particle size control impacts product performance. Technology deployment channels through laboratory equipment distributors, analytical instrument representatives, and equipment financing programs expand coverage across pharmaceutical research facilities and materials testing laboratories.

Leading market segments:

  • Pharmaceutical research and development in São Paulo and southern research regions implementing precision analytical programs
  • Technology partnerships with international instrument manufacturers achieving 70% productivity improvement targets in particle characterization operations
  • Strategic collaborations between pharmaceutical companies and analytical equipment suppliers enabling advanced laboratory technology adoption
  • Focus on research competitiveness and analytical capability development incentivizing precision instrumentation investment

How does the United States demonstrate strong technology innovation?

The USA market leads in advanced laser component analyzer applications based on integration with sophisticated laboratory automation systems and comprehensive data management platforms for enhanced analytical efficiency. The country shows solid potential with a CAGR of 4.6% through 2035, driven by pharmaceutical research expansion and increasing adoption of advanced analytical technologies across drug development, materials science, and industrial quality control sectors. American researchers are implementing laser component analyzer systems for high-precision particle characterization requirements, particularly in biopharmaceutical development demanding submicron particle analysis and in nanomaterials research where size distribution data directly impacts material properties. Technology deployment channels through laboratory equipment distributors, analytical instrument specialists, and direct manufacturer relationships expand coverage across diverse research operations.

Leading market segments:

  • Pharmaceutical and materials science research in Northeast, Mid-Atlantic, and West Coast regions implementing precision analytical programs for formulation development
  • Technology partnerships with analytical instrument manufacturers achieving 95% measurement repeatability compliance rates in critical applications
  • Strategic collaborations between pharmaceutical companies and equipment suppliers enabling advanced analytical technology deployment
  • Focus on analytical productivity and data quality consistency driving precision instrumentation adoption across pharmaceutical and materials research sectors

How does the United Kingdom demonstrate steady manufacturing adoption?

The UK market demonstrates consistent implementation focused on pharmaceutical research and materials characterization, with documented integration of laser component analyzer systems achieving 30-40% improvement in analytical throughput for particle sizing operations. The country maintains steady growth momentum with a CAGR of 4.1% through 2035, driven by pharmaceutical research presence and materials science requirements for precision particle characterization capabilities. Major research regions, including South East England, North West England, and Scotland, showcase deployment of advanced particle sizing technologies that integrate with existing analytical infrastructure and support quality requirements in pharmaceutical and materials research operations.

Key market characteristics:

  • Pharmaceutical research facilities and materials science laboratories driving precision analytical technology requirements
  • Technology partnerships enabling 85% optimal measurement protocol implementation through technical support programs
  • Collaboration between analytical instrument suppliers and research facilities ensuring consistent performance and technical assistance
  • Focus on analytical efficiency and data quality consistency supporting precision instrumentation adoption in competitive research sectors

How does Japan demonstrate precision manufacturing integration?

Japan's market demonstrates sophisticated implementation focused on materials science research and pharmaceutical development, with documented integration of advanced particle sizing systems achieving 40-45% reduction in analytical cycle times through optimized measurement protocols. The country maintains steady growth momentum with a CAGR of 3.6% through 2035, driven by analytical excellence culture and focus on measurement precision principles aligned with quality-focused research philosophies. Major research regions, including Tokyo, Osaka, Kanagawa, and Aichi, showcase advanced deployment of precision particle sizing technologies that integrate seamlessly with automated analytical workflows and comprehensive quality assurance systems.

Key market characteristics:
  • Materials research and pharmaceutical development driving advanced analytical technology requirements with focus on measurement accuracy
  • Technology partnerships enabling 98% measurement repeatability compliance through optimized analytical methods and quality control
  • Collaboration between analytical instrument manufacturers and research institutions ensuring integrated solution development and technical support
  • Focus on analytical precision and continuous improvement supporting advanced particle characterization technology adoption across diverse research applications

What is the market split by country in Europe?

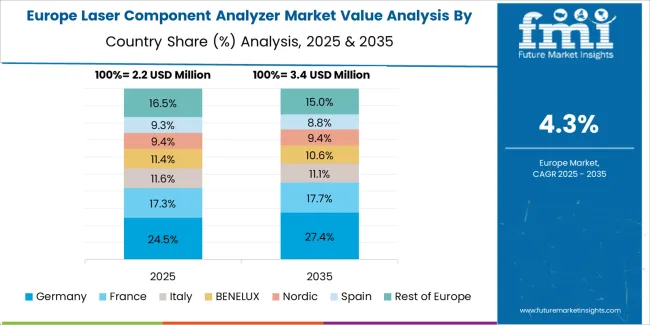
Laser Component Analyzer Market Europe Country Market Share Analysis, 2025 & 2035

The laser component analyzer market in Europe is projected to grow from USD 0.7 million in 2025 to USD 20.0 million by 2035, registering a CAGR of 40.1% over the forecast period. Germany is expected to maintain its leadership position with a 34.2% market share in 2025, declining slightly to 33.5% by 2035, supported by its extensive pharmaceutical research infrastructure and major materials science centers, including Bavaria, Baden-Württemberg, and North Rhine-Westphalia research regions.

France follows with a 19.6% share in 2025, projected to reach 20.1% by 2035, driven by comprehensive pharmaceutical development programs and materials research activities in major scientific regions. The United Kingdom holds a 16.3% share in 2025, expected to reach 16.8% by 2035 through pharmaceutical research centers and materials characterization facilities. Italy commands a 12.7% share in both 2025 and 2035, backed by pharmaceutical development and materials science research. Spain accounts for 9.1% in 2025, rising to 9.4% by 2035 on pharmaceutical research expansion and materials analysis sector growth. The Rest of Europe region is anticipated to hold 8.1% in 2025, expanding to 8.5% by 2035, attributed to increasing laser component analyzer adoption in Nordic research facilities and emerging Central & Eastern European pharmaceutical development operations.
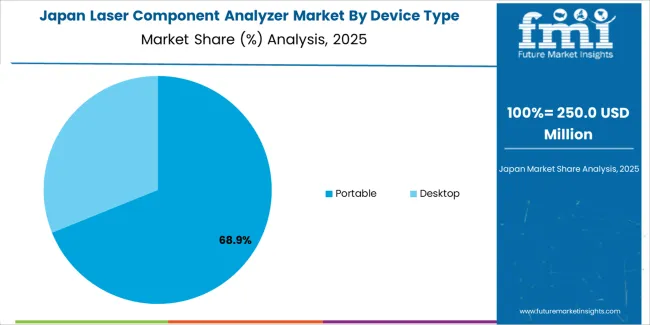
Why do portable systems dominate laboratory requirements in Japan?

Laser Component Analyzer Market Japan Market Share Analysis By Device Type

The Japanese market demonstrates a mature and quality-focused landscape, characterized by sophisticated integration of portable analyzer systems with existing research infrastructure across pharmaceutical development laboratories, materials science facilities, and industrial quality control operations. Japan's focus on measurement precision and analytical excellence drives demand for particle sizing instruments that support quality commitments and research objectives in competitive scientific environments. The market benefits from strong partnerships between international analytical instrument providers and domestic laboratory equipment distributors including major scientific trading companies, creating comprehensive service ecosystems that prioritize technical support and application development programs. Research centers in Tokyo, Osaka, Kanagawa, and other major scientific areas showcase advanced analytical implementations where laser component analyzer systems achieve 98% measurement repeatability through optimized analytical protocols and comprehensive quality verification systems.
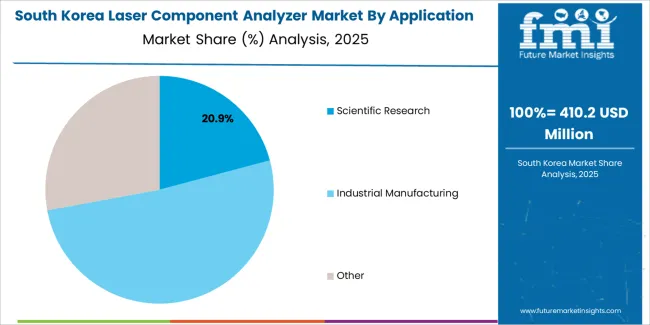
Why do international providers lead technical services in South Korea?

Laser Component Analyzer Market South Korea Market Share Analysis By Application

The South Korean market is characterized by growing international technology provider presence, with companies maintaining significant positions through comprehensive technical support and application engineering capabilities for pharmaceutical development and materials characterization applications. The market demonstrates increasing focus on analytical automation and measurement quality, as Korean researchers increasingly demand advanced particle sizing solutions that integrate with domestic laboratory infrastructure and sophisticated data management systems deployed across major research complexes. Regional analytical instrument distributors are gaining market share through strategic partnerships with international manufacturers, offering specialized services including technical training programs and application-specific analytical solutions for pharmaceutical and materials research operations. The competitive landscape shows increasing collaboration between multinational analytical instrument companies and Korean laboratory equipment specialists, creating hybrid service models that combine international product development expertise with local technical support capabilities and rapid response systems.
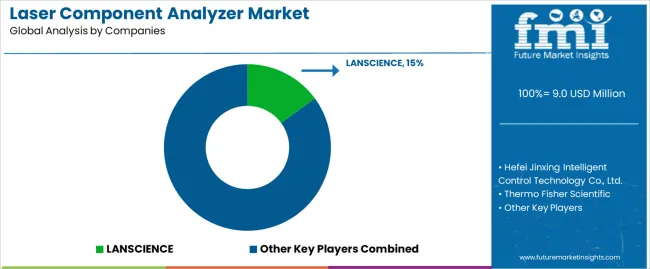
What factors define the competitive landscape of the laser component analyzer market?

Laser Component Analyzer Market Analysis By Company

The market features approximately 15-20 meaningful players with moderate fragmentation, where the top three companies control roughly 38-42% of global market share through established distribution networks and comprehensive application support portfolios. Competition centers on measurement accuracy consistency, instrument reliability, and technical service capabilities rather than price competition alone. LANSCIENCE leads with approximately 15.0% market share through its comprehensive particle sizing solutions portfolio and strong presence in Asian pharmaceutical research markets.

Market leaders include LANSCIENCE, Hefei Jinxing Intelligent Control Technology Co., Ltd., and Thermo Fisher Scientific, which maintain competitive advantages through global distribution infrastructure, advanced laser optics technology, and deep expertise in application development across multiple research sectors, creating trust and reliability advantages with pharmaceutical researchers and materials characterization laboratories. These companies leverage research and development capabilities in optical system optimization and ongoing technical support relationships to defend market positions while expanding into emerging pharmaceutical research markets and specialized nanomaterials characterization segments.

Challengers encompass Anton Paar GmbH and Beckman Coulter, which compete through specialized product offerings and strong regional presence in key research markets. Product specialists, including TSI Incorporated, Malvern Panalytical Ltd, and Microtrac, focus on specific analyzer configurations or regional markets, offering differentiated capabilities in custom optical designs, rapid measurement protocols, and competitive pricing structures.

Regional players and emerging analytical instrument manufacturers create competitive pressure through localized service advantages and rapid response capabilities, particularly in high-growth markets including China and India, where proximity to pharmaceutical research clusters provides advantages in technical support responsiveness and customer relationships. Market dynamics favor companies that combine proven measurement performance with comprehensive application engineering offerings that address the complete analytical workflow from sample preparation through data interpretation and method validation.

Global Laser Component Analyzer Market - Stakeholder Contribution Framework

Laser component analyzers represent advanced analytical instruments that enable researchers to achieve 40-60% time reduction compared to conventional particle sizing methods, delivering superior measurement accuracy and analytical throughput with broad size range coverage and excellent repeatability in demanding characterization applications. With the market projected to grow from USD 9.0 million in 2025 to USD 14.4 million by 2035 at a 4.8% CAGR, these precision analytical systems offer compelling advantages including measurement speed, size range versatility, and operational simplicity, making them essential for scientific research applications (20.0% market share), industrial manufacturing operations (20.9% share), and analytical facilities seeking alternatives to conventional particle sizing methods that compromise productivity through longer analysis times and limited measurement ranges. Scaling market adoption and technology deployment requires coordinated action across research policy, analytical infrastructure development, instrument manufacturers, research laboratories, and scientific equipment investment capital.

How Governments Could Spur Local Production and Adoption?

  • Research Infrastructure Programs: Include analytical instrumentation in research funding schemes, provide technology upgrading support for academic and industrial research laboratories, and establish domestic analytical instrument manufacturing capabilities that reduce import dependencies in scientific supply chains.
  • Research & Innovation Funding: Fund university research on advanced optical detection systems, laser technology development, and particle characterization methodologies for diverse material types. Invest in industry-academic partnerships that advance practical analytical knowledge for pharmaceutical formulation and materials characterization requirements.
  • Infrastructure Development Incentives: Provide grants for establishing analytical service centers near research clusters, offer equipment financing programs for particle sizing technology adoption in smaller research laboratories, and support supply chain development that ensures reliable analytical instrument availability for pharmaceutical and materials research operations.
  • Standards & Quality Certification: Establish national reference laboratories for particle size measurement verification, develop training programs for analytical scientists and laboratory technicians, and create harmonized measurement protocols that facilitate validation of particle sizing methods across different research environments.
  • Research Competitiveness Programs: Promote advanced analytical capabilities through research equipment subsidies, support laboratory modernization initiatives that integrate precision instrumentation with digital data systems, and establish incentive programs that reward analytical excellence through advanced technology adoption.

How Industry Bodies Could Support Market Development?

  • Quality Standards & Certification: Define standardized testing protocols for instrument performance verification, measurement accuracy validation, and size range specifications across portable (70.9% market dominance) and desktop particle sizing systems, enabling reliable performance comparison and informed purchasing decisions.
  • Best Management Practices: Develop comprehensive guidelines for sample preparation procedures, optical model selection, and measurement parameter optimization in particle characterization applications, ensuring consistent analytical results and maximum instrument utility across different material types and research objectives.
  • Supply Chain Integration Standards: Create technical documentation frameworks for optical system specifications, laser source characteristics, and detector configurations that facilitate seamless integration across research operations and analytical workflows.
  • Technical Training & Extension: Establish education programs for analytical scientists, laboratory personnel, and method development specialists on optimal measurement practices, troubleshooting methods, and data interpretation techniques that ensure successful laser component analyzer implementation.

How OEMs and Technology Players Could Strengthen the Ecosystem?

  • Advanced Product Development: Develop next-generation laser sources with enhanced stability, optimized optical configurations with improved sensitivity, and advanced detection systems that extend measurement ranges while maintaining accuracy in challenging applications.
  • Processing Technology Innovation: Provide efficient data processing algorithms with rapid calculation capabilities, quality control systems for measurement verification, and automated calibration platforms that ensure consistent performance across instrument lifetimes.
  • Application-Specific Solutions: Offer analyzer systems tailored for pharmaceutical development requirements, specialized configurations for nanomaterials characterization, and customized optical designs that address specific particle types while maintaining measurement efficiency.
  • Technical Support Services: Build comprehensive customer advisory programs including method development assistance, troubleshooting support, and performance monitoring services that help researchers achieve target analytical objectives while maintaining data quality standards.

How Suppliers Could Navigate the Shift?

  • Application-Focused Product Lines: Develop specialized laser component analyzers for scientific research applications (20.0% market dominance), industrial manufacturing operations (20.9% share), and other analytical segments, with configurations optimized for each application's specific measurement requirements and performance expectations.
  • Geographic Market Strategy: Establish manufacturing and distribution capabilities in high-growth markets like China (6.5% CAGR) and India (6.0% CAGR), while maintaining technical support infrastructure in established research markets like Germany (5.5% CAGR) and USA (4.6% CAGR).
  • Technology Differentiation: Invest in proprietary optical designs, advanced signal processing algorithms, and comprehensive validation documentation that provide superior measurement performance and enable premium positioning in competitive analytical instrument markets.
  • Customer Partnership Models: Develop long-term relationships with pharmaceutical researchers, materials scientists, and industrial quality control laboratories through collaborative method development programs, technical training services, and performance guarantee programs that strengthen customer loyalty.

How Investors and Financial Enablers Could Unlock Value?

  • Analytical Instrument Manufacturing: Finance established laser component analyzer manufacturers for production capacity expansion, optical technology implementation, and quality control system upgrades that serve growing demand in scientific research and industrial manufacturing markets.
  • Supply Chain Infrastructure: Provide capital for establishing regional service centers, technical support facilities, and training centers that reduce response times while ensuring consistent technical assistance across pharmaceutical research and materials characterization regions.
  • Innovation & Technology Development: Back analytical technology companies developing advanced laser systems, optical detection platforms, and measurement algorithm technologies that enhance analytical performance while addressing cost concerns and application versatility requirements.
  • Market Integration & Consolidation: Support strategic partnerships between analytical instrument manufacturers and laboratory automation providers, finance technical training program development, and enable market consolidation that creates comprehensive analytical solution providers serving multiple research segments.

Key Players in the Laser Component Analyzer Market

  • LANSCIENCE
  • Hefei Jinxing Intelligent Control Technology Co., Ltd.
  • Thermo Fisher Scientific
  • Anton Paar GmbH
  • Beckman Coulter
  • TSI Incorporated
  • Malvern Panalytical Ltd
  • Microtrac

Scope of the Report

Item Value
Quantitative Units USD 9.0 million
Device Type Portable, Desktop
Application Scientific Research, Industrial Manufacturing, Others
Regions Covered Asia Pacific, Europe, North America, Latin America, Middle East & Africa
Country Covered China, India, Germany, Brazil, USA, UK, Japan, and 40+ countries
Key Companies Profiled LANSCIENCE, Hefei Jinxing Intelligent Control Technology Co., Ltd., Thermo Fisher Scientific, Anton Paar GmbH, Beckman Coulter, TSI Incorporated, Malvern Panalytical Ltd, Microtrac
Additional Attributes Dollar sales by device type and application categories, regional adoption trends across Asia Pacific, Europe, and North America, competitive landscape with analytical instrument manufacturers and distribution networks, research laboratory requirements and specifications, integration with automated sampling systems and laboratory information management platforms, innovations in laser optics technology and detection systems, and development of specialized particle sizing solutions with enhanced measurement range and accuracy capabilities.

Laser Component Analyzer Market by Segments

Device Type:

  • Portable
  • Desktop

Application:

  • Scientific Research
  • Industrial Manufacturing
  • Other

Region:

  • Asia Pacific
    • China
    • India
    • Japan
    • South Korea
    • Australia & New Zealand
    • ASEAN
    • Rest of Asia Pacific
  • Europe
    • Germany
    • United Kingdom
    • France
    • Italy
    • Spain
    • Netherlands
    • Nordic
    • BENELUX
    • Rest of Europe
  • North America
    • United States
    • Canada
    • Mexico
  • Latin America
    • Brazil
    • Argentina
    • Rest of Latin America
  • Middle East & Africa
    • Kingdom of Saudi Arabia
    • Other GCC Countries
    • Turkey
    • South Africa
    • Other African Union
    • Rest of Middle East & Africa

Frequently Asked Questions

How big is the laser component analyzer market in 2025?

The global laser component analyzer market is estimated to be valued at USD 9.0 million in 2025.

What will be the size of laser component analyzer market in 2035?

The market size for the laser component analyzer market is projected to reach USD 14.4 million by 2035.

How much will be the laser component analyzer market growth between 2025 and 2035?

The laser component analyzer market is expected to grow at a 4.8% CAGR between 2025 and 2035.

What are the key product types in the laser component analyzer market?

The key product types in laser component analyzer market are portable and desktop.

Which application segment to contribute significant share in the laser component analyzer market in 2025?

In terms of application, scientific research segment to command 20.0% share in the laser component analyzer market in 2025.

Table of Content

  1. Executive Summary
    • Global Market Outlook
    • Demand to side Trends
    • Supply to side Trends
    • Technology Roadmap Analysis
    • Analysis and Recommendations
  2. Market Overview
    • Market Coverage / Taxonomy
    • Market Definition / Scope / Limitations
  3. Market Background
    • Market Dynamics
      • Drivers
      • Restraints
      • Opportunity
      • Trends
    • Scenario Forecast
      • Demand in Optimistic Scenario
      • Demand in Likely Scenario
      • Demand in Conservative Scenario
    • Opportunity Map Analysis
    • Product Life Cycle Analysis
    • Supply Chain Analysis
    • Investment Feasibility Matrix
    • Value Chain Analysis
    • PESTLE and Porter’s Analysis
    • Regulatory Landscape
    • Regional Parent Market Outlook
    • Production and Consumption Statistics
    • Import and Export Statistics
  4. Global Market Analysis 2020 to 2024 and Forecast, 2025 to 2035
    • Historical Market Size Value (USD Million) Analysis, 2020 to 2024
    • Current and Future Market Size Value (USD Million) Projections, 2025 to 2035
      • Y to o to Y Growth Trend Analysis
      • Absolute $ Opportunity Analysis
  5. Global Market Pricing Analysis 2020 to 2024 and Forecast 2025 to 2035
  6. Global Market Analysis 2020 to 2024 and Forecast 2025 to 2035, By Device Type
    • Introduction / Key Findings
    • Historical Market Size Value (USD Million) Analysis By Device Type , 2020 to 2024
    • Current and Future Market Size Value (USD Million) Analysis and Forecast By Device Type , 2025 to 2035
      • Portable
      • Desktop
    • Y to o to Y Growth Trend Analysis By Device Type , 2020 to 2024
    • Absolute $ Opportunity Analysis By Device Type , 2025 to 2035
  7. Global Market Analysis 2020 to 2024 and Forecast 2025 to 2035, By Application
    • Introduction / Key Findings
    • Historical Market Size Value (USD Million) Analysis By Application, 2020 to 2024
    • Current and Future Market Size Value (USD Million) Analysis and Forecast By Application, 2025 to 2035
      • Scientific Research
      • Industrial Manufacturing
      • Other
    • Y to o to Y Growth Trend Analysis By Application, 2020 to 2024
    • Absolute $ Opportunity Analysis By Application, 2025 to 2035
  8. Global Market Analysis 2020 to 2024 and Forecast 2025 to 2035, By Region
    • Introduction
    • Historical Market Size Value (USD Million) Analysis By Region, 2020 to 2024
    • Current Market Size Value (USD Million) Analysis and Forecast By Region, 2025 to 2035
      • North America
      • Latin America
      • Western Europe
      • Eastern Europe
      • East Asia
      • South Asia and Pacific
      • Middle East & Africa
    • Market Attractiveness Analysis By Region
  9. North America Market Analysis 2020 to 2024 and Forecast 2025 to 2035, By Country
    • Historical Market Size Value (USD Million) Trend Analysis By Market Taxonomy, 2020 to 2024
    • Market Size Value (USD Million) Forecast By Market Taxonomy, 2025 to 2035
      • By Country
        • USA
        • Canada
        • Mexico
      • By Device Type
      • By Application
    • Market Attractiveness Analysis
      • By Country
      • By Device Type
      • By Application
    • Key Takeaways
  10. Latin America Market Analysis 2020 to 2024 and Forecast 2025 to 2035, By Country
    • Historical Market Size Value (USD Million) Trend Analysis By Market Taxonomy, 2020 to 2024
    • Market Size Value (USD Million) Forecast By Market Taxonomy, 2025 to 2035
      • By Country
        • Brazil
        • Chile
        • Rest of Latin America
      • By Device Type
      • By Application
    • Market Attractiveness Analysis
      • By Country
      • By Device Type
      • By Application
    • Key Takeaways
  11. Western Europe Market Analysis 2020 to 2024 and Forecast 2025 to 2035, By Country
    • Historical Market Size Value (USD Million) Trend Analysis By Market Taxonomy, 2020 to 2024
    • Market Size Value (USD Million) Forecast By Market Taxonomy, 2025 to 2035
      • By Country
        • Germany
        • UK
        • Italy
        • Spain
        • France
        • Nordic
        • BENELUX
        • Rest of Western Europe
      • By Device Type
      • By Application
    • Market Attractiveness Analysis
      • By Country
      • By Device Type
      • By Application
    • Key Takeaways
  12. Eastern Europe Market Analysis 2020 to 2024 and Forecast 2025 to 2035, By Country
    • Historical Market Size Value (USD Million) Trend Analysis By Market Taxonomy, 2020 to 2024
    • Market Size Value (USD Million) Forecast By Market Taxonomy, 2025 to 2035
      • By Country
        • Russia
        • Poland
        • Hungary
        • Balkan & Baltic
        • Rest of Eastern Europe
      • By Device Type
      • By Application
    • Market Attractiveness Analysis
      • By Country
      • By Device Type
      • By Application
    • Key Takeaways
  13. East Asia Market Analysis 2020 to 2024 and Forecast 2025 to 2035, By Country
    • Historical Market Size Value (USD Million) Trend Analysis By Market Taxonomy, 2020 to 2024
    • Market Size Value (USD Million) Forecast By Market Taxonomy, 2025 to 2035
      • By Country
        • China
        • Japan
        • South Korea
      • By Device Type
      • By Application
    • Market Attractiveness Analysis
      • By Country
      • By Device Type
      • By Application
    • Key Takeaways
  14. South Asia and Pacific Market Analysis 2020 to 2024 and Forecast 2025 to 2035, By Country
    • Historical Market Size Value (USD Million) Trend Analysis By Market Taxonomy, 2020 to 2024
    • Market Size Value (USD Million) Forecast By Market Taxonomy, 2025 to 2035
      • By Country
        • India
        • ASEAN
        • Australia & New Zealand
        • Rest of South Asia and Pacific
      • By Device Type
      • By Application
    • Market Attractiveness Analysis
      • By Country
      • By Device Type
      • By Application
    • Key Takeaways
  15. Middle East & Africa Market Analysis 2020 to 2024 and Forecast 2025 to 2035, By Country
    • Historical Market Size Value (USD Million) Trend Analysis By Market Taxonomy, 2020 to 2024
    • Market Size Value (USD Million) Forecast By Market Taxonomy, 2025 to 2035
      • By Country
        • Kingdom of Saudi Arabia
        • Other GCC Countries
        • Turkiye
        • South Africa
        • Other African Union
        • Rest of Middle East & Africa
      • By Device Type
      • By Application
    • Market Attractiveness Analysis
      • By Country
      • By Device Type
      • By Application
    • Key Takeaways
  16. Key Countries Market Analysis
    • USA
      • Pricing Analysis
      • Market Share Analysis, 2024
        • By Device Type
        • By Application
    • Canada
      • Pricing Analysis
      • Market Share Analysis, 2024
        • By Device Type
        • By Application
    • Mexico
      • Pricing Analysis
      • Market Share Analysis, 2024
        • By Device Type
        • By Application
    • Brazil
      • Pricing Analysis
      • Market Share Analysis, 2024
        • By Device Type
        • By Application
    • Chile
      • Pricing Analysis
      • Market Share Analysis, 2024
        • By Device Type
        • By Application
    • Germany
      • Pricing Analysis
      • Market Share Analysis, 2024
        • By Device Type
        • By Application
    • UK
      • Pricing Analysis
      • Market Share Analysis, 2024
        • By Device Type
        • By Application
    • Italy
      • Pricing Analysis
      • Market Share Analysis, 2024
        • By Device Type
        • By Application
    • Spain
      • Pricing Analysis
      • Market Share Analysis, 2024
        • By Device Type
        • By Application
    • France
      • Pricing Analysis
      • Market Share Analysis, 2024
        • By Device Type
        • By Application
    • India
      • Pricing Analysis
      • Market Share Analysis, 2024
        • By Device Type
        • By Application
    • ASEAN
      • Pricing Analysis
      • Market Share Analysis, 2024
        • By Device Type
        • By Application
    • Australia & New Zealand
      • Pricing Analysis
      • Market Share Analysis, 2024
        • By Device Type
        • By Application
    • China
      • Pricing Analysis
      • Market Share Analysis, 2024
        • By Device Type
        • By Application
    • Japan
      • Pricing Analysis
      • Market Share Analysis, 2024
        • By Device Type
        • By Application
    • South Korea
      • Pricing Analysis
      • Market Share Analysis, 2024
        • By Device Type
        • By Application
    • Russia
      • Pricing Analysis
      • Market Share Analysis, 2024
        • By Device Type
        • By Application
    • Poland
      • Pricing Analysis
      • Market Share Analysis, 2024
        • By Device Type
        • By Application
    • Hungary
      • Pricing Analysis
      • Market Share Analysis, 2024
        • By Device Type
        • By Application
    • Kingdom of Saudi Arabia
      • Pricing Analysis
      • Market Share Analysis, 2024
        • By Device Type
        • By Application
    • Turkiye
      • Pricing Analysis
      • Market Share Analysis, 2024
        • By Device Type
        • By Application
    • South Africa
      • Pricing Analysis
      • Market Share Analysis, 2024
        • By Device Type
        • By Application
  17. Market Structure Analysis
    • Competition Dashboard
    • Competition Benchmarking
    • Market Share Analysis of Top Players
      • By Regional
      • By Device Type
      • By Application
  18. Competition Analysis
    • Competition Deep Dive
      • LANSCIENCE
        • Overview
        • Product Portfolio
        • Profitability by Market Segments (Product/Age /Sales Channel/Region)
        • Sales Footprint
        • Strategy Overview
          • Marketing Strategy
          • Product Strategy
          • Channel Strategy
      • Hefei Jinxing Intelligent Control Technology Co., Ltd.
      • Thermo Fisher Scientific
      • Anton Paar GmbH
      • Beckman Coulter
      • TSI Incorporated
      • Malvern Panalytical Ltd
      • Microtrac
  19. Assumptions & Acronyms Used
  20. Research Methodology

List of Tables

  • Table 1: Global Market Value (USD Million) Forecast by Region, 2020 to 2035
  • Table 2: Global Market Value (USD Million) Forecast by Device Type , 2020 to 2035
  • Table 3: Global Market Value (USD Million) Forecast by Application, 2020 to 2035
  • Table 4: North America Market Value (USD Million) Forecast by Country, 2020 to 2035
  • Table 5: North America Market Value (USD Million) Forecast by Device Type , 2020 to 2035
  • Table 6: North America Market Value (USD Million) Forecast by Application, 2020 to 2035
  • Table 7: Latin America Market Value (USD Million) Forecast by Country, 2020 to 2035
  • Table 8: Latin America Market Value (USD Million) Forecast by Device Type , 2020 to 2035
  • Table 9: Latin America Market Value (USD Million) Forecast by Application, 2020 to 2035
  • Table 10: Western Europe Market Value (USD Million) Forecast by Country, 2020 to 2035
  • Table 11: Western Europe Market Value (USD Million) Forecast by Device Type , 2020 to 2035
  • Table 12: Western Europe Market Value (USD Million) Forecast by Application, 2020 to 2035
  • Table 13: Eastern Europe Market Value (USD Million) Forecast by Country, 2020 to 2035
  • Table 14: Eastern Europe Market Value (USD Million) Forecast by Device Type , 2020 to 2035
  • Table 15: Eastern Europe Market Value (USD Million) Forecast by Application, 2020 to 2035
  • Table 16: East Asia Market Value (USD Million) Forecast by Country, 2020 to 2035
  • Table 17: East Asia Market Value (USD Million) Forecast by Device Type , 2020 to 2035
  • Table 18: East Asia Market Value (USD Million) Forecast by Application, 2020 to 2035
  • Table 19: South Asia and Pacific Market Value (USD Million) Forecast by Country, 2020 to 2035
  • Table 20: South Asia and Pacific Market Value (USD Million) Forecast by Device Type , 2020 to 2035
  • Table 21: South Asia and Pacific Market Value (USD Million) Forecast by Application, 2020 to 2035
  • Table 22: Middle East & Africa Market Value (USD Million) Forecast by Country, 2020 to 2035
  • Table 23: Middle East & Africa Market Value (USD Million) Forecast by Device Type , 2020 to 2035
  • Table 24: Middle East & Africa Market Value (USD Million) Forecast by Application, 2020 to 2035

List of Figures

  • Figure 1: Global Market Pricing Analysis
  • Figure 2: Global Market Value (USD Million) Forecast 2020-2035
  • Figure 3: Global Market Value Share and BPS Analysis by Device Type , 2025 and 2035
  • Figure 4: Global Market Y-o-Y Growth Comparison by Device Type , 2025-2035
  • Figure 5: Global Market Attractiveness Analysis by Device Type
  • Figure 6: Global Market Value Share and BPS Analysis by Application, 2025 and 2035
  • Figure 7: Global Market Y-o-Y Growth Comparison by Application, 2025-2035
  • Figure 8: Global Market Attractiveness Analysis by Application
  • Figure 9: Global Market Value (USD Million) Share and BPS Analysis by Region, 2025 and 2035
  • Figure 10: Global Market Y-o-Y Growth Comparison by Region, 2025-2035
  • Figure 11: Global Market Attractiveness Analysis by Region
  • Figure 12: North America Market Incremental Dollar Opportunity, 2025-2035
  • Figure 13: Latin America Market Incremental Dollar Opportunity, 2025-2035
  • Figure 14: Western Europe Market Incremental Dollar Opportunity, 2025-2035
  • Figure 15: Eastern Europe Market Incremental Dollar Opportunity, 2025-2035
  • Figure 16: East Asia Market Incremental Dollar Opportunity, 2025-2035
  • Figure 17: South Asia and Pacific Market Incremental Dollar Opportunity, 2025-2035
  • Figure 18: Middle East & Africa Market Incremental Dollar Opportunity, 2025-2035
  • Figure 19: North America Market Value Share and BPS Analysis by Country, 2025 and 2035
  • Figure 20: North America Market Value Share and BPS Analysis by Device Type , 2025 and 2035
  • Figure 21: North America Market Y-o-Y Growth Comparison by Device Type , 2025-2035
  • Figure 22: North America Market Attractiveness Analysis by Device Type
  • Figure 23: North America Market Value Share and BPS Analysis by Application, 2025 and 2035
  • Figure 24: North America Market Y-o-Y Growth Comparison by Application, 2025-2035
  • Figure 25: North America Market Attractiveness Analysis by Application
  • Figure 26: Latin America Market Value Share and BPS Analysis by Country, 2025 and 2035
  • Figure 27: Latin America Market Value Share and BPS Analysis by Device Type , 2025 and 2035
  • Figure 28: Latin America Market Y-o-Y Growth Comparison by Device Type , 2025-2035
  • Figure 29: Latin America Market Attractiveness Analysis by Device Type
  • Figure 30: Latin America Market Value Share and BPS Analysis by Application, 2025 and 2035
  • Figure 31: Latin America Market Y-o-Y Growth Comparison by Application, 2025-2035
  • Figure 32: Latin America Market Attractiveness Analysis by Application
  • Figure 33: Western Europe Market Value Share and BPS Analysis by Country, 2025 and 2035
  • Figure 34: Western Europe Market Value Share and BPS Analysis by Device Type , 2025 and 2035
  • Figure 35: Western Europe Market Y-o-Y Growth Comparison by Device Type , 2025-2035
  • Figure 36: Western Europe Market Attractiveness Analysis by Device Type
  • Figure 37: Western Europe Market Value Share and BPS Analysis by Application, 2025 and 2035
  • Figure 38: Western Europe Market Y-o-Y Growth Comparison by Application, 2025-2035
  • Figure 39: Western Europe Market Attractiveness Analysis by Application
  • Figure 40: Eastern Europe Market Value Share and BPS Analysis by Country, 2025 and 2035
  • Figure 41: Eastern Europe Market Value Share and BPS Analysis by Device Type , 2025 and 2035
  • Figure 42: Eastern Europe Market Y-o-Y Growth Comparison by Device Type , 2025-2035
  • Figure 43: Eastern Europe Market Attractiveness Analysis by Device Type
  • Figure 44: Eastern Europe Market Value Share and BPS Analysis by Application, 2025 and 2035
  • Figure 45: Eastern Europe Market Y-o-Y Growth Comparison by Application, 2025-2035
  • Figure 46: Eastern Europe Market Attractiveness Analysis by Application
  • Figure 47: East Asia Market Value Share and BPS Analysis by Country, 2025 and 2035
  • Figure 48: East Asia Market Value Share and BPS Analysis by Device Type , 2025 and 2035
  • Figure 49: East Asia Market Y-o-Y Growth Comparison by Device Type , 2025-2035
  • Figure 50: East Asia Market Attractiveness Analysis by Device Type
  • Figure 51: East Asia Market Value Share and BPS Analysis by Application, 2025 and 2035
  • Figure 52: East Asia Market Y-o-Y Growth Comparison by Application, 2025-2035
  • Figure 53: East Asia Market Attractiveness Analysis by Application
  • Figure 54: South Asia and Pacific Market Value Share and BPS Analysis by Country, 2025 and 2035
  • Figure 55: South Asia and Pacific Market Value Share and BPS Analysis by Device Type , 2025 and 2035
  • Figure 56: South Asia and Pacific Market Y-o-Y Growth Comparison by Device Type , 2025-2035
  • Figure 57: South Asia and Pacific Market Attractiveness Analysis by Device Type
  • Figure 58: South Asia and Pacific Market Value Share and BPS Analysis by Application, 2025 and 2035
  • Figure 59: South Asia and Pacific Market Y-o-Y Growth Comparison by Application, 2025-2035
  • Figure 60: South Asia and Pacific Market Attractiveness Analysis by Application
  • Figure 61: Middle East & Africa Market Value Share and BPS Analysis by Country, 2025 and 2035
  • Figure 62: Middle East & Africa Market Value Share and BPS Analysis by Device Type , 2025 and 2035
  • Figure 63: Middle East & Africa Market Y-o-Y Growth Comparison by Device Type , 2025-2035
  • Figure 64: Middle East & Africa Market Attractiveness Analysis by Device Type
  • Figure 65: Middle East & Africa Market Value Share and BPS Analysis by Application, 2025 and 2035
  • Figure 66: Middle East & Africa Market Y-o-Y Growth Comparison by Application, 2025-2035
  • Figure 67: Middle East & Africa Market Attractiveness Analysis by Application
  • Figure 68: Global Market - Tier Structure Analysis
  • Figure 69: Global Market - Company Share Analysis
Dashboard
Dashboard
Dashboard
Dashboard
Dashboard
Dashboard

Full Research Suite comprises of:

Market outlook & trends analysis

Market outlook & trends analysis

Interviews & case studies

Interviews & case studies

Strategic recommendations

Strategic recommendations

Vendor profiles & capabilities analysis

Vendor profiles & capabilities analysis

5-year forecasts

5-year forecasts

8 regions and 60+ country-level data splits

8 regions and 60+ country-level data splits

Market segment data splits

Market segment data splits

12 months of continuous data updates

12 months of continuous data updates

DELIVERED AS:

PDF EXCEL ONLINE

Full Research Suite


$5000

$7500

$10000

Buy Report Now
Similar Industry Reports

Similar Industry Reports

Laser-Assisted Smart Lathes Market

Laser-Assisted Smart Lathes Market Size and Share Forecast Outlook 2025 to 2035

Laser Drilling Equipment Market

Laser Drilling Equipment Market Size and Share Forecast Outlook 2025 to 2035

Laser Transverse Mode Teaching Instrument Market

Laser Transverse Mode Teaching Instrument Market Forecast and Outlook 2025 to 2035

Laser Welding Equipment Market

Laser Welding Equipment Market Forecast and Outlook 2025 to 2035

Laser Welding Market

Laser Welding Market Size and Share Forecast Outlook 2025 to 2035

Laser Ablation Systems Market

Laser Ablation Systems Market Size and Share Forecast Outlook 2025 to 2035

Laser Measurement Integrating Sphere Market

Laser Measurement Integrating Sphere Market Size and Share Forecast Outlook 2025 to 2035

Laser Safety Cloths Market

Laser Safety Cloths Market Size and Share Forecast Outlook 2025 to 2035

Laser Dazzler Market

Laser Dazzler Market Size and Share Forecast Outlook 2025 to 2035

Laser Cable Marking Market

Laser Cable Marking Market Size and Share Forecast Outlook 2025 to 2035

Laser Cladding Market

Laser Cladding Market Size and Share Forecast Outlook 2025 to 2035

Laser Marking Equipment Market

Laser Marking Equipment Market Size and Share Forecast Outlook 2025 to 2035

Laser Cutting Machines Market

Laser Cutting Machines Market Size and Share Forecast Outlook 2025 to 2035

Laser Wire Marking Systems Market

Laser Wire Marking Systems Market Size and Share Forecast Outlook 2025 to 2035

Laser Photomask Market

Laser Photomask Market Size and Share Forecast Outlook 2025 to 2035

Laser Measuring Instrument Market

Laser Measuring Instrument Market Size and Share Forecast Outlook 2025 to 2035

Laser Welding Machine Market

Laser Welding Machine Market Size and Share Forecast Outlook 2025 to 2035

Laser Technology Market

Laser Technology Market Size and Share Forecast Outlook 2025 to 2035

Laser Interferometer Market

Laser Interferometer Market Size and Share Forecast Outlook 2025 to 2035

Laser Therapy Devices Market

The Laser Therapy Devices Market is segmented by Device Type and End User from 2025 to 2035

Future Market Insights

Laser Component Analyzer Market

Chat With MaRIA

Chat With

MaRIA

Hi There, I am MaRIA, Your Market Research Intelligence Assistant. How may I help you?