Diabetic Retinopathy Market Size and Share Forecast Outlook 2025 to 2035

The global Diabetic Retinopathy Market is estimated to be valued at USD 9,830 million in 2025 and is projected to reach USD 18,259.3 million by 2035, registering a compound annual growth rate (CAGR) of 5.8% over the forecast period.

The diabetic retinopathy market is experiencing strong growth as global diabetes prevalence continues to rise, driving increased risk for microvascular retinal complications. Early detection and timely intervention remain critical for preventing vision loss, propelling demand for advanced diagnostics, pharmacologic therapies, and interventional procedures.

Anti-VEGF agents remain the mainstay of treatment for diabetic macular edema and proliferative diabetic retinopathy, while longer-acting formulations, sustained-release implants, and novel biologics are expanding therapeutic options. As regulatory agencies accelerate approvals for longer-acting agents and combination therapies, diabetic retinopathy management is moving towards fewer injections, enhanced patient compliance, and earlier disease interception. The market outlook remains highly favorable, supported by demographic trends, technological innovation, and multidisciplinary diabetic care integration.

Leading manufacturers such as Roche, Regeneron, Bayer, Novartis, Genentech, and Kodiak Sciences are actively expanding diabetic retinopathy pipelines through next-generation anti-VEGF agents, combination biologics, and extended-duration delivery platforms.
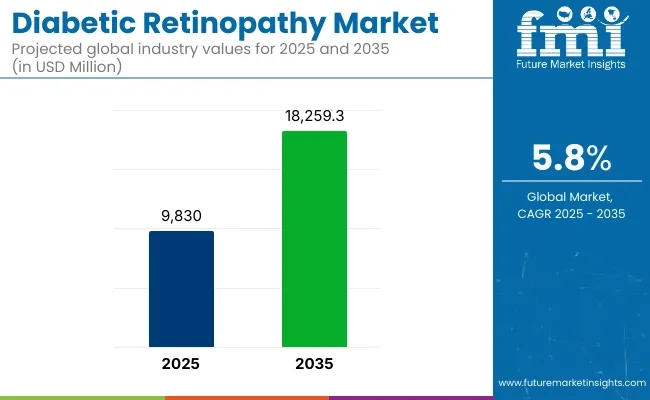
Diabetic Retinopathy Market

Metric Value
Market Size (2025E) USD 9,830 million
Market Value (2035F) USD 18,259.3 million
CAGR (2025 to 2035) 5.8%

Increasing emphasis is being placed on therapies that reduce injection frequency while maintaining durable efficacy to improve patient adherence. In 2024, Roche received Susvimo® (ranibizumab injection) for treatment of diabetic retinopathy.

“The approval of Susvimo for diabetic retinopathy expands treatment options for patients, offering predictable and immediate durability after implantation with only one treatment every nine months,” said Levi Garraway, MD, PhD, Chief Medical Officer and Head of Global Product Development. Manufacturers continue to focus on durability, real-world efficacy, and early-stage disease modification to expand their competitive positioning.

North America dominates the diabetic retinopathy market, supported by high diabetes prevalence, extensive screening infrastructure, and strong regulatory support for novel therapies. The USA market is witnessing robust adoption of long-acting anti-VEGF agents and implantable drug delivery platforms to reduce treatment burdens.

Collaboration between endocrinology, primary care, and retinal specialists is improving adherence to diabetic eye care protocols. Europe’s diabetic retinopathy market is expanding rapidly, driven by national diabetes prevention strategies, payer-funded retinal screening programs, and coordinated multidisciplinary care pathways. The UK., Germany, and Scandinavia have implemented population-level diabetic eye screening programs utilizing tele ophthalmology, driving early diagnosis rates.

European diabetic care networks increasingly integrate retinal screening into routine diabetes clinics, allowing timely referrals to specialist care. Cost pressures within national healthcare systems are driving interest in durability-focused therapies positioning Europe for strong procedural and pharmacologic growth in diabetic retinopathy care.

Analyzing Diabetic Retinopathy Market by Top Investment Segments

Non-Proliferative Diabetic Retinopathy Dominates the Market Due to Early Detection and Prevalence

In 2025, non-proliferative diabetic retinopathy (NPDR) is expected to hold 65.0% of the revenue share in the overall diabetic retinopathy market. This dominance is attributed to the higher prevalence of NPDR in diabetic patients, particularly in the early stages of the disease. NPDR is characterized by damage to the retinal blood vessels without the formation of new, abnormal blood vessels, making it a more common form of diabetic retinopathy.

The growth of this segment is driven by the increasing number of diabetic patients globally, as well as advancements in screening techniques that facilitate early diagnosis of NPDR. As this condition progresses, patients are more likely to seek treatment, contributing to the expansion of the NPDR segment.
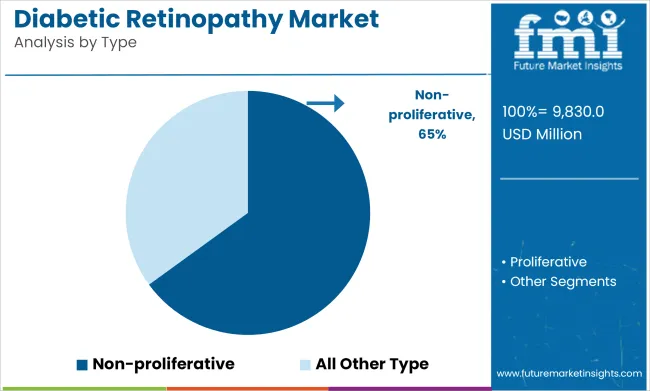
Diabetic Retinopathy Market Analysis By Type

The availability of effective monitoring and diagnostic tools, such as optical coherence tomography (OCT) and fundus photography, has improved early detection rates, supporting the growth of NPDR management. With the rise in diabetes prevalence and better awareness, the NPDR segment is expected to continue dominating the market.

Anti-VEGF Drugs Lead the Management Segment in Diabetic Retinopathy Due to Efficacy in Preventing Disease Progression

In 2025, anti-VEGF (vascular endothelial growth factor) drugs are projected to capture 39.0% of the revenue share in the diabetic retinopathy management market. This leadership is attributed to the proven efficacy of anti-VEGF treatments in managing diabetic macular edema (DME) and other advanced stages of diabetic retinopathy. These drugs work by inhibiting the growth of abnormal blood vessels and reducing fluid leakage in the retina, thereby preventing further damage and vision loss.
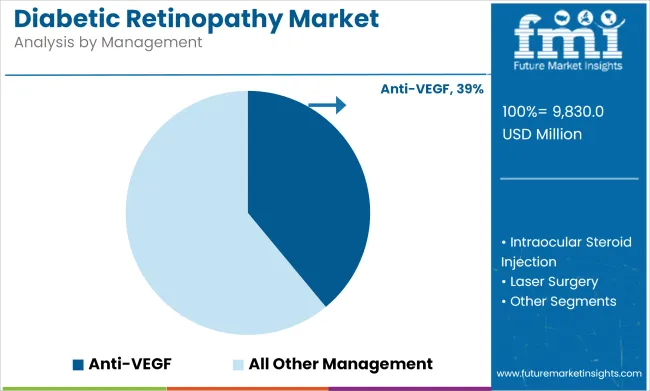
Diabetic Retinopathy Market Analysis By Management

The growth of this segment has been driven by the increasing number of patients requiring intervention for diabetic retinopathy, along with the growing adoption of anti-VEGF therapy due to its ability to slow the progression of the disease. Additionally, the approval of newer anti-VEGF drugs with improved safety profiles has expanded treatment options, further fueling segment growth. The ongoing development of combination therapies and the shift towards personalized medicine are expected to sustain the dominance of anti-VEGF drugs in the management of diabetic retinopathy.

Challenges and Opportunities

Challenges: High Cost of Advanced Treatment and Limited Accessibility

A major restraint in the diabetic retinopathy market is the high treatment cost of anti-VEGF therapy, laser photocoagulation, and vitreoretinal surgery. Access to these treatments remains a challenge to many patients, particularly in low-middle income (LMI) and developing countries, both of which are hindered by economic and healthcare resource limitations.

Furthermore, lack of awareness and insufficient screening programs often prevent early diagnosis and require continuous monitoring of these high-risk patients. It contributes to the necessity for government and private sector partnerships aimed at making healthcare affordable, increasing early detection initiatives, and improving access to affordability treatment options.

Opportunities: Advancements in AI-driven Diagnosis and Personalized Medicine

In the modern age, technological innovations specifically in AI are propelling the realm of diabetic retinopathy detection and management. Automated retinal imaging analysis with AI-based screening tools can provide early diagnosis, enhancing detection rates and decreasing the workload for ophthalmologists.

Moreover, personalized medicine characterized by targeted therapies and gene-based treatments is providing new avenues for effective and individualized treatment approaches. Market leaders will emerge from companies paying attention to AI-fueled diagnostic solutions and precision medicine.
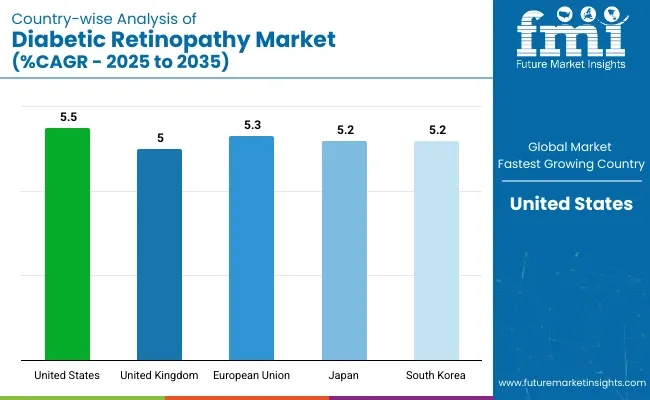
Country-wise Outlook

Country Wise Analysis Of Diabetic Retinopathy Market Cagr 2025 To 2035

United States

The United States diabetic retinopathy market is expected to grow at a significant rate during the forecast period due to high prevalence of diabetes and rising geriatric population. With millions of Americans suffering from diabetes and increasing demand for treatment options including anti-VEGF therapies, laser, and corticosteroids, the diabetes market is growing.

The increasing government-led diabetic eye care initiatives and expansion in ophthalmology-based research funding are some factors further contributing to the market growth. Moreover, technical innovation in the diagnostic tools such as Artificial Intelligence retinal screening and optical coherence tomography (OCT) is expected to a boost early detection rates, resulting better treatment efficacy and thus upping market opportunities.

Country CAGR (2025 to 2035)
United States 5.5%

United Kingdom

The diabetic retinopathy market is steadily rising in the UK owing to a rising population of diabetes along with a rise in awareness regarding early screening programs. The National Health Service (NHS) plays an important part in providing free eye screening (for diabetic retinopathy) for patients with diabetes to detect potentially sight-threatening eye conditions and treat them in good time.

The growth of the market is also influenced by advances in retinal imaging technologies, and the growing demand for the use of intravitreal injections. In addition, governmental measures to leverage AI solutions for diagnostic capabilities in clinical settings and boost patient outcomes are expected to drive the demand for new treatment methods.

Country CAGR (2025 to 2035)
United Kingdom 5.0%

European Union

Diabetic retinopathy is on the rise in countries like Germany, France, and Italy in the European Union, given better lifestyles and the enormous diabetic population. State-funded healthcare programs and nationwide diabetic screening initiatives have also helped in early diagnosis and management of the disease.

Firms are also focusing on new disease-modifying potential therapy agents, like sustained-release implants and gene therapy that will overhaul the market scenario. The growth and introduction of telemedicine and AI-driven analysis are also accelerating market growth by providing access to specialized ophthalmology care.

Region CAGR (2025 to 2035)
European Union 5.3%

Japan

The Japanese DR market is expanding at a rapid pace, which is primarily due to rapidly growing old population with diabetes comorbidity. The government scheme with national health policies for regional diabetic screenings and stepwise strategies to manage early-stage patients who would ultimately end up with visual impairment.

Advanced diagnostic techniques like ultra-wide field retinal imaging and AI-assisted detection are catching hold in the country. Also, the Japanese pharmaceutical companies are leading in the development of next-generation ophthalmic drugs and minimally invasive treatment options, which is expected to drive the market during the forecast period.

Country CAGR (2025 to 2035)
Japan 5.2%

South Korea

On the other hand, South Korea is anticipated to show good growth in the diabetic retinopathy market owing to the high prevalence of diabetes and rising investments in the healthcare infrastructure. The country’s health care system encourages early detection with routine eye screenings and AI-backed diagnostics.

In addition, South Korea is an emerging center for clinical research in ophthalmology, driving the quick adoption of new treatment solutions like stem cell therapy & advanced laser treatment. Government proactive initiatives to spread awareness and treat diabetes positively supports the market growth.

Country CAGR (2025 to 2035)
South Korea 5.2%

Competitive Outlook

The diabetic retinopathy market is growing rapidly, driven by rising incidence of diabetes, technological advances in diagnostic imaging, and increasing awareness of early detection of disease. The governments are also taking initiatives for healthcare and the increasing geriatric population and the high growth of healthcare infrastructure in developing countries are also driving the market.

Due to growing demand for effective management for diabetic retinopathy, leading participants are focusing on the development of alternative treatments for the management of diabetic retinopathy, which includes anti-VEGF drugs, corticosteroids, and laser therapy. Additionally, the AI-loaded diagnostic and telemedicine solutions are showing the way for better detection and approachability towards timely treatment.
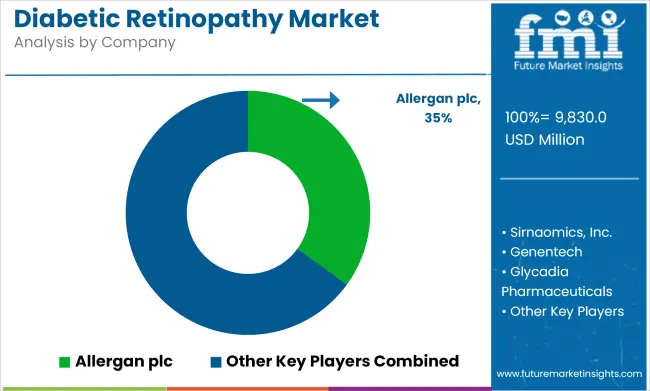
Key Company Insights

Diabetic Retinopathy Market Analysis By Company

Roche (20-24%)

With its first-in-class anti-VEGF drug, Lucentis, Roche holds a leading position in the Diabetic Retinopathy Market, where high efficacy preventing disease progression has been shown. Additionally, its focus on personalized medicine and AI-driven diagnostic solutions creates a compelling value proposition.

Novartis (16-20%)

Beovu, a novel anti-VEGF therapy that offers longer treatment intervals with improved patient compliance, is a stronghold company contender.

Bayer AG (12-16%)

Bayer's Eylea is now a standard therapy for diabetic retinopathy, supported by strong clinical efficacy and widespread use worldwide.

Regeneron Pharmaceuticals (10-14%)

Regeneron is also expanding its monoclonal antibody-based drug pipeline with a focus on ophthalmology to expand diabetic retinopathy therapy.

Alimera Sciences (6-10%)

The long-term corticosteroid therapy by Alimera Sciences with a sustained drug-release system, Iluvien, decreases the need for frequent injections.

Significant Other (25-35% Combined)

Many small and emerging players and biotech and pharmaceutical companies on the market include those who are working on gene therapy, regenerative medicine and the AI-based diagnostic company. Here are a few prominent players:

  • Oxurion NV - Develops new drug formulations for diabetic retinopathy patients venturing into vascular leakage and inflammatory treatments.
  • Aerpio Pharmaceuticals - Developing new therapeutics that stabilize retinal blood vessels.
  • Clearside Biomedical - Developer of ocular drug delivery systems to achieve targeted and sustained effects of therapeutics.
  • Kodiak Sciences - Drives biopharmaceutical development in long-acting anti-VEGF formulations.

Diabetic Retinopathy Industry Analysis by Top Investment Segments

By Type:

  • Proliferative
  • Non-proliferative

By Management:

  • Anti-VEGF
  • Intraocular Steroid Injection
  • Laser Surgery
  • Vitrectomy

By Region:

  • North America
  • Latin America
  • Western Europe
  • Eastern Europe
  • East Asia
  • South Asia Pacific
  • Middle East and Africa

Table of Content

  1. Executive Summary
  2. Industry Introduction, including Taxonomy and Market Definition
  3. Market Trends and Success Factors, including Macro-economic Factors, Market Dynamics, and Recent Industry Developments
  4. Global Market Demand Analysis 2020 to 2024 and Forecast 2025 to 2035, including Historical Analysis and Future Projections
  5. Pricing Analysis
  6. Global Market Analysis 2020 to 2024 and Forecast 2025 to 2035
    • Type
    • Management
  7. Global Market Analysis 2020 to 2024 and Forecast 2025 to 2035, By Type
    • Proliferative
    • Non-proliferative
  8. Global Market Analysis 2020 to 2024 and Forecast 2025 to 2035, By Management
    • Anti VEGF
    • Intraocular Steroid Injection
    • Laser Surgery
    • Vitrectomy
  9. Global Market Analysis 2020 to 2024 and Forecast 2025 to 2035, By Region
    • North America
    • Latin America
    • Western Europe
    • Eastern Europe
    • East Asia
    • South Asia Pacific
    • Middle East and Africa
  10. North America Sales Analysis 2020 to 2024 and Forecast 2025 to 2035, by Key Segments and Countries
  11. Latin America Sales Analysis 2020 to 2024 and Forecast 2025 to 2035, by Key Segments and Countries
  12. Western Europe Sales Analysis 2020 to 2024 and Forecast 2025 to 2035, by Key Segments and Countries
  13. Eastern Europe Sales Analysis 2020 to 2024 and Forecast 2025 to 2035, by Key Segments and Countries
  14. East Asia Sales Analysis 2020 to 2024 and Forecast 2025 to 2035, by Key Segments and Countries
  15. South Asia Pacific Sales Analysis 2020 to 2024 and Forecast 2025 to 2035, by Key Segments and Countries
  16. Middle East and Africa Sales Analysis 2020 to 2024 and Forecast 2025 to 2035, by Key Segments and Countries
  17. Sales Forecast 2025 to 2035 by Type and Management for 30 Countries
  18. Competition Outlook, including Market Structure Analysis, Company Share Analysis by Key Players, and Competition Dashboard
  19. Company Profile
    • Allergan plc
    • Oxurion
    • Sirnaomics, Inc.
    • Genentech
    • Glycadia Pharmaceuticals
    • Roche
    • Novartis
    • Bayer AG
    • Regeneron Pharmaceuticals
    • Alimera Sciences

List of Tables

  • Table 1: Global Market Value (US$ Million) Forecast by Region, 2025 to 2035
  • Table 2: Global Market Value (US$ Million) Forecast by Type, 2025 to 2035
  • Table 3: Global Market Value (US$ Million) Forecast by Management, 2025 to 2035
  • Table 4: North America Market Value (US$ Million) Forecast by Country, 2025 to 2035
  • Table 5: North America Market Value (US$ Million) Forecast by Type, 2025 to 2035
  • Table 6: North America Market Value (US$ Million) Forecast by Management, 2025 to 2035
  • Table 7: Latin America Market Value (US$ Million) Forecast by Country, 2025 to 2035
  • Table 8: Latin America Market Value (US$ Million) Forecast by Type, 2025 to 2035
  • Table 9: Latin America Market Value (US$ Million) Forecast by Management, 2025 to 2035
  • Table 10: Western Europe Market Value (US$ Million) Forecast by Country, 2025 to 2035
  • Table 11: Western Europe Market Value (US$ Million) Forecast by Type, 2025 to 2035
  • Table 12: Western Europe Market Value (US$ Million) Forecast by Management, 2025 to 2035
  • Table 13: Eastern Europe Market Value (US$ Million) Forecast by Country, 2025 to 2035
  • Table 14: Eastern Europe Market Value (US$ Million) Forecast by Type, 2025 to 2035
  • Table 15: Eastern Europe Market Value (US$ Million) Forecast by Management, 2025 to 2035
  • Table 16: South Asia and Pacific Market Value (US$ Million) Forecast by Country, 2025 to 2035
  • Table 17: South Asia and Pacific Market Value (US$ Million) Forecast by Type, 2025 to 2035
  • Table 18: South Asia and Pacific Market Value (US$ Million) Forecast by Management, 2025 to 2035
  • Table 19: East Asia Market Value (US$ Million) Forecast by Country, 2025 to 2035
  • Table 20: East Asia Market Value (US$ Million) Forecast by Type, 2025 to 2035
  • Table 21: East Asia Market Value (US$ Million) Forecast by Management, 2025 to 2035
  • Table 22: Middle East and Africa Market Value (US$ Million) Forecast by Country, 2025 to 2035
  • Table 23: Middle East and Africa Market Value (US$ Million) Forecast by Type, 2025 to 2035
  • Table 24: Middle East and Africa Market Value (US$ Million) Forecast by Management, 2025 to 2035

List of Figures

  • Figure 1: Global Market Value (US$ Million) by Type, 2025 to 2035
  • Figure 2: Global Market Value (US$ Million) by Management, 2025 to 2035
  • Figure 3: Global Market Value (US$ Million) by Region, 2025 to 2035
  • Figure 4: Global Market Value (US$ Million) Analysis by Region, 2020 to 2035
  • Figure 5: Global Market Value Share (%) and BPS Analysis by Region, 2025 to 2035
  • Figure 6: Global Market Y-o-Y Growth (%) Projections by Region, 2025 to 2035
  • Figure 7: Global Market Value (US$ Million) Analysis by Type, 2020 to 2035
  • Figure 8: Global Market Value Share (%) and BPS Analysis by Type, 2025 to 2035
  • Figure 9: Global Market Y-o-Y Growth (%) Projections by Type, 2025 to 2035
  • Figure 10: Global Market Value (US$ Million) Analysis by Management, 2020 to 2035
  • Figure 11: Global Market Value Share (%) and BPS Analysis by Management, 2025 to 2035
  • Figure 12: Global Market Y-o-Y Growth (%) Projections by Management, 2025 to 2035
  • Figure 13: Global Market Attractiveness by Type, 2025 to 2035
  • Figure 14: Global Market Attractiveness by Management, 2025 to 2035
  • Figure 15: Global Market Attractiveness by Region, 2025 to 2035
  • Figure 16: North America Market Value (US$ Million) by Type, 2025 to 2035
  • Figure 17: North America Market Value (US$ Million) by Management, 2025 to 2035
  • Figure 18: North America Market Value (US$ Million) by Country, 2025 to 2035
  • Figure 19: North America Market Value (US$ Million) Analysis by Country, 2020 to 2035
  • Figure 20: North America Market Value Share (%) and BPS Analysis by Country, 2025 to 2035
  • Figure 21: North America Market Y-o-Y Growth (%) Projections by Country, 2025 to 2035
  • Figure 22: North America Market Value (US$ Million) Analysis by Type, 2020 to 2035
  • Figure 23: North America Market Value Share (%) and BPS Analysis by Type, 2025 to 2035
  • Figure 24: North America Market Y-o-Y Growth (%) Projections by Type, 2025 to 2035
  • Figure 25: North America Market Value (US$ Million) Analysis by Management, 2020 to 2035
  • Figure 26: North America Market Value Share (%) and BPS Analysis by Management, 2025 to 2035
  • Figure 27: North America Market Y-o-Y Growth (%) Projections by Management, 2025 to 2035
  • Figure 28: North America Market Attractiveness by Type, 2025 to 2035
  • Figure 29: North America Market Attractiveness by Management, 2025 to 2035
  • Figure 30: North America Market Attractiveness by Country, 2025 to 2035
  • Figure 31: Latin America Market Value (US$ Million) by Type, 2025 to 2035
  • Figure 32: Latin America Market Value (US$ Million) by Management, 2025 to 2035
  • Figure 33: Latin America Market Value (US$ Million) by Country, 2025 to 2035
  • Figure 34: Latin America Market Value (US$ Million) Analysis by Country, 2020 to 2035
  • Figure 35: Latin America Market Value Share (%) and BPS Analysis by Country, 2025 to 2035
  • Figure 36: Latin America Market Y-o-Y Growth (%) Projections by Country, 2025 to 2035
  • Figure 37: Latin America Market Value (US$ Million) Analysis by Type, 2020 to 2035
  • Figure 38: Latin America Market Value Share (%) and BPS Analysis by Type, 2025 to 2035
  • Figure 39: Latin America Market Y-o-Y Growth (%) Projections by Type, 2025 to 2035
  • Figure 40: Latin America Market Value (US$ Million) Analysis by Management, 2020 to 2035
  • Figure 41: Latin America Market Value Share (%) and BPS Analysis by Management, 2025 to 2035
  • Figure 42: Latin America Market Y-o-Y Growth (%) Projections by Management, 2025 to 2035
  • Figure 43: Latin America Market Attractiveness by Type, 2025 to 2035
  • Figure 44: Latin America Market Attractiveness by Management, 2025 to 2035
  • Figure 45: Latin America Market Attractiveness by Country, 2025 to 2035
  • Figure 46: Western Europe Market Value (US$ Million) by Type, 2025 to 2035
  • Figure 47: Western Europe Market Value (US$ Million) by Management, 2025 to 2035
  • Figure 48: Western Europe Market Value (US$ Million) by Country, 2025 to 2035
  • Figure 49: Western Europe Market Value (US$ Million) Analysis by Country, 2020 to 2035
  • Figure 50: Western Europe Market Value Share (%) and BPS Analysis by Country, 2025 to 2035
  • Figure 51: Western Europe Market Y-o-Y Growth (%) Projections by Country, 2025 to 2035
  • Figure 52: Western Europe Market Value (US$ Million) Analysis by Type, 2020 to 2035
  • Figure 53: Western Europe Market Value Share (%) and BPS Analysis by Type, 2025 to 2035
  • Figure 54: Western Europe Market Y-o-Y Growth (%) Projections by Type, 2025 to 2035
  • Figure 55: Western Europe Market Value (US$ Million) Analysis by Management, 2020 to 2035
  • Figure 56: Western Europe Market Value Share (%) and BPS Analysis by Management, 2025 to 2035
  • Figure 57: Western Europe Market Y-o-Y Growth (%) Projections by Management, 2025 to 2035
  • Figure 58: Western Europe Market Attractiveness by Type, 2025 to 2035
  • Figure 59: Western Europe Market Attractiveness by Management, 2025 to 2035
  • Figure 60: Western Europe Market Attractiveness by Country, 2025 to 2035
  • Figure 61: Eastern Europe Market Value (US$ Million) by Type, 2025 to 2035
  • Figure 62: Eastern Europe Market Value (US$ Million) by Management, 2025 to 2035
  • Figure 63: Eastern Europe Market Value (US$ Million) by Country, 2025 to 2035
  • Figure 64: Eastern Europe Market Value (US$ Million) Analysis by Country, 2020 to 2035
  • Figure 65: Eastern Europe Market Value Share (%) and BPS Analysis by Country, 2025 to 2035
  • Figure 66: Eastern Europe Market Y-o-Y Growth (%) Projections by Country, 2025 to 2035
  • Figure 67: Eastern Europe Market Value (US$ Million) Analysis by Type, 2020 to 2035
  • Figure 68: Eastern Europe Market Value Share (%) and BPS Analysis by Type, 2025 to 2035
  • Figure 69: Eastern Europe Market Y-o-Y Growth (%) Projections by Type, 2025 to 2035
  • Figure 70: Eastern Europe Market Value (US$ Million) Analysis by Management, 2020 to 2035
  • Figure 71: Eastern Europe Market Value Share (%) and BPS Analysis by Management, 2025 to 2035
  • Figure 72: Eastern Europe Market Y-o-Y Growth (%) Projections by Management, 2025 to 2035
  • Figure 73: Eastern Europe Market Attractiveness by Type, 2025 to 2035
  • Figure 74: Eastern Europe Market Attractiveness by Management, 2025 to 2035
  • Figure 75: Eastern Europe Market Attractiveness by Country, 2025 to 2035
  • Figure 76: South Asia and Pacific Market Value (US$ Million) by Type, 2025 to 2035
  • Figure 77: South Asia and Pacific Market Value (US$ Million) by Management, 2025 to 2035
  • Figure 78: South Asia and Pacific Market Value (US$ Million) by Country, 2025 to 2035
  • Figure 79: South Asia and Pacific Market Value (US$ Million) Analysis by Country, 2020 to 2035
  • Figure 80: South Asia and Pacific Market Value Share (%) and BPS Analysis by Country, 2025 to 2035
  • Figure 81: South Asia and Pacific Market Y-o-Y Growth (%) Projections by Country, 2025 to 2035
  • Figure 82: South Asia and Pacific Market Value (US$ Million) Analysis by Type, 2020 to 2035
  • Figure 83: South Asia and Pacific Market Value Share (%) and BPS Analysis by Type, 2025 to 2035
  • Figure 84: South Asia and Pacific Market Y-o-Y Growth (%) Projections by Type, 2025 to 2035
  • Figure 85: South Asia and Pacific Market Value (US$ Million) Analysis by Management, 2020 to 2035
  • Figure 86: South Asia and Pacific Market Value Share (%) and BPS Analysis by Management, 2025 to 2035
  • Figure 87: South Asia and Pacific Market Y-o-Y Growth (%) Projections by Management, 2025 to 2035
  • Figure 88: South Asia and Pacific Market Attractiveness by Type, 2025 to 2035
  • Figure 89: South Asia and Pacific Market Attractiveness by Management, 2025 to 2035
  • Figure 90: South Asia and Pacific Market Attractiveness by Country, 2025 to 2035
  • Figure 91: East Asia Market Value (US$ Million) by Type, 2025 to 2035
  • Figure 92: East Asia Market Value (US$ Million) by Management, 2025 to 2035
  • Figure 93: East Asia Market Value (US$ Million) by Country, 2025 to 2035
  • Figure 94: East Asia Market Value (US$ Million) Analysis by Country, 2020 to 2035
  • Figure 95: East Asia Market Value Share (%) and BPS Analysis by Country, 2025 to 2035
  • Figure 96: East Asia Market Y-o-Y Growth (%) Projections by Country, 2025 to 2035
  • Figure 97: East Asia Market Value (US$ Million) Analysis by Type, 2020 to 2035
  • Figure 98: East Asia Market Value Share (%) and BPS Analysis by Type, 2025 to 2035
  • Figure 99: East Asia Market Y-o-Y Growth (%) Projections by Type, 2025 to 2035
  • Figure 100: East Asia Market Value (US$ Million) Analysis by Management, 2020 to 2035
  • Figure 101: East Asia Market Value Share (%) and BPS Analysis by Management, 2025 to 2035
  • Figure 102: East Asia Market Y-o-Y Growth (%) Projections by Management, 2025 to 2035
  • Figure 103: East Asia Market Attractiveness by Type, 2025 to 2035
  • Figure 104: East Asia Market Attractiveness by Management, 2025 to 2035
  • Figure 105: East Asia Market Attractiveness by Country, 2025 to 2035
  • Figure 106: Middle East and Africa Market Value (US$ Million) by Type, 2025 to 2035
  • Figure 107: Middle East and Africa Market Value (US$ Million) by Management, 2025 to 2035
  • Figure 108: Middle East and Africa Market Value (US$ Million) by Country, 2025 to 2035
  • Figure 109: Middle East and Africa Market Value (US$ Million) Analysis by Country, 2020 to 2035
  • Figure 110: Middle East and Africa Market Value Share (%) and BPS Analysis by Country, 2025 to 2035
  • Figure 111: Middle East and Africa Market Y-o-Y Growth (%) Projections by Country, 2025 to 2035
  • Figure 112: Middle East and Africa Market Value (US$ Million) Analysis by Type, 2020 to 2035
  • Figure 113: Middle East and Africa Market Value Share (%) and BPS Analysis by Type, 2025 to 2035
  • Figure 114: Middle East and Africa Market Y-o-Y Growth (%) Projections by Type, 2025 to 2035
  • Figure 115: Middle East and Africa Market Value (US$ Million) Analysis by Management, 2020 to 2035
  • Figure 116: Middle East and Africa Market Value Share (%) and BPS Analysis by Management, 2025 to 2035
  • Figure 117: Middle East and Africa Market Y-o-Y Growth (%) Projections by Management, 2025 to 2035
  • Figure 118: Middle East and Africa Market Attractiveness by Type, 2025 to 2035
  • Figure 119: Middle East and Africa Market Attractiveness by Management, 2025 to 2035
  • Figure 120: Middle East and Africa Market Attractiveness by Country, 2025 to 2035

Frequently Asked Questions

What was the overall size of the diabetic retinopathy market in 2025?

The overall market size for the diabetic retinopathy market was USD 9,830 million in 2025.

How big is the diabetic retinopathy market expected to be in 2035?

The diabetic retinopathy market is expected to reach USD 18,259.3 million in 2035.

What is the expected CAGR for the diabetic retinopathy market from 2025 to 2035?

The diabetic retinopathy market is expected to grow at a CAGR of 5.8% during the forecast period.

What will drive the demand for the diabetic retinopathy market during the forecast period?

The demand for the diabetic retinopathy market will be driven by the increasing prevalence of diabetes, advancements in diagnostic technologies, rising awareness about early detection and treatment, improved healthcare infrastructure, and the growing adoption of innovative therapies.

Which are the top five countries contributing to the diabetic retinopathy market?

The top five countries driving the development of the diabetic retinopathy market are the USA, China, India, Germany, and Japan.

Explore Similar Insights

Future Market Insights

Diabetic Retinopathy Market