Reports

- Global Locations -

Headquarters

Future Market Insights, Inc.

Christiana Corporate, 200
Continental Drive, Suite 401,
Newark, Delaware - 19713,
United States

T: +1-845-579-5705

Americas

Future Market Insights, Inc.

616 Corporate Way, Suite 2-9018,
Valley Cottage, NY 10989, United States

T: +1-347-918-3531

MEA

Future Market Insights

1602-6 Jumeirah Bay X2 Tower, Plot No: JLT-PH2-X2A,
Jumeirah Lakes Towers, Dubai,
United Arab Emirates

Europe

Future Market Insights

3rd Floor, 207 Regent Street,
W1B 3HH London
United Kingdom

T: + 44 (0) 20 8123 9659
D: +44 (0) 20 3287 4268

Asia Pacific

Future Market Insights

IndiaLand Global Tech Park, Unit UG-1, Behind Grand HighStreet, Phase 1, Hinjawadi, MH, Pune – 411057, India

Diabetic Shoes Market Outlook

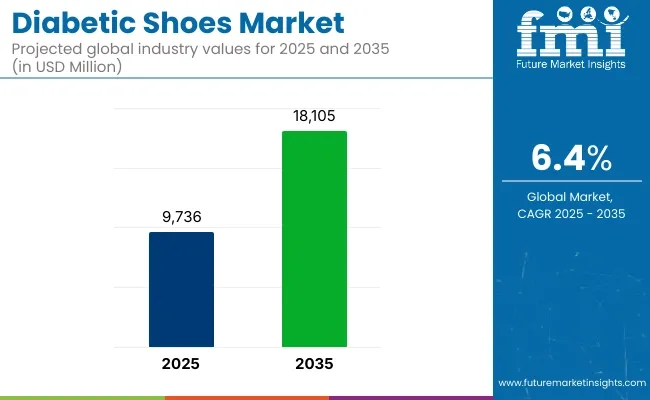
The diabetic shoes market size is projected to be valued at US$ 8.6 billion in 2023, and is expected to rise to US$ 16.0 billion by 2033. The sales of diabetic shoes are expected to expand at a significant CAGR of 6.4% during the forecast period.

Various Factors Propelling the Demand for Diabetic Shoes are

To minimize the danger of the consequences of diabetic foot ulcers and limb amputation, individuals are moving their choice toward preventative care, as the burden of diabetes affects many people worldwide.

The World Health Organization reports that more than 50% of diabetics who are at risk for limb injuries also have peripheral neuropathies, which has the additional consequence of raising mortality rates globally.

Since more diabetic patients are becoming aware of the benefits of wearing diabetic footwear, the market for diabetic shoes is expanding significantly on a global scale. Customized and predesigned diabetic shoes with certain key features are growing in popularity among diabetic patients worldwide.

The global population's unhealthy and hectic lifestyle is further boosting the demand for different medical footwear. In addition, the rising elderly population worldwide is probably going to elevate market growth shortly.

Customers are now being encouraged to purchase diabetic shoes and other diabetic products online, due to the existence of an efficient online platform by key players and increased internet penetration.

Long-term market expansion is strongly supported by expanding infrastructure facilities associated with distribution outlets and specialty shoe shops.

As a result of advancements in the protective footwear market and increased research and development activities to combat diabetic foot ulcers, the global medical footwear market is likely to grow significantly during the forecast period.

Several government and non-government organizations are researching to better understand diabetic foot ulcers and their patterns. For example, the National Institutes of Health-funded Diabetic Foot Consortium (DFC) was established in 2020 to study diabetic foot ulcers.

The development of personalized and stylish diabetic footwear by leading manufacturers to keep up with the current fashion trend is playing a significant role in the market's expansion.

Attribute Details
Diabetic Shoes Market Estimated Size (2023) US$ 8.6 billion
Diabetic Shoes Market CAGR (2023 to 2033) 6.4%
Diabetic Shoes Market Forecasted Size (2033) US$ 16.0 billion

Don't pay for what you don't need

Customize your report by selecting specific countries or regions and save 30%!

2017 to 2022 Global Diabetic Shoes Market Outlook Compared To 2023 to 2033 Forecast

The global demand for diabetic shoes is predicted to witness a healthy CAGR of 6.4% between 2023 and 2033, in comparison to the 4.1% CAGR registered from 2017 to 2022. Growth in the diabetic shoes market is attributed to the increase in the prevalence of diabetes, growing awareness about the availability of medical footwear products across developing regions, increasing need for better foot care, new product launches, and favorable government support.

Diabetic shoes are unique footwear products designed to preserve diabetic feet, as well as to reduce skin breakdown due to neuropathy, impaired mobility, and deformities. These diabetic shoes have flexible uppers and an extra-thickness design for a pressure-free fit. They provide better motion control, prevent skin breakdown, promote circulation, reduce calluses formation, and thus eliminate the risk of foot problems in high-pressure areas of the foot.

The rapid surge in cases of diabetes and diabetic ulcers is a significant factor boosting growth of the market. According to the International Diabetes Federation (IDF), diabetic foot and lower limb complications have become serious health problems, affecting 40 to 60 million people with diabetes globally. These health conditions (chronic ulcers and amputations) significantly reduce the quality of life and increase the risk of early death. To counter this and minimize the risk of infections, people use preventive healthcare products like diabetic shoes. This is likely to continue to expand the global diabetic shoes market size during the forecast period.

Comparative View of the Diabetic Shoes Market  

Diabetic Shoes Market:

Attributes Diabetic Shoes Market
CAGR (2023 to 2033) 6.4%
Market Value (2026) US$ 10.33 billion
Growth Factor Increasing numbers of obese people are wearing specialist footwear to reduce their pain and get relief from flat foot pain, which is driving market demand.
Opportunity It is anticipated that an increase in life expectancy and more awareness about preventing obesity-related hazards, including cardiovascular disease and diabetes, are likely to positively affect product demand.
Key Trends The choice of safer options is shifting as concerns about the adverse effects of synthetic drugs grow.

Diabetes Care Devices Market:

Attributes Diabetes Care Devices Market
CAGR (2023 to 2033) 6.3%
Market Value (2026) US$ 15.05 billion
Growth Factor The market for diabetes care devices is expected to develop as a result of rising health consciousness and an increase in the number of people with diabetes.
Opportunity The market for diabetes care devices is expected to rise as a result of increasing consumer interest in diabetes monitoring devices and untapped markets in developing nations.
Key Trends Recent market developments, including the release of expensive insulin pumps and pens, are driving demand for diabetes treatment devices.

Pet Diabetes Care Devices Market:

Attributes Pet Diabetes Care Devices Market
CAGR (2023 to 2033) 6.5%
Market Value (2026) US$ 2.74 billion
Growth Factor The market is expanding due to the rising number of pets with diabetes and the incorrect biological reaction to it.
Opportunity Opportunities are likely to increase as pet obesity rates rise.
Key Trends Increasing costs for pet healthcare are going to continue to be a significant market trend.
Sabyasachi Ghosh
Sabyasachi Ghosh

Principal Consultant

Talk to Analyst

Find your sweet spots for generating winning opportunities in this market.

Category-wise Insights of Diabetic Shoes

Dress Shoe remains at the Top of the Table with a growth rate of 6.4%

The global market for diabetic shoes is divided into categories based on product type, including dress shoes, walking shoes, and running shoes. Due to the quick adoption of diabetic dress shoes by customers, the dress shoes segment had a prominent share of all of these at 43.4% in 2021, and is anticipated to expand at a significant rate throughout the forecast period.

As the market is significantly expanding, diabetic shoes are becoming well-liked among working professionals in industrialized nations. Additionally, these shoes offer additional defense against foot injuries, lowering the risk of fungus infections. It is anticipated that the launch of diabetic shoes made of cutting-edge materials like cotton, nylon, and leather is likely to present manufacturers with lucrative business opportunities.

Women are Highly Adopting Diabetic Shoes, which is leading them in the End-user Segment

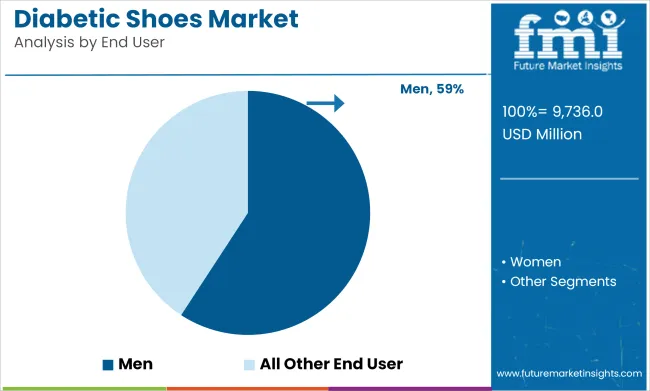
Based on end-user, women are the front-runner of the segment with a growth rate of 5.8%. Women typically have higher SHBG levels than men do, and low SHBG concentrations may put women at even great risk for developing diabetes than men do. Women are more likely to get diabetes, hence they spend money on caring for and maintaining their bodies. In addition, it is anticipated that during the forecast period, women in developing regions are more likely to become aware of diabetes and its effects on their health due to rising awareness and campaigns.

Regional Analysis

The United States holds a Significant Share of the Global Market owing to Higher Spending on Healthcare Solutions

Given the high prevalence of both type 1 and type 2 diabetes among the population in the United States, as well as the high consumption of such products in the region, the North America market holds a prominent share of the global market. According to information provided by the United States Department of Health and Human Resources, 34.2 million Americans had diabetes as of 2018. Additionally, the growing consciousness of people about health and hygiene, as well as healthcare product spending, contribute to the region's higher sales of diabetic shoes.

United States Market Size (US$ million/billion) by End of Forecast Period (2033) US$ 5.7 billion
United States Market Absolute Dollar Growth (US$ million/billion) US$ 2.5 billion
CAGR % 2017 to 2022 9.7%
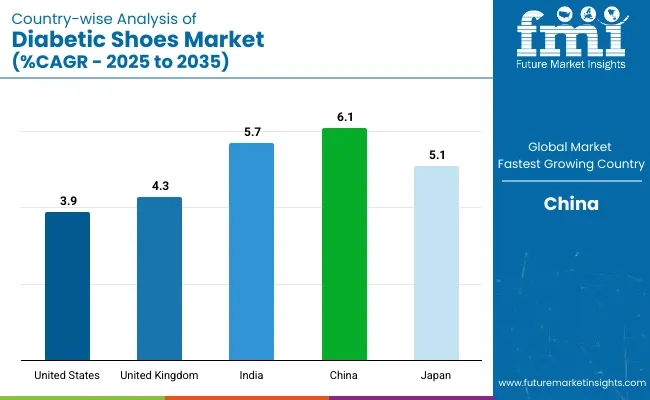
CAGR % 2023 to End of Forecast (2033) 6.1%

The United Kingdom Market to Witness Substantial Growth owing to Increasing Health Awareness

With the prevalence of high levels of health awareness among the populace, the availability of a variety of diabetic shoes, the growth of government initiatives to lessen the burden of diabetes, and the significant presence of top diabetic shoe manufacturers, sales of diabetic shoes are predicted to increase across the United Kingdom at a moderate CAGR of 5.4% during the assessment period.

Around 3.9 million people in the United Kingdom had diabetes in 2019, and 90% of those had type 2 diabetes, according to Diabetes United kingdom, a British diabetic association.

The market for diabetic footwear shoes in the United Kingdom is also likely to see growth opportunities due to rising consumer expenditure on diabetic shoe purchases made online and the growing demand for diabetic shoes for women.

United Kingdom Market Size (US$ million/billion) by End of Forecast Period (2033) US$ 673.3 million
United Kingdom Market Absolute Dollar Growth (US$ million/billion) US$ 277.1 million
CAGR % 2017 to 2022 8.8%
CAGR % 2023 to End of Forecast (2033) 5.4%

India and China may Emerge as the Most Lucrative Market in the Region

A hectic lifestyle and changing eating habits have led to an increase in the prevalence of diabetes and obesity. Growing consumer knowledge of diabetes and related illnesses is predicted to open up significant business prospects in the region's developing nations, including China and India.

India region has experienced a significant increase, which is related to the high number of footwear items imported and shows rising demand for diabetic shoes in the area. The World Bank Organization reports that the value of India's footwear imports from Italy in 2018 was US$ 23.07 million. The population's increasing interest in sports and leisure activities is another factor boosting the need for diabetic shoes in the area.

Due to the prevalence of type 2 diabetes, which ranges from about 2% in the People's Republic of China to a wide spectrum of adult populations, several leading businesses are investing in the Asia Pacific area. The diabetic shoes market is anticipated to expand in other areas as well, due to an increase in the elderly population and the introduction of better diabetic footwear.

China Market Size (US$ million/billion) by End of Forecast Period (2033) US$ 1.1 billion
China Market Absolute Dollar Growth (US$ million/billion) US$ 492.4 million
CAGR % 2017 to 2022 9.3%
CAGR % 2023 to End of Forecast (2033) 5.8%

Get the data you need at a Fraction of the cost

Personalize your report by choosing insights you need
and save 40%!

Competitive Landscape

The top competitors in the diabetic footwear industry have made it a priority to offer consumers specialized solutions as one of their primary methods to capture a sizeable portion of the market. The leading players have also benefited from strategies like product launches and acquisitions to increase their market position in the diabetic footwear industry.

Latest Developments:

  • Diabetic footwear was introduced in December 2021 by Casa Everz Gmbh, the proprietor of the German footwear company Von Wellx. Based on internationally patented reaction zones technology, these diabetes sneakers. Famous doctor Walter Mauch is credited for creating it.
  • Anodyne, LLC, a significant supplier of clinical footwear products frequently prescribed for diabetic patients, reported in May 2022 that HealthEdge Investment Partners, LLC, a private equity group with a focus on the healthcare industry, has completed an investment in the business.
  • Enovis, a multinational provider of medical technology, bought 360 Med Care Pty Ltd, an orthopaedic company with headquarters in Australia, in May 2022. Throughout the orthopaedic care process, the objective is to enhance patient outcomes.

Key Players in the Market Include

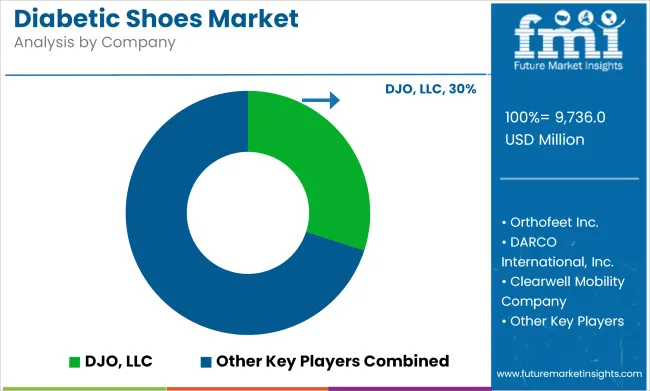
Asics, Drewshoe, Incorporated, Orthofeet Inc., DARCO International, Inc., Clearwell Mobility Company, Supad, Aetrex Worldwide, Inc., Gravity Defyer Corp., Kinetec Medical Products Ltd, Horng Shin Footwear Co., Watts Footwear, DJO, LLC (Dr. Comfort), Advance Diabetic Solution, Dr. Zen Products, Inc., and Sensoria Health

Scope of the Report

Attribute Details
Growth Rate CAGR of 6.4% from 2023 to 2033
Base Year of Estimation 2023
Historical Data 2017 to 2022
Forecast Period 2023 to 2033
Quantitative Units Revenue in US$ billion and Volume in Units and F-CAGR from 2022 to 2032
Report Coverage Revenue Forecast, Volume Forecast, Company Ranking, Competitive Landscape, growth factors, Trends, and Pricing Analysis
Key Segments Covered
  • Product Type
  • Patient Type
  • Width
  • Sales Channel
  • End User
  • By Region
Regions Covered
  • North America
  • Latin America
  • Europe
  • East Asia
  • South Asia
  • The Middle East & Africa
  • Oceania
Key Countries Profiled
  • United States
  • Canada
  • Brazil
  • Mexico
  • Germany
  • Italy
  • France
  • United Kingdom
  • Spain
  • Russia
  • China
  • Japan
  • India
  • GCC Countries
  • Australia
Key Companies Profiled Asics, Drewshoe, Incorporated, Orthofeet Inc., DARCO International, Inc., Clearwell Mobility Company, Supad, Aetrex Worldwide, Inc., Gravity Defyer Corp., Kinetec Medical Products Ltd, Horng Shin Footwear Co., Watts Footwear, DJO, LLC (Dr. Comfort), Advance Diabetic Solution, Dr. Zen Products, Inc., and Sensoria Health
Customization & Pricing Available upon Request

Key Segments Covered in the Diabetic Shoes Market Report

By Product Type:

  • Dress Shoes
  • Running Shoes
  • Strolling Shoes
  • Others

By Patient Type:

  • Outpatient
  • Inpatient

By End User:

  • Men
  • Women

By Width:

  • Narrow
  • Medium
  • Wide
  • Others

By Sales Channel:

  • Direct Sales
  • Footwear Specialty Stores
  • Medical & Healthcare Centers
  • Online Retailers
  • Mono-brand Stores
  • Other Sales Channel

By Region:

  • North America
  • Latin America
  • Western Europe
  • Eastern Europe
  • Asia Pacific excluding Japan (APEJ)
  • Japan
  • The Middle East & Africa (MEA)

Frequently Asked Questions

How Big will be the Worldwide Diabetic Shoes market by the end of 2023?

The worldwide diabetic shoes market is expected to be valued at US$ 8.6 billion in 2023.

Who are the leading Diabetic Shoes Industry Players?

Asics, Drewshoe, Incorporated, and Orthofeet Inc., are the leading diabetic shoes industry players.

What is the growth forecast for Diabetic Shoes Industry from 2023 to 2033?

The diabetic shoes industry is set to surge at a CAGR of 6.4% from 2023 to 2033.

What is United States’ expected revenue in the Diabetic Shoes market until 2033?

United States is anticipated to generate US$ 5.7 billion revenue by 2033.

Which is the top trend in the Diabetic Shoes Market?

Rising life expectancy and greater awareness of obesity's risks are expected to boost product demand.

Table of Content

1. Executive Summary | Diabetic Shoes Market

    1.1. Global Market Outlook

    1.2. Demand-side Trends

    1.3. Supply-side Trends

    1.4. Technology Roadmap Analysis

    1.5. Analysis and Recommendations

2. Market Overview

    2.1. Market Coverage / Taxonomy

    2.2. Market Definition / Scope / Limitations

3. Market Background

    3.1. Market Dynamics

        3.1.1. Drivers

        3.1.2. Restraints

        3.1.3. Opportunity

        3.1.4. Trends

    3.2. Scenario Forecast

        3.2.1. Demand in Optimistic Scenario

        3.2.2. Demand in Likely Scenario

        3.2.3. Demand in Conservative Scenario

    3.3. Opportunity Map Analysis

    3.4. Product Life Cycle Analysis

    3.5. Supply Chain Analysis

        3.5.1. Supply Side Participants and their Roles

            3.5.1.1. Producers

            3.5.1.2. Mid-Level Participants (Traders/ Agents/ Brokers)

            3.5.1.3. Wholesalers and Distributors

        3.5.2. Value Added and Value Created at Node in the Supply Chain

        3.5.3. List of Raw Material Suppliers

        3.5.4. List of Existing and Potential Buyer’s

    3.6. Investment Feasibility Matrix

    3.7. Value Chain Analysis

        3.7.1. Profit Margin Analysis

        3.7.2. Wholesalers and Distributors

        3.7.3. Retailers

    3.8. PESTLE and Porter’s Analysis

    3.9. Regulatory Landscape

        3.9.1. By Key Regions

        3.9.2. By Key Countries

    3.10. Regional Parent Market Outlook

    3.11. Production and Consumption Statistics

    3.12. Import and Export Statistics

4. Global Market Analysis 2017 to 2022 and Forecast, 2023 to 2033

    4.1. Historical Market Size Value (US$ Million) & Volume (Units) Analysis, 2017 to 2022

    4.2. Current and Future Market Size Value (US$ Million) & Volume (Units) Projections, 2023 to 2033

        4.2.1. Y-o-Y Growth Trend Analysis

        4.2.2. Absolute $ Opportunity Analysis

5. Global Market Analysis 2017 to 2022 and Forecast 2023 to 2033, By Product Type

    5.1. Introduction / Key Findings

    5.2. Historical Market Size Value (US$ Million) & Volume (Units) Analysis By Product Type, 2017 to 2022

    5.3. Current and Future Market Size Value (US$ Million) & Volume (Units) Analysis and Forecast By Product Type, 2023 to 2033

        5.3.1. Dress Shoes

        5.3.2. Running Shoes

        5.3.3. Strolling Shoes

        5.3.4. Others

    5.4. Y-o-Y Growth Trend Analysis By Product Type, 2017 to 2022

    5.5. Absolute $ Opportunity Analysis By Product Type, 2023 to 2033

6. Global Market Analysis 2017 to 2022 and Forecast 2023 to 2033, By Patient Type

    6.1. Introduction / Key Findings

    6.2. Historical Market Size Value (US$ Million) & Volume (Units) Analysis By Patient Type, 2017 to 2022

    6.3. Current and Future Market Size Value (US$ Million) & Volume (Units) Analysis and Forecast By Patient Type, 2023 to 2033

        6.3.1. Outpatient

        6.3.2. Inpatient

    6.4. Y-o-Y Growth Trend Analysis By Patient Type, 2017 to 2022

    6.5. Absolute $ Opportunity Analysis By Patient Type, 2023 to 2033

7. Global Market Analysis 2017 to 2022 and Forecast 2023 to 2033, By End User

    7.1. Introduction / Key Findings

    7.2. Historical Market Size Value (US$ Million) & Volume (Units) Analysis By End User, 2017 to 2022

    7.3. Current and Future Market Size Value (US$ Million) & Volume (Units) Analysis and Forecast By End User, 2023 to 2033

        7.3.1. Men

        7.3.2. Women

    7.4. Y-o-Y Growth Trend Analysis By End User, 2017 to 2022

    7.5. Absolute $ Opportunity Analysis By End User, 2023 to 2033

8. Global Market Analysis 2017 to 2022 and Forecast 2023 to 2033, By Width

    8.1. Introduction / Key Findings

    8.2. Historical Market Size Value (US$ Million) & Volume (Units) Analysis By Width, 2017 to 2022

    8.3. Current and Future Market Size Value (US$ Million) & Volume (Units) Analysis and Forecast By Width, 2023 to 2033

        8.3.1. Narrow

        8.3.2. Medium

        8.3.3. Wide

        8.3.4. Others

    8.4. Y-o-Y Growth Trend Analysis By Width, 2017 to 2022

    8.5. Absolute $ Opportunity Analysis By Width, 2023 to 2033

9. Global Market Analysis 2017 to 2022 and Forecast 2023 to 2033, By Sales Channel

    9.1. Introduction / Key Findings

    9.2. Historical Market Size Value (US$ Million) & Volume (Units) Analysis By Sales Channel, 2017 to 2022

    9.3. Current and Future Market Size Value (US$ Million) & Volume (Units) Analysis and Forecast By Sales Channel, 2023 to 2033

        9.3.1. Direct Sales

        9.3.2. Footwear Specialty Stores

        9.3.3. Medical & Healthcare Centres

        9.3.4. Online Retailers

        9.3.5. Mono-Brand Stores

        9.3.6. Other Sales Channel

    9.4. Y-o-Y Growth Trend Analysis By Sales Channel, 2017 to 2022

    9.5. Absolute $ Opportunity Analysis By Sales Channel, 2023 to 2033

10. Global Market Analysis 2017 to 2022 and Forecast 2023 to 2033, By Region

    10.1. Introduction

    10.2. Historical Market Size Value (US$ Million) & Volume (Units) Analysis By Region, 2017 to 2022

    10.3. Current Market Size Value (US$ Million) & Volume (Units) Analysis and Forecast By Region, 2023 to 2033

        10.3.1. North America

        10.3.2. Latin America

        10.3.3. Europe

        10.3.4. East Asia

        10.3.5. South Asia

        10.3.6. Oceania

        10.3.7. Middle East and Africa

    10.4. Market Attractiveness Analysis By Region

11. North America Market Analysis 2017 to 2022 and Forecast 2023 to 2033, By Country

    11.1. Historical Market Size Value (US$ Million) & Volume (Units) Trend Analysis By Market Taxonomy, 2017 to 2022

    11.2. Market Size Value (US$ Million) & Volume (Units) Forecast By Market Taxonomy, 2023 to 2033

        11.2.1. By Country

            11.2.1.1. USA

            11.2.1.2. Canada

        11.2.2. By Product Type

        11.2.3. By Patient Type

        11.2.4. By End User

        11.2.5. By Width

        11.2.6. By Sales Channel

    11.3. Market Attractiveness Analysis

        11.3.1. By Country

        11.3.2. By Product Type

        11.3.3. By Patient Type

        11.3.4. By End User

        11.3.5. By Width

        11.3.6. By Sales Channel

    11.4. Key Takeaways

12. Latin America Market Analysis 2017 to 2022 and Forecast 2023 to 2033, By Country

    12.1. Historical Market Size Value (US$ Million) & Volume (Units) Trend Analysis By Market Taxonomy, 2017 to 2022

    12.2. Market Size Value (US$ Million) & Volume (Units) Forecast By Market Taxonomy, 2023 to 2033

        12.2.1. By Country

            12.2.1.1. Brazil

            12.2.1.2. Mexico

            12.2.1.3. Argentina

            12.2.1.4. Rest of Latin America

        12.2.2. By Product Type

        12.2.3. By Patient Type

        12.2.4. By End User

        12.2.5. By Width

        12.2.6. By Sales Channel

    12.3. Market Attractiveness Analysis

        12.3.1. By Country

        12.3.2. By Product Type

        12.3.3. By Patient Type

        12.3.4. By End User

        12.3.5. By Width

        12.3.6. By Sales Channel

    12.4. Key Takeaways

13. Europe Market Analysis 2017 to 2022 and Forecast 2023 to 2033, By Country

    13.1. Historical Market Size Value (US$ Million) & Volume (Units) Trend Analysis By Market Taxonomy, 2017 to 2022

    13.2. Market Size Value (US$ Million) & Volume (Units) Forecast By Market Taxonomy, 2023 to 2033

        13.2.1. By Country

            13.2.1.1. Germany

            13.2.1.2. France

            13.2.1.3. Italy

            13.2.1.4. United kingdom

            13.2.1.5. Spain

            13.2.1.6. BENELUX

            13.2.1.7. Russia

            13.2.1.8. Rest of Europe

        13.2.2. By Product Type

        13.2.3. By Patient Type

        13.2.4. By End User

        13.2.5. By Width

        13.2.6. By Sales Channel

    13.3. Market Attractiveness Analysis

        13.3.1. By Country

        13.3.2. By Product Type

        13.3.3. By Patient Type

        13.3.4. By End User

        13.3.5. By Width

        13.3.6. By Sales Channel

    13.4. Key Takeaways

14. East Asia Market Analysis 2017 to 2022 and Forecast 2023 to 2033, By Country

    14.1. Historical Market Size Value (US$ Million) & Volume (Units) Trend Analysis By Market Taxonomy, 2017 to 2022

    14.2. Market Size Value (US$ Million) & Volume (Units) Forecast By Market Taxonomy, 2023 to 2033

        14.2.1. By Country

            14.2.1.1. China

            14.2.1.2. Japan

            14.2.1.3. South Korea

        14.2.2. By Product Type

        14.2.3. By Patient Type

        14.2.4. By End User

        14.2.5. By Width

        14.2.6. By Sales Channel

    14.3. Market Attractiveness Analysis

        14.3.1. By Country

        14.3.2. By Product Type

        14.3.3. By Patient Type

        14.3.4. By End User

        14.3.5. By Width

        14.3.6. By Sales Channel

    14.4. Key Takeaways

15. South Asia Market Analysis 2017 to 2022 and Forecast 2023 to 2033, By Country

    15.1. Historical Market Size Value (US$ Million) & Volume (Units) Trend Analysis By Market Taxonomy, 2017 to 2022

    15.2. Market Size Value (US$ Million) & Volume (Units) Forecast By Market Taxonomy, 2023 to 2033

        15.2.1. By Country

            15.2.1.1. India

            15.2.1.2. Indonesia

            15.2.1.3. Malaysia

            15.2.1.4. Singapore

            15.2.1.5. Thailand

            15.2.1.6. Rest of South Asia

        15.2.2. By Product Type

        15.2.3. By Patient Type

        15.2.4. By End User

        15.2.5. By Width

        15.2.6. By Sales Channel

    15.3. Market Attractiveness Analysis

        15.3.1. By Country

        15.3.2. By Product Type

        15.3.3. By Patient Type

        15.3.4. By End User

        15.3.5. By Width

        15.3.6. By Sales Channel

    15.4. Key Takeaways

16. Oceania Market Analysis 2017 to 2022 and Forecast 2023 to 2033, By Country

    16.1. Historical Market Size Value (US$ Million) & Volume (Units) Trend Analysis By Market Taxonomy, 2017 to 2022

    16.2. Market Size Value (US$ Million) & Volume (Units) Forecast By Market Taxonomy, 2023 to 2033

        16.2.1. By Country

            16.2.1.1. Australia

            16.2.1.2. New Zealand

        16.2.2. By Product Type

        16.2.3. By Patient Type

        16.2.4. By End User

        16.2.5. By Width

        16.2.6. By Sales Channel

    16.3. Market Attractiveness Analysis

        16.3.1. By Country

        16.3.2. By Product Type

        16.3.3. By Patient Type

        16.3.4. By End User

        16.3.5. By Width

        16.3.6. By Sales Channel

    16.4. Key Takeaways

17. Middle East and Africa Market Analysis 2017 to 2022 and Forecast 2023 to 2033, By Country

    17.1. Historical Market Size Value (US$ Million) & Volume (Units) Trend Analysis By Market Taxonomy, 2017 to 2022

    17.2. Market Size Value (US$ Million) & Volume (Units) Forecast By Market Taxonomy, 2023 to 2033

        17.2.1. By Country

            17.2.1.1. GCC Countries

            17.2.1.2. South Africa

            17.2.1.3. Rest of Middle East and Africa

        17.2.2. By Product Type

        17.2.3. By Patient Type

        17.2.4. By End User

        17.2.5. By Width

        17.2.6. By Sales Channel

    17.3. Market Attractiveness Analysis

        17.3.1. By Country

        17.3.2. By Product Type

        17.3.3. By Patient Type

        17.3.4. By End User

        17.3.5. By Width

        17.3.6. By Sales Channel

    17.4. Key Takeaways

18. Key Countries Market Analysis

    18.1. USA

        18.1.1. Pricing Analysis

        18.1.2. Market Share Analysis, 2022

            18.1.2.1. By Product Type

            18.1.2.2. By Patient Type

            18.1.2.3. By End User

            18.1.2.4. By Width

            18.1.2.5. By Sales Channel

    18.2. Canada

        18.2.1. Pricing Analysis

        18.2.2. Market Share Analysis, 2022

            18.2.2.1. By Product Type

            18.2.2.2. By Patient Type

            18.2.2.3. By End User

            18.2.2.4. By Width

            18.2.2.5. By Sales Channel

    18.3. Brazil

        18.3.1. Pricing Analysis

        18.3.2. Market Share Analysis, 2022

            18.3.2.1. By Product Type

            18.3.2.2. By Patient Type

            18.3.2.3. By End User

            18.3.2.4. By Width

            18.3.2.5. By Sales Channel

    18.4. Mexico

        18.4.1. Pricing Analysis

        18.4.2. Market Share Analysis, 2022

            18.4.2.1. By Product Type

            18.4.2.2. By Patient Type

            18.4.2.3. By End User

            18.4.2.4. By Width

            18.4.2.5. By Sales Channel

    18.5. Argentina

        18.5.1. Pricing Analysis

        18.5.2. Market Share Analysis, 2022

            18.5.2.1. By Product Type

            18.5.2.2. By Patient Type

            18.5.2.3. By End User

            18.5.2.4. By Width

            18.5.2.5. By Sales Channel

    18.6. Germany

        18.6.1. Pricing Analysis

        18.6.2. Market Share Analysis, 2022

            18.6.2.1. By Product Type

            18.6.2.2. By Patient Type

            18.6.2.3. By End User

            18.6.2.4. By Width

            18.6.2.5. By Sales Channel

    18.7. France

        18.7.1. Pricing Analysis

        18.7.2. Market Share Analysis, 2022

            18.7.2.1. By Product Type

            18.7.2.2. By Patient Type

            18.7.2.3. By End User

            18.7.2.4. By Width

            18.7.2.5. By Sales Channel

    18.8. Italy

        18.8.1. Pricing Analysis

        18.8.2. Market Share Analysis, 2022

            18.8.2.1. By Product Type

            18.8.2.2. By Patient Type

            18.8.2.3. By End User

            18.8.2.4. By Width

            18.8.2.5. By Sales Channel

    18.9. United kingdom

        18.9.1. Pricing Analysis

        18.9.2. Market Share Analysis, 2022

            18.9.2.1. By Product Type

            18.9.2.2. By Patient Type

            18.9.2.3. By End User

            18.9.2.4. By Width

            18.9.2.5. By Sales Channel

    18.10. Spain

        18.10.1. Pricing Analysis

        18.10.2. Market Share Analysis, 2022

            18.10.2.1. By Product Type

            18.10.2.2. By Patient Type

            18.10.2.3. By End User

            18.10.2.4. By Width

            18.10.2.5. By Sales Channel

    18.11. BENELUX

        18.11.1. Pricing Analysis

        18.11.2. Market Share Analysis, 2022

            18.11.2.1. By Product Type

            18.11.2.2. By Patient Type

            18.11.2.3. By End User

            18.11.2.4. By Width

            18.11.2.5. By Sales Channel

    18.12. Russia

        18.12.1. Pricing Analysis

        18.12.2. Market Share Analysis, 2022

            18.12.2.1. By Product Type

            18.12.2.2. By Patient Type

            18.12.2.3. By End User

            18.12.2.4. By Width

            18.12.2.5. By Sales Channel

    18.13. China

        18.13.1. Pricing Analysis

        18.13.2. Market Share Analysis, 2022

            18.13.2.1. By Product Type

            18.13.2.2. By Patient Type

            18.13.2.3. By End User

            18.13.2.4. By Width

            18.13.2.5. By Sales Channel

    18.14. Japan

        18.14.1. Pricing Analysis

        18.14.2. Market Share Analysis, 2022

            18.14.2.1. By Product Type

            18.14.2.2. By Patient Type

            18.14.2.3. By End User

            18.14.2.4. By Width

            18.14.2.5. By Sales Channel

    18.15. South Korea

        18.15.1. Pricing Analysis

        18.15.2. Market Share Analysis, 2022

            18.15.2.1. By Product Type

            18.15.2.2. By Patient Type

            18.15.2.3. By End User

            18.15.2.4. By Width

            18.15.2.5. By Sales Channel

    18.16. India

        18.16.1. Pricing Analysis

        18.16.2. Market Share Analysis, 2022

            18.16.2.1. By Product Type

            18.16.2.2. By Patient Type

            18.16.2.3. By End User

            18.16.2.4. By Width

            18.16.2.5. By Sales Channel

    18.17. Indonesia

        18.17.1. Pricing Analysis

        18.17.2. Market Share Analysis, 2022

            18.17.2.1. By Product Type

            18.17.2.2. By Patient Type

            18.17.2.3. By End User

            18.17.2.4. By Width

            18.17.2.5. By Sales Channel

    18.18. Malaysia

        18.18.1. Pricing Analysis

        18.18.2. Market Share Analysis, 2022

            18.18.2.1. By Product Type

            18.18.2.2. By Patient Type

            18.18.2.3. By End User

            18.18.2.4. By Width

            18.18.2.5. By Sales Channel

    18.19. Singapore

        18.19.1. Pricing Analysis

        18.19.2. Market Share Analysis, 2022

            18.19.2.1. By Product Type

            18.19.2.2. By Patient Type

            18.19.2.3. By End User

            18.19.2.4. By Width

            18.19.2.5. By Sales Channel

    18.20. Thailand

        18.20.1. Pricing Analysis

        18.20.2. Market Share Analysis, 2022

            18.20.2.1. By Product Type

            18.20.2.2. By Patient Type

            18.20.2.3. By End User

            18.20.2.4. By Width

            18.20.2.5. By Sales Channel

    18.21. Australia 

        18.21.1. Pricing Analysis

        18.21.2. Market Share Analysis, 2022

            18.21.2.1. By Product Type

            18.21.2.2. By Patient Type

            18.21.2.3. By End User

            18.21.2.4. By Width

            18.21.2.5. By Sales Channel

    18.22. New Zealand

        18.22.1. Pricing Analysis

        18.22.2. Market Share Analysis, 2022

            18.22.2.1. By Product Type

            18.22.2.2. By Patient Type

            18.22.2.3. By End User

            18.22.2.4. By Width

            18.22.2.5. By Sales Channel

    18.23. GCC Countries

        18.23.1. Pricing Analysis

        18.23.2. Market Share Analysis, 2022

            18.23.2.1. By Product Type

            18.23.2.2. By Patient Type

            18.23.2.3. By End User

            18.23.2.4. By Width

            18.23.2.5. By Sales Channel

    18.24. South Africa

        18.24.1. Pricing Analysis

        18.24.2. Market Share Analysis, 2022

            18.24.2.1. By Product Type

            18.24.2.2. By Patient Type

            18.24.2.3. By End User

            18.24.2.4. By Width

            18.24.2.5. By Sales Channel

19. Market Structure Analysis

    19.1. Competition Dashboard

    19.2. Competition Benchmarking

    19.3. Market Share Analysis of Top Players

        19.3.1. By Regional

        19.3.2. By Product Type

        19.3.3. By Patient Type

        19.3.4. By End User

        19.3.5. By Width

        19.3.6. By Sales Channel

20. Competition Analysis

    20.1. Competition Deep Dive

        20.1.1. DJO, LLC

            20.1.1.1. Overview

            20.1.1.2. Product Portfolio

            20.1.1.3. Profitability by Market Segments

            20.1.1.4. Sales Footprint

            20.1.1.5. Strategy Overview

                20.1.1.5.1. Marketing Strategy

                20.1.1.5.2. Product Strategy

                20.1.1.5.3. Channel Strategy

        20.1.2. Drewshoe

            20.1.2.1. Overview

            20.1.2.2. Product Portfolio

            20.1.2.3. Profitability by Market Segments

            20.1.2.4. Sales Footprint

            20.1.2.5. Strategy Overview

                20.1.2.5.1. Marketing Strategy

                20.1.2.5.2. Product Strategy

                20.1.2.5.3. Channel Strategy

        20.1.3. Orthofeet Inc.

            20.1.3.1. Overview

            20.1.3.2. Product Portfolio

            20.1.3.3. Profitability by Market Segments

            20.1.3.4. Sales Footprint

            20.1.3.5. Strategy Overview

                20.1.3.5.1. Marketing Strategy

                20.1.3.5.2. Product Strategy

                20.1.3.5.3. Channel Strategy

        20.1.4. DARCO International, Inc.

            20.1.4.1. Overview

            20.1.4.2. Product Portfolio

            20.1.4.3. Profitability by Market Segments

            20.1.4.4. Sales Footprint

            20.1.4.5. Strategy Overview

                20.1.4.5.1. Marketing Strategy

                20.1.4.5.2. Product Strategy

                20.1.4.5.3. Channel Strategy

        20.1.5. Clearwell Mobility Company

            20.1.5.1. Overview

            20.1.5.2. Product Portfolio

            20.1.5.3. Profitability by Market Segments

            20.1.5.4. Sales Footprint

            20.1.5.5. Strategy Overview

                20.1.5.5.1. Marketing Strategy

                20.1.5.5.2. Product Strategy

                20.1.5.5.3. Channel Strategy

        20.1.6. Supad

            20.1.6.1. Overview

            20.1.6.2. Product Portfolio

            20.1.6.3. Profitability by Market Segments

            20.1.6.4. Sales Footprint

            20.1.6.5. Strategy Overview

                20.1.6.5.1. Marketing Strategy

                20.1.6.5.2. Product Strategy

                20.1.6.5.3. Channel Strategy

        20.1.7. Aetrex Worldwide, Inc.

            20.1.7.1. Overview

            20.1.7.2. Product Portfolio

            20.1.7.3. Profitability by Market Segments

            20.1.7.4. Sales Footprint

            20.1.7.5. Strategy Overview

                20.1.7.5.1. Marketing Strategy

                20.1.7.5.2. Product Strategy

                20.1.7.5.3. Channel Strategy

        20.1.8. Gravity Defyer Corp.

            20.1.8.1. Overview

            20.1.8.2. Product Portfolio

            20.1.8.3. Profitability by Market Segments

            20.1.8.4. Sales Footprint

            20.1.8.5. Strategy Overview

                20.1.8.5.1. Marketing Strategy

                20.1.8.5.2. Product Strategy

                20.1.8.5.3. Channel Strategy

        20.1.9. Kinetec Medical Products Ltd

            20.1.9.1. Overview

            20.1.9.2. Product Portfolio

            20.1.9.3. Profitability by Market Segments

            20.1.9.4. Sales Footprint

            20.1.9.5. Strategy Overview

                20.1.9.5.1. Marketing Strategy

                20.1.9.5.2. Product Strategy

                20.1.9.5.3. Channel Strategy

        20.1.10. Horng Shin Footwear Co.

            20.1.10.1. Overview

            20.1.10.2. Product Portfolio

            20.1.10.3. Profitability by Market Segments

            20.1.10.4. Sales Footprint

            20.1.10.5. Strategy Overview

                20.1.10.5.1. Marketing Strategy

                20.1.10.5.2. Product Strategy

                20.1.10.5.3. Channel Strategy

        20.1.11. Watts Footwear

            20.1.11.1. Overview

            20.1.11.2. Product Portfolio

            20.1.11.3. Profitability by Market Segments

            20.1.11.4. Sales Footprint

            20.1.11.5. Strategy Overview

                20.1.11.5.1. Marketing Strategy

                20.1.11.5.2. Product Strategy

                20.1.11.5.3. Channel Strategy

        20.1.12. ASICS Corporation

            20.1.12.1. Overview

            20.1.12.2. Product Portfolio

            20.1.12.3. Profitability by Market Segments

            20.1.12.4. Sales Footprint

            20.1.12.5. Strategy Overview

                20.1.12.5.1. Marketing Strategy

                20.1.12.5.2. Product Strategy

                20.1.12.5.3. Channel Strategy

        20.1.13. Advance Diabetic Solution

            20.1.13.1. Overview

            20.1.13.2. Product Portfolio

            20.1.13.3. Profitability by Market Segments

            20.1.13.4. Sales Footprint

            20.1.13.5. Strategy Overview

                20.1.13.5.1. Marketing Strategy

                20.1.13.5.2. Product Strategy

                20.1.13.5.3. Channel Strategy

        20.1.14. Dr Zen Products, Inc.

            20.1.14.1. Overview

            20.1.14.2. Product Portfolio

            20.1.14.3. Profitability by Market Segments

            20.1.14.4. Sales Footprint

            20.1.14.5. Strategy Overview

                20.1.14.5.1. Marketing Strategy

                20.1.14.5.2. Product Strategy

                20.1.14.5.3. Channel Strategy

        20.1.15. Sensoria Health

            20.1.15.1. Overview

            20.1.15.2. Product Portfolio

            20.1.15.3. Profitability by Market Segments

            20.1.15.4. Sales Footprint

            20.1.15.5. Strategy Overview

                20.1.15.5.1. Marketing Strategy

                20.1.15.5.2. Product Strategy

                20.1.15.5.3. Channel Strategy

21. Assumptions & Acronyms Used

22. Research Methodology

Don't pay for what you don't need

Customize your report by selecting specific countries or regions and save 30%!

List of Tables

Table 1: Global Market Value (US$ Million) Forecast by Region, 2017 to 2033

Table 2: Global Market Volume (Units) Forecast by Region, 2017 to 2033

Table 3: Global Market Value (US$ Million) Forecast by Product Type, 2017 to 2033

Table 4: Global Market Volume (Units) Forecast by Product Type, 2017 to 2033

Table 5: Global Market Value (US$ Million) Forecast by Patient Type, 2017 to 2033

Table 6: Global Market Volume (Units) Forecast by Patient Type, 2017 to 2033

Table 7: Global Market Value (US$ Million) Forecast by End User, 2017 to 2033

Table 8: Global Market Volume (Units) Forecast by End User, 2017 to 2033

Table 9: Global Market Value (US$ Million) Forecast by Width, 2017 to 2033

Table 10: Global Market Volume (Units) Forecast by Width, 2017 to 2033

Table 11: Global Market Value (US$ Million) Forecast by Sales Channel, 2017 to 2033

Table 12: Global Market Volume (Units) Forecast by Sales Channel, 2017 to 2033

Table 13: North America Market Value (US$ Million) Forecast by Country, 2017 to 2033

Table 14: North America Market Volume (Units) Forecast by Country, 2017 to 2033

Table 15: North America Market Value (US$ Million) Forecast by Product Type, 2017 to 2033

Table 16: North America Market Volume (Units) Forecast by Product Type, 2017 to 2033

Table 17: North America Market Value (US$ Million) Forecast by Patient Type, 2017 to 2033

Table 18: North America Market Volume (Units) Forecast by Patient Type, 2017 to 2033

Table 19: North America Market Value (US$ Million) Forecast by End User, 2017 to 2033

Table 20: North America Market Volume (Units) Forecast by End User, 2017 to 2033

Table 21: North America Market Value (US$ Million) Forecast by Width, 2017 to 2033

Table 22: North America Market Volume (Units) Forecast by Width, 2017 to 2033

Table 23: North America Market Value (US$ Million) Forecast by Sales Channel, 2017 to 2033

Table 24: North America Market Volume (Units) Forecast by Sales Channel, 2017 to 2033

Table 25: Latin America Market Value (US$ Million) Forecast by Country, 2017 to 2033

Table 26: Latin America Market Volume (Units) Forecast by Country, 2017 to 2033

Table 27: Latin America Market Value (US$ Million) Forecast by Product Type, 2017 to 2033

Table 28: Latin America Market Volume (Units) Forecast by Product Type, 2017 to 2033

Table 29: Latin America Market Value (US$ Million) Forecast by Patient Type, 2017 to 2033

Table 30: Latin America Market Volume (Units) Forecast by Patient Type, 2017 to 2033

Table 31: Latin America Market Value (US$ Million) Forecast by End User, 2017 to 2033

Table 32: Latin America Market Volume (Units) Forecast by End User, 2017 to 2033

Table 33: Latin America Market Value (US$ Million) Forecast by Width, 2017 to 2033

Table 34: Latin America Market Volume (Units) Forecast by Width, 2017 to 2033

Table 35: Latin America Market Value (US$ Million) Forecast by Sales Channel, 2017 to 2033

Table 36: Latin America Market Volume (Units) Forecast by Sales Channel, 2017 to 2033

Table 37: Europe Market Value (US$ Million) Forecast by Country, 2017 to 2033

Table 38: Europe Market Volume (Units) Forecast by Country, 2017 to 2033

Table 39: Europe Market Value (US$ Million) Forecast by Product Type, 2017 to 2033

Table 40: Europe Market Volume (Units) Forecast by Product Type, 2017 to 2033

Table 41: Europe Market Value (US$ Million) Forecast by Patient Type, 2017 to 2033

Table 42: Europe Market Volume (Units) Forecast by Patient Type, 2017 to 2033

Table 43: Europe Market Value (US$ Million) Forecast by End User, 2017 to 2033

Table 44: Europe Market Volume (Units) Forecast by End User, 2017 to 2033

Table 45: Europe Market Value (US$ Million) Forecast by Width, 2017 to 2033

Table 46: Europe Market Volume (Units) Forecast by Width, 2017 to 2033

Table 47: Europe Market Value (US$ Million) Forecast by Sales Channel, 2017 to 2033

Table 48: Europe Market Volume (Units) Forecast by Sales Channel, 2017 to 2033

Table 49: East Asia Market Value (US$ Million) Forecast by Country, 2017 to 2033

Table 50: East Asia Market Volume (Units) Forecast by Country, 2017 to 2033

Table 51: East Asia Market Value (US$ Million) Forecast by Product Type, 2017 to 2033

Table 52: East Asia Market Volume (Units) Forecast by Product Type, 2017 to 2033

Table 53: East Asia Market Value (US$ Million) Forecast by Patient Type, 2017 to 2033

Table 54: East Asia Market Volume (Units) Forecast by Patient Type, 2017 to 2033

Table 55: East Asia Market Value (US$ Million) Forecast by End User, 2017 to 2033

Table 56: East Asia Market Volume (Units) Forecast by End User, 2017 to 2033

Table 57: East Asia Market Value (US$ Million) Forecast by Width, 2017 to 2033

Table 58: East Asia Market Volume (Units) Forecast by Width, 2017 to 2033

Table 59: East Asia Market Value (US$ Million) Forecast by Sales Channel, 2017 to 2033

Table 60: East Asia Market Volume (Units) Forecast by Sales Channel, 2017 to 2033

Table 61: South Asia Market Value (US$ Million) Forecast by Country, 2017 to 2033

Table 62: South Asia Market Volume (Units) Forecast by Country, 2017 to 2033

Table 63: South Asia Market Value (US$ Million) Forecast by Product Type, 2017 to 2033

Table 64: South Asia Market Volume (Units) Forecast by Product Type, 2017 to 2033

Table 65: South Asia Market Value (US$ Million) Forecast by Patient Type, 2017 to 2033

Table 66: South Asia Market Volume (Units) Forecast by Patient Type, 2017 to 2033

Table 67: South Asia Market Value (US$ Million) Forecast by End User, 2017 to 2033

Table 68: South Asia Market Volume (Units) Forecast by End User, 2017 to 2033

Table 69: South Asia Market Value (US$ Million) Forecast by Width, 2017 to 2033

Table 70: South Asia Market Volume (Units) Forecast by Width, 2017 to 2033

Table 71: South Asia Market Value (US$ Million) Forecast by Sales Channel, 2017 to 2033

Table 72: South Asia Market Volume (Units) Forecast by Sales Channel, 2017 to 2033

Table 73: Oceania Market Value (US$ Million) Forecast by Country, 2017 to 2033

Table 74: Oceania Market Volume (Units) Forecast by Country, 2017 to 2033

Table 75: Oceania Market Value (US$ Million) Forecast by Product Type, 2017 to 2033

Table 76: Oceania Market Volume (Units) Forecast by Product Type, 2017 to 2033

Table 77: Oceania Market Value (US$ Million) Forecast by Patient Type, 2017 to 2033

Table 78: Oceania Market Volume (Units) Forecast by Patient Type, 2017 to 2033

Table 79: Oceania Market Value (US$ Million) Forecast by End User, 2017 to 2033

Table 80: Oceania Market Volume (Units) Forecast by End User, 2017 to 2033

Table 81: Oceania Market Value (US$ Million) Forecast by Width, 2017 to 2033

Table 82: Oceania Market Volume (Units) Forecast by Width, 2017 to 2033

Table 83: Oceania Market Value (US$ Million) Forecast by Sales Channel, 2017 to 2033

Table 84: Oceania Market Volume (Units) Forecast by Sales Channel, 2017 to 2033

Table 85: Middle East and Africa Market Value (US$ Million) Forecast by Country, 2017 to 2033

Table 86: Middle East and Africa Market Volume (Units) Forecast by Country, 2017 to 2033

Table 87: Middle East and Africa Market Value (US$ Million) Forecast by Product Type, 2017 to 2033

Table 88: Middle East and Africa Market Volume (Units) Forecast by Product Type, 2017 to 2033

Table 89: Middle East and Africa Market Value (US$ Million) Forecast by Patient Type, 2017 to 2033

Table 90: Middle East and Africa Market Volume (Units) Forecast by Patient Type, 2017 to 2033

Table 91: Middle East and Africa Market Value (US$ Million) Forecast by End User, 2017 to 2033

Table 92: Middle East and Africa Market Volume (Units) Forecast by End User, 2017 to 2033

Table 93: Middle East and Africa Market Value (US$ Million) Forecast by Width, 2017 to 2033

Table 94: Middle East and Africa Market Volume (Units) Forecast by Width, 2017 to 2033

Table 95: Middle East and Africa Market Value (US$ Million) Forecast by Sales Channel, 2017 to 2033

Table 96: Middle East and Africa Market Volume (Units) Forecast by Sales Channel, 2017 to 2033
Sabyasachi Ghosh
Sabyasachi Ghosh

Principal Consultant

Talk to Analyst

Find your sweet spots for generating winning opportunities in this market.

List of Charts

Figure 1: Global Market Value (US$ Million) by Product Type, 2023 to 2033

Figure 2: Global Market Value (US$ Million) by Patient Type, 2023 to 2033

Figure 3: Global Market Value (US$ Million) by End User, 2023 to 2033

Figure 4: Global Market Value (US$ Million) by Width, 2023 to 2033

Figure 5: Global Market Value (US$ Million) by Sales Channel, 2023 to 2033

Figure 6: Global Market Value (US$ Million) by Region, 2023 to 2033

Figure 7: Global Market Value (US$ Million) Analysis by Region, 2017 to 2033

Figure 8: Global Market Volume (Units) Analysis by Region, 2017 to 2033

Figure 9: Global Market Value Share (%) and BPS Analysis by Region, 2023 to 2033

Figure 10: Global Market Y-o-Y Growth (%) Projections by Region, 2023 to 2033

Figure 11: Global Market Value (US$ Million) Analysis by Product Type, 2017 to 2033

Figure 12: Global Market Volume (Units) Analysis by Product Type, 2017 to 2033

Figure 13: Global Market Value Share (%) and BPS Analysis by Product Type, 2023 to 2033

Figure 14: Global Market Y-o-Y Growth (%) Projections by Product Type, 2023 to 2033

Figure 15: Global Market Value (US$ Million) Analysis by Patient Type, 2017 to 2033

Figure 16: Global Market Volume (Units) Analysis by Patient Type, 2017 to 2033

Figure 17: Global Market Value Share (%) and BPS Analysis by Patient Type, 2023 to 2033

Figure 18: Global Market Y-o-Y Growth (%) Projections by Patient Type, 2023 to 2033

Figure 19: Global Market Value (US$ Million) Analysis by End User, 2017 to 2033

Figure 20: Global Market Volume (Units) Analysis by End User, 2017 to 2033

Figure 21: Global Market Value Share (%) and BPS Analysis by End User, 2023 to 2033

Figure 22: Global Market Y-o-Y Growth (%) Projections by End User, 2023 to 2033

Figure 23: Global Market Value (US$ Million) Analysis by Width, 2017 to 2033

Figure 24: Global Market Volume (Units) Analysis by Width, 2017 to 2033

Figure 25: Global Market Value Share (%) and BPS Analysis by Width, 2023 to 2033

Figure 26: Global Market Y-o-Y Growth (%) Projections by Width, 2023 to 2033

Figure 27: Global Market Value (US$ Million) Analysis by Sales Channel, 2017 to 2033

Figure 28: Global Market Volume (Units) Analysis by Sales Channel, 2017 to 2033

Figure 29: Global Market Value Share (%) and BPS Analysis by Sales Channel, 2023 to 2033

Figure 30: Global Market Y-o-Y Growth (%) Projections by Sales Channel, 2023 to 2033

Figure 31: Global Market Attractiveness by Product Type, 2023 to 2033

Figure 32: Global Market Attractiveness by Patient Type, 2023 to 2033

Figure 33: Global Market Attractiveness by End User, 2023 to 2033

Figure 34: Global Market Attractiveness by Width, 2023 to 2033

Figure 35: Global Market Attractiveness by Sales Channel, 2023 to 2033

Figure 36: Global Market Attractiveness by Region, 2023 to 2033

Figure 37: North America Market Value (US$ Million) by Product Type, 2023 to 2033

Figure 38: North America Market Value (US$ Million) by Patient Type, 2023 to 2033

Figure 39: North America Market Value (US$ Million) by End User, 2023 to 2033

Figure 40: North America Market Value (US$ Million) by Width, 2023 to 2033

Figure 41: North America Market Value (US$ Million) by Sales Channel, 2023 to 2033

Figure 42: North America Market Value (US$ Million) by Country, 2023 to 2033

Figure 43: North America Market Value (US$ Million) Analysis by Country, 2017 to 2033

Figure 44: North America Market Volume (Units) Analysis by Country, 2017 to 2033

Figure 45: North America Market Value Share (%) and BPS Analysis by Country, 2023 to 2033

Figure 46: North America Market Y-o-Y Growth (%) Projections by Country, 2023 to 2033

Figure 47: North America Market Value (US$ Million) Analysis by Product Type, 2017 to 2033

Figure 48: North America Market Volume (Units) Analysis by Product Type, 2017 to 2033

Figure 49: North America Market Value Share (%) and BPS Analysis by Product Type, 2023 to 2033

Figure 50: North America Market Y-o-Y Growth (%) Projections by Product Type, 2023 to 2033

Figure 51: North America Market Value (US$ Million) Analysis by Patient Type, 2017 to 2033

Figure 52: North America Market Volume (Units) Analysis by Patient Type, 2017 to 2033

Figure 53: North America Market Value Share (%) and BPS Analysis by Patient Type, 2023 to 2033

Figure 54: North America Market Y-o-Y Growth (%) Projections by Patient Type, 2023 to 2033

Figure 55: North America Market Value (US$ Million) Analysis by End User, 2017 to 2033

Figure 56: North America Market Volume (Units) Analysis by End User, 2017 to 2033

Figure 57: North America Market Value Share (%) and BPS Analysis by End User, 2023 to 2033

Figure 58: North America Market Y-o-Y Growth (%) Projections by End User, 2023 to 2033

Figure 59: North America Market Value (US$ Million) Analysis by Width, 2017 to 2033

Figure 60: North America Market Volume (Units) Analysis by Width, 2017 to 2033

Figure 61: North America Market Value Share (%) and BPS Analysis by Width, 2023 to 2033

Figure 62: North America Market Y-o-Y Growth (%) Projections by Width, 2023 to 2033

Figure 63: North America Market Value (US$ Million) Analysis by Sales Channel, 2017 to 2033

Figure 64: North America Market Volume (Units) Analysis by Sales Channel, 2017 to 2033

Figure 65: North America Market Value Share (%) and BPS Analysis by Sales Channel, 2023 to 2033

Figure 66: North America Market Y-o-Y Growth (%) Projections by Sales Channel, 2023 to 2033

Figure 67: North America Market Attractiveness by Product Type, 2023 to 2033

Figure 68: North America Market Attractiveness by Patient Type, 2023 to 2033

Figure 69: North America Market Attractiveness by End User, 2023 to 2033

Figure 70: North America Market Attractiveness by Width, 2023 to 2033

Figure 71: North America Market Attractiveness by Sales Channel, 2023 to 2033

Figure 72: North America Market Attractiveness by Country, 2023 to 2033

Figure 73: Latin America Market Value (US$ Million) by Product Type, 2023 to 2033

Figure 74: Latin America Market Value (US$ Million) by Patient Type, 2023 to 2033

Figure 75: Latin America Market Value (US$ Million) by End User, 2023 to 2033

Figure 76: Latin America Market Value (US$ Million) by Width, 2023 to 2033

Figure 77: Latin America Market Value (US$ Million) by Sales Channel, 2023 to 2033

Figure 78: Latin America Market Value (US$ Million) by Country, 2023 to 2033

Figure 79: Latin America Market Value (US$ Million) Analysis by Country, 2017 to 2033

Figure 80: Latin America Market Volume (Units) Analysis by Country, 2017 to 2033

Figure 81: Latin America Market Value Share (%) and BPS Analysis by Country, 2023 to 2033

Figure 82: Latin America Market Y-o-Y Growth (%) Projections by Country, 2023 to 2033

Figure 83: Latin America Market Value (US$ Million) Analysis by Product Type, 2017 to 2033

Figure 84: Latin America Market Volume (Units) Analysis by Product Type, 2017 to 2033

Figure 85: Latin America Market Value Share (%) and BPS Analysis by Product Type, 2023 to 2033

Figure 86: Latin America Market Y-o-Y Growth (%) Projections by Product Type, 2023 to 2033

Figure 87: Latin America Market Value (US$ Million) Analysis by Patient Type, 2017 to 2033

Figure 88: Latin America Market Volume (Units) Analysis by Patient Type, 2017 to 2033

Figure 89: Latin America Market Value Share (%) and BPS Analysis by Patient Type, 2023 to 2033

Figure 90: Latin America Market Y-o-Y Growth (%) Projections by Patient Type, 2023 to 2033

Figure 91: Latin America Market Value (US$ Million) Analysis by End User, 2017 to 2033

Figure 92: Latin America Market Volume (Units) Analysis by End User, 2017 to 2033

Figure 93: Latin America Market Value Share (%) and BPS Analysis by End User, 2023 to 2033

Figure 94: Latin America Market Y-o-Y Growth (%) Projections by End User, 2023 to 2033

Figure 95: Latin America Market Value (US$ Million) Analysis by Width, 2017 to 2033

Figure 96: Latin America Market Volume (Units) Analysis by Width, 2017 to 2033

Figure 97: Latin America Market Value Share (%) and BPS Analysis by Width, 2023 to 2033

Figure 98: Latin America Market Y-o-Y Growth (%) Projections by Width, 2023 to 2033

Figure 99: Latin America Market Value (US$ Million) Analysis by Sales Channel, 2017 to 2033

Figure 100: Latin America Market Volume (Units) Analysis by Sales Channel, 2017 to 2033

Figure 101: Latin America Market Value Share (%) and BPS Analysis by Sales Channel, 2023 to 2033

Figure 102: Latin America Market Y-o-Y Growth (%) Projections by Sales Channel, 2023 to 2033

Figure 103: Latin America Market Attractiveness by Product Type, 2023 to 2033

Figure 104: Latin America Market Attractiveness by Patient Type, 2023 to 2033

Figure 105: Latin America Market Attractiveness by End User, 2023 to 2033

Figure 106: Latin America Market Attractiveness by Width, 2023 to 2033

Figure 107: Latin America Market Attractiveness by Sales Channel, 2023 to 2033

Figure 108: Latin America Market Attractiveness by Country, 2023 to 2033

Figure 109: Europe Market Value (US$ Million) by Product Type, 2023 to 2033

Figure 110: Europe Market Value (US$ Million) by Patient Type, 2023 to 2033

Figure 111: Europe Market Value (US$ Million) by End User, 2023 to 2033

Figure 112: Europe Market Value (US$ Million) by Width, 2023 to 2033

Figure 113: Europe Market Value (US$ Million) by Sales Channel, 2023 to 2033

Figure 114: Europe Market Value (US$ Million) by Country, 2023 to 2033

Figure 115: Europe Market Value (US$ Million) Analysis by Country, 2017 to 2033

Figure 116: Europe Market Volume (Units) Analysis by Country, 2017 to 2033

Figure 117: Europe Market Value Share (%) and BPS Analysis by Country, 2023 to 2033

Figure 118: Europe Market Y-o-Y Growth (%) Projections by Country, 2023 to 2033

Figure 119: Europe Market Value (US$ Million) Analysis by Product Type, 2017 to 2033

Figure 120: Europe Market Volume (Units) Analysis by Product Type, 2017 to 2033

Figure 121: Europe Market Value Share (%) and BPS Analysis by Product Type, 2023 to 2033

Figure 122: Europe Market Y-o-Y Growth (%) Projections by Product Type, 2023 to 2033

Figure 123: Europe Market Value (US$ Million) Analysis by Patient Type, 2017 to 2033

Figure 124: Europe Market Volume (Units) Analysis by Patient Type, 2017 to 2033

Figure 125: Europe Market Value Share (%) and BPS Analysis by Patient Type, 2023 to 2033

Figure 126: Europe Market Y-o-Y Growth (%) Projections by Patient Type, 2023 to 2033

Figure 127: Europe Market Value (US$ Million) Analysis by End User, 2017 to 2033

Figure 128: Europe Market Volume (Units) Analysis by End User, 2017 to 2033

Figure 129: Europe Market Value Share (%) and BPS Analysis by End User, 2023 to 2033

Figure 130: Europe Market Y-o-Y Growth (%) Projections by End User, 2023 to 2033

Figure 131: Europe Market Value (US$ Million) Analysis by Width, 2017 to 2033

Figure 132: Europe Market Volume (Units) Analysis by Width, 2017 to 2033

Figure 133: Europe Market Value Share (%) and BPS Analysis by Width, 2023 to 2033

Figure 134: Europe Market Y-o-Y Growth (%) Projections by Width, 2023 to 2033

Figure 135: Europe Market Value (US$ Million) Analysis by Sales Channel, 2017 to 2033

Figure 136: Europe Market Volume (Units) Analysis by Sales Channel, 2017 to 2033

Figure 137: Europe Market Value Share (%) and BPS Analysis by Sales Channel, 2023 to 2033

Figure 138: Europe Market Y-o-Y Growth (%) Projections by Sales Channel, 2023 to 2033

Figure 139: Europe Market Attractiveness by Product Type, 2023 to 2033

Figure 140: Europe Market Attractiveness by Patient Type, 2023 to 2033

Figure 141: Europe Market Attractiveness by End User, 2023 to 2033

Figure 142: Europe Market Attractiveness by Width, 2023 to 2033

Figure 143: Europe Market Attractiveness by Sales Channel, 2023 to 2033

Figure 144: Europe Market Attractiveness by Country, 2023 to 2033

Figure 145: East Asia Market Value (US$ Million) by Product Type, 2023 to 2033

Figure 146: East Asia Market Value (US$ Million) by Patient Type, 2023 to 2033

Figure 147: East Asia Market Value (US$ Million) by End User, 2023 to 2033

Figure 148: East Asia Market Value (US$ Million) by Width, 2023 to 2033

Figure 149: East Asia Market Value (US$ Million) by Sales Channel, 2023 to 2033

Figure 150: East Asia Market Value (US$ Million) by Country, 2023 to 2033

Figure 151: East Asia Market Value (US$ Million) Analysis by Country, 2017 to 2033

Figure 152: East Asia Market Volume (Units) Analysis by Country, 2017 to 2033

Figure 153: East Asia Market Value Share (%) and BPS Analysis by Country, 2023 to 2033

Figure 154: East Asia Market Y-o-Y Growth (%) Projections by Country, 2023 to 2033

Figure 155: East Asia Market Value (US$ Million) Analysis by Product Type, 2017 to 2033

Figure 156: East Asia Market Volume (Units) Analysis by Product Type, 2017 to 2033

Figure 157: East Asia Market Value Share (%) and BPS Analysis by Product Type, 2023 to 2033

Figure 158: East Asia Market Y-o-Y Growth (%) Projections by Product Type, 2023 to 2033

Figure 159: East Asia Market Value (US$ Million) Analysis by Patient Type, 2017 to 2033

Figure 160: East Asia Market Volume (Units) Analysis by Patient Type, 2017 to 2033

Figure 161: East Asia Market Value Share (%) and BPS Analysis by Patient Type, 2023 to 2033

Figure 162: East Asia Market Y-o-Y Growth (%) Projections by Patient Type, 2023 to 2033

Figure 163: East Asia Market Value (US$ Million) Analysis by End User, 2017 to 2033

Figure 164: East Asia Market Volume (Units) Analysis by End User, 2017 to 2033

Figure 165: East Asia Market Value Share (%) and BPS Analysis by End User, 2023 to 2033

Figure 166: East Asia Market Y-o-Y Growth (%) Projections by End User, 2023 to 2033

Figure 167: East Asia Market Value (US$ Million) Analysis by Width, 2017 to 2033

Figure 168: East Asia Market Volume (Units) Analysis by Width, 2017 to 2033

Figure 169: East Asia Market Value Share (%) and BPS Analysis by Width, 2023 to 2033

Figure 170: East Asia Market Y-o-Y Growth (%) Projections by Width, 2023 to 2033

Figure 171: East Asia Market Value (US$ Million) Analysis by Sales Channel, 2017 to 2033

Figure 172: East Asia Market Volume (Units) Analysis by Sales Channel, 2017 to 2033

Figure 173: East Asia Market Value Share (%) and BPS Analysis by Sales Channel, 2023 to 2033

Figure 174: East Asia Market Y-o-Y Growth (%) Projections by Sales Channel, 2023 to 2033

Figure 175: East Asia Market Attractiveness by Product Type, 2023 to 2033

Figure 176: East Asia Market Attractiveness by Patient Type, 2023 to 2033

Figure 177: East Asia Market Attractiveness by End User, 2023 to 2033

Figure 178: East Asia Market Attractiveness by Width, 2023 to 2033

Figure 179: East Asia Market Attractiveness by Sales Channel, 2023 to 2033

Figure 180: East Asia Market Attractiveness by Country, 2023 to 2033

Figure 181: South Asia Market Value (US$ Million) by Product Type, 2023 to 2033

Figure 182: South Asia Market Value (US$ Million) by Patient Type, 2023 to 2033

Figure 183: South Asia Market Value (US$ Million) by End User, 2023 to 2033

Figure 184: South Asia Market Value (US$ Million) by Width, 2023 to 2033

Figure 185: South Asia Market Value (US$ Million) by Sales Channel, 2023 to 2033

Figure 186: South Asia Market Value (US$ Million) by Country, 2023 to 2033

Figure 187: South Asia Market Value (US$ Million) Analysis by Country, 2017 to 2033

Figure 188: South Asia Market Volume (Units) Analysis by Country, 2017 to 2033

Figure 189: South Asia Market Value Share (%) and BPS Analysis by Country, 2023 to 2033

Figure 190: South Asia Market Y-o-Y Growth (%) Projections by Country, 2023 to 2033

Figure 191: South Asia Market Value (US$ Million) Analysis by Product Type, 2017 to 2033

Figure 192: South Asia Market Volume (Units) Analysis by Product Type, 2017 to 2033

Figure 193: South Asia Market Value Share (%) and BPS Analysis by Product Type, 2023 to 2033

Figure 194: South Asia Market Y-o-Y Growth (%) Projections by Product Type, 2023 to 2033

Figure 195: South Asia Market Value (US$ Million) Analysis by Patient Type, 2017 to 2033

Figure 196: South Asia Market Volume (Units) Analysis by Patient Type, 2017 to 2033

Figure 197: South Asia Market Value Share (%) and BPS Analysis by Patient Type, 2023 to 2033

Figure 198: South Asia Market Y-o-Y Growth (%) Projections by Patient Type, 2023 to 2033

Figure 199: South Asia Market Value (US$ Million) Analysis by End User, 2017 to 2033

Figure 200: South Asia Market Volume (Units) Analysis by End User, 2017 to 2033

Figure 201: South Asia Market Value Share (%) and BPS Analysis by End User, 2023 to 2033

Figure 202: South Asia Market Y-o-Y Growth (%) Projections by End User, 2023 to 2033

Figure 203: South Asia Market Value (US$ Million) Analysis by Width, 2017 to 2033

Figure 204: South Asia Market Volume (Units) Analysis by Width, 2017 to 2033

Figure 205: South Asia Market Value Share (%) and BPS Analysis by Width, 2023 to 2033

Figure 206: South Asia Market Y-o-Y Growth (%) Projections by Width, 2023 to 2033

Figure 207: South Asia Market Value (US$ Million) Analysis by Sales Channel, 2017 to 2033

Figure 208: South Asia Market Volume (Units) Analysis by Sales Channel, 2017 to 2033

Figure 209: South Asia Market Value Share (%) and BPS Analysis by Sales Channel, 2023 to 2033

Figure 210: South Asia Market Y-o-Y Growth (%) Projections by Sales Channel, 2023 to 2033

Figure 211: South Asia Market Attractiveness by Product Type, 2023 to 2033

Figure 212: South Asia Market Attractiveness by Patient Type, 2023 to 2033

Figure 213: South Asia Market Attractiveness by End User, 2023 to 2033

Figure 214: South Asia Market Attractiveness by Width, 2023 to 2033

Figure 215: South Asia Market Attractiveness by Sales Channel, 2023 to 2033

Figure 216: South Asia Market Attractiveness by Country, 2023 to 2033

Figure 217: Oceania Market Value (US$ Million) by Product Type, 2023 to 2033

Figure 218: Oceania Market Value (US$ Million) by Patient Type, 2023 to 2033

Figure 219: Oceania Market Value (US$ Million) by End User, 2023 to 2033

Figure 220: Oceania Market Value (US$ Million) by Width, 2023 to 2033

Figure 221: Oceania Market Value (US$ Million) by Sales Channel, 2023 to 2033

Figure 222: Oceania Market Value (US$ Million) by Country, 2023 to 2033

Figure 223: Oceania Market Value (US$ Million) Analysis by Country, 2017 to 2033

Figure 224: Oceania Market Volume (Units) Analysis by Country, 2017 to 2033

Figure 225: Oceania Market Value Share (%) and BPS Analysis by Country, 2023 to 2033

Figure 226: Oceania Market Y-o-Y Growth (%) Projections by Country, 2023 to 2033

Figure 227: Oceania Market Value (US$ Million) Analysis by Product Type, 2017 to 2033

Figure 228: Oceania Market Volume (Units) Analysis by Product Type, 2017 to 2033

Figure 229: Oceania Market Value Share (%) and BPS Analysis by Product Type, 2023 to 2033

Figure 230: Oceania Market Y-o-Y Growth (%) Projections by Product Type, 2023 to 2033

Figure 231: Oceania Market Value (US$ Million) Analysis by Patient Type, 2017 to 2033

Figure 232: Oceania Market Volume (Units) Analysis by Patient Type, 2017 to 2033

Figure 233: Oceania Market Value Share (%) and BPS Analysis by Patient Type, 2023 to 2033

Figure 234: Oceania Market Y-o-Y Growth (%) Projections by Patient Type, 2023 to 2033

Figure 235: Oceania Market Value (US$ Million) Analysis by End User, 2017 to 2033

Figure 236: Oceania Market Volume (Units) Analysis by End User, 2017 to 2033

Figure 237: Oceania Market Value Share (%) and BPS Analysis by End User, 2023 to 2033

Figure 238: Oceania Market Y-o-Y Growth (%) Projections by End User, 2023 to 2033

Figure 239: Oceania Market Value (US$ Million) Analysis by Width, 2017 to 2033

Figure 240: Oceania Market Volume (Units) Analysis by Width, 2017 to 2033

Figure 241: Oceania Market Value Share (%) and BPS Analysis by Width, 2023 to 2033

Figure 242: Oceania Market Y-o-Y Growth (%) Projections by Width, 2023 to 2033

Figure 243: Oceania Market Value (US$ Million) Analysis by Sales Channel, 2017 to 2033

Figure 244: Oceania Market Volume (Units) Analysis by Sales Channel, 2017 to 2033

Figure 245: Oceania Market Value Share (%) and BPS Analysis by Sales Channel, 2023 to 2033

Figure 246: Oceania Market Y-o-Y Growth (%) Projections by Sales Channel, 2023 to 2033

Figure 247: Oceania Market Attractiveness by Product Type, 2023 to 2033

Figure 248: Oceania Market Attractiveness by Patient Type, 2023 to 2033

Figure 249: Oceania Market Attractiveness by End User, 2023 to 2033

Figure 250: Oceania Market Attractiveness by Width, 2023 to 2033

Figure 251: Oceania Market Attractiveness by Sales Channel, 2023 to 2033

Figure 252: Oceania Market Attractiveness by Country, 2023 to 2033

Figure 253: Middle East and Africa Market Value (US$ Million) by Product Type, 2023 to 2033

Figure 254: Middle East and Africa Market Value (US$ Million) by Patient Type, 2023 to 2033

Figure 255: Middle East and Africa Market Value (US$ Million) by End User, 2023 to 2033

Figure 256: Middle East and Africa Market Value (US$ Million) by Width, 2023 to 2033

Figure 257: Middle East and Africa Market Value (US$ Million) by Sales Channel, 2023 to 2033

Figure 258: Middle East and Africa Market Value (US$ Million) by Country, 2023 to 2033

Figure 259: Middle East and Africa Market Value (US$ Million) Analysis by Country, 2017 to 2033

Figure 260: Middle East and Africa Market Volume (Units) Analysis by Country, 2017 to 2033

Figure 261: Middle East and Africa Market Value Share (%) and BPS Analysis by Country, 2023 to 2033

Figure 262: Middle East and Africa Market Y-o-Y Growth (%) Projections by Country, 2023 to 2033

Figure 263: Middle East and Africa Market Value (US$ Million) Analysis by Product Type, 2017 to 2033

Figure 264: Middle East and Africa Market Volume (Units) Analysis by Product Type, 2017 to 2033

Figure 265: Middle East and Africa Market Value Share (%) and BPS Analysis by Product Type, 2023 to 2033

Figure 266: Middle East and Africa Market Y-o-Y Growth (%) Projections by Product Type, 2023 to 2033

Figure 267: Middle East and Africa Market Value (US$ Million) Analysis by Patient Type, 2017 to 2033

Figure 268: Middle East and Africa Market Volume (Units) Analysis by Patient Type, 2017 to 2033

Figure 269: Middle East and Africa Market Value Share (%) and BPS Analysis by Patient Type, 2023 to 2033

Figure 270: Middle East and Africa Market Y-o-Y Growth (%) Projections by Patient Type, 2023 to 2033

Figure 271: Middle East and Africa Market Value (US$ Million) Analysis by End User, 2017 to 2033

Figure 272: Middle East and Africa Market Volume (Units) Analysis by End User, 2017 to 2033

Figure 273: Middle East and Africa Market Value Share (%) and BPS Analysis by End User, 2023 to 2033

Figure 274: Middle East and Africa Market Y-o-Y Growth (%) Projections by End User, 2023 to 2033

Figure 275: Middle East and Africa Market Value (US$ Million) Analysis by Width, 2017 to 2033

Figure 276: Middle East and Africa Market Volume (Units) Analysis by Width, 2017 to 2033

Figure 277: Middle East and Africa Market Value Share (%) and BPS Analysis by Width, 2023 to 2033

Figure 278: Middle East and Africa Market Y-o-Y Growth (%) Projections by Width, 2023 to 2033

Figure 279: Middle East and Africa Market Value (US$ Million) Analysis by Sales Channel, 2017 to 2033

Figure 280: Middle East and Africa Market Volume (Units) Analysis by Sales Channel, 2017 to 2033

Figure 281: Middle East and Africa Market Value Share (%) and BPS Analysis by Sales Channel, 2023 to 2033

Figure 282: Middle East and Africa Market Y-o-Y Growth (%) Projections by Sales Channel, 2023 to 2033

Figure 283: Middle East and Africa Market Attractiveness by Product Type, 2023 to 2033

Figure 284: Middle East and Africa Market Attractiveness by Patient Type, 2023 to 2033

Figure 285: Middle East and Africa Market Attractiveness by End User, 2023 to 2033

Figure 286: Middle East and Africa Market Attractiveness by Width, 2023 to 2033

Figure 287: Middle East and Africa Market Attractiveness by Sales Channel, 2023 to 2033

Figure 288: Middle East and Africa Market Attractiveness by Country, 2023 to 2033

Recommendations

Healthcare

Diabetes Care Devices Market

Published : July 2022

Explore Healthcare Insights

View Reports