Diabetic Markers Market Size and Share Forecast Outlook (2023 to 2033)

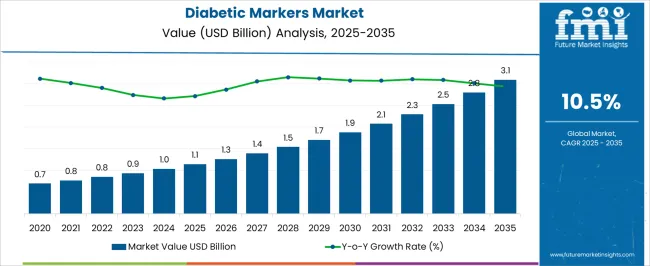
The diabetic markers market size is projected to be worth USD 928.1 million in 2023. The market is likely to surpass USD 2.6 billion by 2033 at a CAGR of 11.0% during the forecast period. The rising incidence of diabetes globally is a significant driving force in the diabetic markers market. Diabetes is a significant lifestyle illness that is a primary cause of cardiovascular disease.

Individuals have needed to uncover possible biomarkers related with diabetes in order to detect the condition early and manage it properly. This emphasis for early detection and management of diabetes, the demand for diabetic biomarker market is sky rocketing.

Other Drivers Propelling the Demand for Diabetic Markers Market include:

  • The rising incidence of diabetes globally is a significant driving force in the diabetic markers market. The expanding population of diabetics causes a high need for diagnostic tools and indicators that can effectively assess and monitor the illness.
  • The importance of early identification and management of diabetes is becoming more widely recognized. Screening programs and activities aiming at detecting people at risk of diabetes or pre-diabetes are gaining popularity. These programs increase the need for diabetes indicators as crucial tools for disease screening, diagnosis, and monitoring.
  • Developing nations' increasing emphasis on reducing anti-diabetic medicines is assisting market expansion. Anti-diabetic medications, for example, in India, currently cost between Rs 100 and Rs. 650 per Mg. Such high cost of drugs are making demand for diabetic biomarkers.

Challenges for Companies /Manufacturers in the Diabetic Markers Market:

  • Diabetes is a condition that is both complicated and diverse. It includes several forms, including type 1 diabetes, type 2 diabetes, and gestational diabetes, each with its own set of underlying causes and clinical manifestations. It is difficult to develop diabetes indicators that effectively represent this complexity and variation.
  • The diabetes markers market has obstacles in terms of standardization and consensus on diagnostic criteria and biomarker levels. The absence of standardized methods can impede comparison and limit the broad use of diabetes indicators in healthcare settings.
  • The research and development expenses associated with the creation and validation of diabetes indicators are substantial. This comprises large-scale clinical trials, the development of comprehensive biomarker profiles, and the acquisition of regulatory clearances. High development costs might be an impediment to smaller firms or research institutes entering the diabetes markers industry, restricting innovation and market competitiveness.

Opportunities in the Diabetic Markers Industry:

  • There is potential for continuing progress in diabetes biomarker research. Technological advancements in genomics, proteomics, metabolomics, and multi-omics methods provide opportunity to uncover novel biomarkers and construct more accurate and complete diagnostic panels.
  • The increased use of digital health solutions and remote monitoring platforms creates opportunities for diabetes indicators to be included into these technologies. Diabetes indicators can be integrated into continuous glucose monitoring (CGM) systems, wearable devices, and mobile health applications to give comprehensive data for diabetes management.
  • The diabetes indicators market has tremendous development potential in emerging markets. Companies may target these markets by offering low-cost, easy-to-use diagnostic products suited to the unique needs of these locations.

Latest Trends in the Diabetic Markers Market:

  • In diabetes marker research, there is a rising tendency towards using multi-omics techniques. These techniques use genomes, proteomics, metabolomics, and other -omics technologies to fully analyze the molecular profile of diabetics.
  • Genetic advances have found particular genetic markers linked to the likelihood of acquiring diabetes. To determine an individual's genetic propensity to diabetes, genetic markers and polygenic risk scores (PRS) are utilized. Incorporating genetic markers into diagnostic panels and PRS-based risk assessment can improve early identification and personalized risk stratification in diabetic people.
  • In the diabetes indicators market, point-of-care testing (POCT) and wearable devices are gaining traction. POCT devices and wearable devices enable individuals with diabetes to actively manage their condition, track biomarker trends, and make timely adjustments to their treatment plans.
Attributes Details
Diabetic Markers Market Size (2023) USD 928.1 million
Diabetic Markers Market Projected Size (2033) USD 2.6 billion
Value CAGR (2023 to 2033) 11.0%

Comparison of Historical vs Future Outlook for Diabetic Markers Market (2012 to 2033)

From 2012 to 2022, the global diabetic markers market experienced a CAGR of 15.1%, reaching a market size of USD 928.1 million in 2023.

The increased prevalence of diabetes globally has propelled the diabetic markers market's historic expansion. Diabetes is a chronic metabolic illness characterized by high blood sugar levels, and its prevalence has progressively increased as a result of factors such as sedentary lifestyles, poor diets, and an ageing population. The expanding patient population has increased demand for diagnostic tools such as diabetes indicators, resulting in historic market growth.

The trend towards personalized therapy has contributed to the diabetes markers market's historic expansion. Personalised medicine is the practice of adapting treatment regimens to an individual's unique traits and genetic makeup. Diabetic marker, such as genetic testing and biomarkers, help in the identification of particular subtypes of diabetes, the prediction of disease progression, and the development of the most successful treatment regimens. Demand for diabetes indicators has increased due to the introduction of personalized treatment techniques.

Future Forecast for Diabetic Markers Industry:

Looking ahead, the global diabetic markers market is expected to rise at a CAGR of 11.0% from 2023 to 2033. During the forecast period, the market size is expected to reach USD 2.6 billion by 2033.

In the management of diabetes, there is a rising emphasis on early identification and intervention. Early identification enables immediate intervention and the application of lifestyle changes and medicines, thereby avoiding or postponing problems.

In the diabetes indicators market, the integration of digital health solutions and remote monitoring platforms is an emerging trend. Individuals with diabetes can use mobile health applications, cloud-based platforms, and remote monitoring devices to monitor their diabetic parameters, receive personalized feedback, and connect with healthcare specialists for virtual consultations. This trend makes data-driven diabetes care easier while also improving patient participation and results.

Analysis of Top Countries Adopting Diabetic Markers

What is Spurring the Growth of the USA Market?

Country The United States
Market Size (USD Million) by End of Forecast Period (2033) USD 771.6 million
CAGR % 2023 to End of Forecast (2033) 10.0%

The diabetic markers market in the United States is expected to reach a market size of USD 771.6 million by 2033, expanding at a CAGR of 10.0%. The prevalence of diabetes in the United States has been steadily rising over the years.

  • According to the Centers for Disease Control and Prevention (CDC) 2022, approximately 34.2 million people in the USA have diabetes, and another 88 million have prediabetes.

The growing diabetic population creates a significant demand for diagnostic markers to aid in the diagnosis, monitoring, and management of the disease.

Diabetic Markers Market is Expected to Grow at a Significant Pace Owing to Growing Focus on Preventive Healthcare.

Country The United Kingdom
Market Size (USD Million) by End of Forecast Period (2033) USD 175.6 million
CAGR % 2023 to End of Forecast (2033) 8.2%

The diabetic markers market in the United Kingdom is expected to reach a market value of USD 175.6 million, expanding at a CAGR of 8.2% during the forecast period. There is a growing government initiatives and national diabetes programs. To combat the rising burden of diabetes, the United Kingdom government has developed a number of initiatives including national diabetes programs. These programs emphasize early illness detection, prevention, and better disease management. The use of diabetes indicators for screening, risk assessment, and personalized treatment methods is emphasized as part of these programs.

Why China is a Lucrative Market in East Asia Diabetic Markers Market?

Country China
Market Size (USD Million) by End of Forecast Period (2033) USD 326.1 million
CAGR % 2023 to End of Forecast (2033) 15.1%

The diabetic markers market in China is anticipated to reach a market size of USD 326.1 million by the end of 2033, growing at a CAGR of 15.1% throughout the forecast period. Significant research and development initiatives in the field of diabetes indicators have occurred in Japan. Academic institutions, research organisations, and industry participants all take an active role in the creation of novel markers and diagnostic technologies. Innovation is driven by research improvements and collaborations, which increase diagnosis accuracy and extend the market for diabetes indicators.
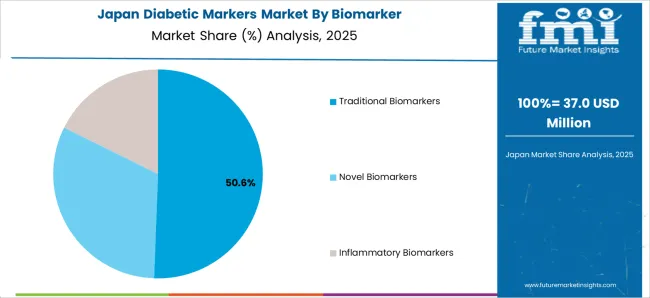
Rigorous Research and Development Efforts Have Led Japan to Develop and Innovate Novel Diabetic Markers.

Country Japan
Market Size (USD Million) by End of Forecast Period (2033) USD 203.0 million
CAGR % 2023 to End of Forecast (2033) 14.1%

The diabetic markers market in Japan is estimated to reach a market size of USD 203.0 million by 2033, expected to thrive at a CAGR of 14.1%. Significant research and development initiatives in the field of diabetes indicators have occurred in Japan. Academic institutions, research organisations, and industry participants all take an active role in the creation of novel markers and diagnostic technologies. Innovation is driven by research improvements and collaborations, which increase diagnosis accuracy and extend the market for diabetes indicators.
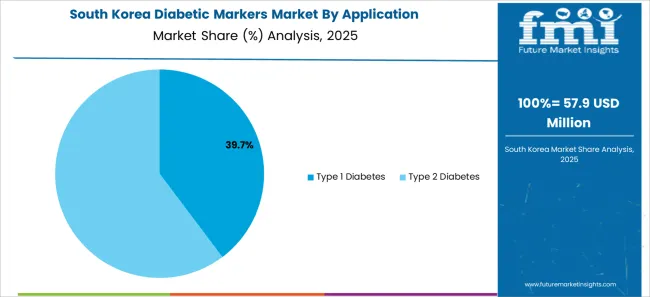
Demand for Diabetic Markers Market is Rising Due to Strong Healthcare Infrastructure.

Country South Korea
Market Size (USD Million) by End of Forecast Period (2033) USD 17.1 million
CAGR % 2023 to End of Forecast (2033) 18.2%

The diabetic markers market in South Korea is expected to reach a market size of USD 17.1 million, expanding at a CAGR of 18.2% during the forecast period. Diabetic indicators have become more accurate and efficient as diagnostic technology and inventions have advanced. South Korea has made tremendous progress in the development of diabetes biomarkers, genetic diagnostics, and point-of-care devices. Technological innovations propel the diabetes markers market forward by improving diagnostic capabilities and broadening the variety of accessible markers.

Diabetic Markers Industry Analysis by Category

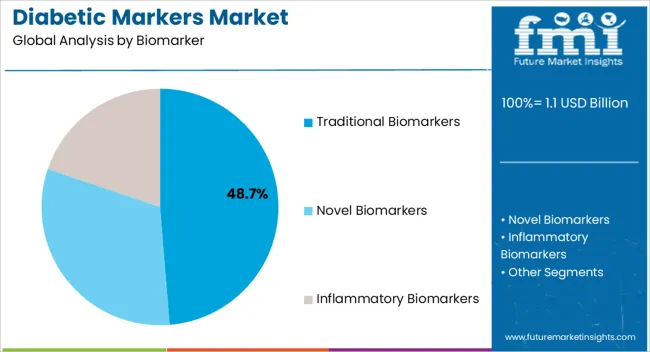
Traditional Biomarkers to Dominate Diabetic Markers Industry with 57.8% Market Share in 2022

Traditional biomarkers dominated the diabetic markers market with a market share of 57.8% in 2022. Traditional biomarkers hemoglobin A1c (HbA1c) predict chronic glycaemia better than glucose levels at a single time point and are presently the most often utilized biomarkers for diagnosing prediabetes and diabetes. Traditional biomarkers to lead the demand have more convenience since avoiding food isn't essential, greater preanalytical stability, and less day-to-day disturbance during periods of stress and sickness.

Which Application is Predominantly in Demand in the Global Scenario?

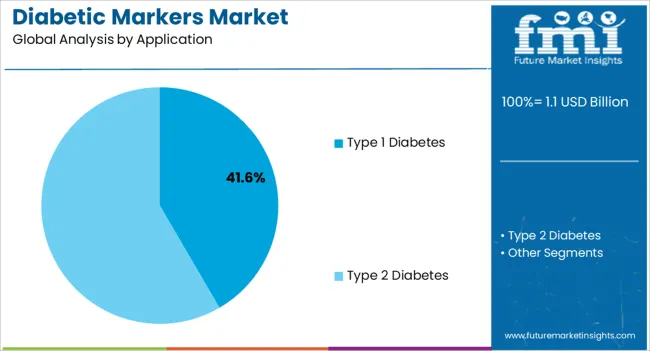
Based on application, type 2 diabetes dominated the category withholding the significant share of the market at around 71.7% at the end of 2022. Diabetes mellitus type 2 (T2DM) is a common chronic condition that is connected with the development of complications. The potential application for the management of type 2 diabetes mellitus (T2DM) is a critical element assisting in the acceptance of T2DM biomarkers. The biomarkers have also been proven to be effective in detecting diabetes mellitus. As a result, the T2DM has the largest market share in the market.

Which End User Has Widely Adopted the Diabetic Markers?

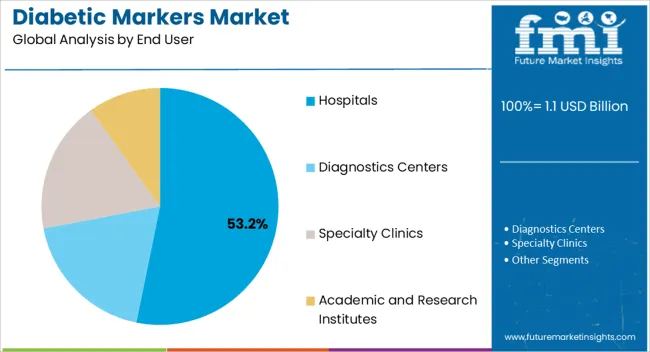
The hospitals have led the diabetic markers market as the leading end user with the market share of 44.5% in 2022. Hospitals are the principal providers of acute care, serving a diverse variety of patients, including those suffering from chronic illnesses and other life-threatening disorders. Diabetic biomarkers have great clinical usefulness in these situations, assisting with diabetes mellitus diagnosis, monitoring, and treatment. Because hospitals rely on biomarkers to assist clinical decision-making, they are market leaders.
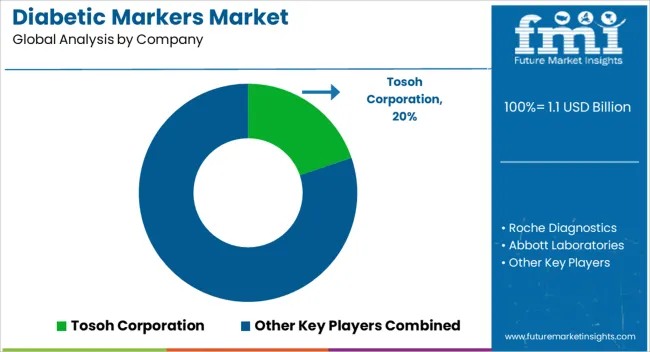
Competitive Landscape of the Diabetic Markers Market

Key players in the diabetic markers market can increase their competitiveness, differentiate their products, and maintain a strong market presence by implementing various growth strategies. In this competitive industry, long-term viability demands constant innovation, strategic alliances, efficient marketing, and strategies that prioritize clients.

Key Strategies Used by the Participants

  • Product Innovation

Key players continuously invest in research and development to introduce innovative diabetic biomarker products. They strive to develop assays with improved sensitivity, specificity, accuracy, and ease of use.

  • Strategic Partnerships and Collaborations

Key players often form strategic partnerships and collaborations with other companies, research institutions, and healthcare organizations. These partnerships can lead to knowledge sharing, joint product development, and expanded market reach.

  • Expansion into Emerging Markets

Expanding into emerging markets with growing healthcare infrastructure and rising demand for diabetic biomarker allows companies to tap into new opportunities and gain a competitive edge.

  • Mergers and Acquisitions

Companies in the market may engage in mergers or acquisitions to streamline their product portfolio, obtain new technologies, enter new market niches, and gain access to novel products or intellectual property.

Key Players in the Diabetic Markers Industry

  • Tosoh Corporation
  • Roche Diagnostics
  • Abbott Laboratories
  • Siemens Healthineers
  • Bio-Rad Laboratories
  • Becton, Dickinson and Company
  • Sysmex Corporation
  • Ortho Clinical Diagnostics
  • Beckman Coulter
  • Randox Laboratories
  • DiaSys Diagnostic Systems
  • Trividia Health

Key Developments in the Diabetic Markers Market:

  • March, 2022. In a partnership that was launched, Roche and Bristol-Myers Squibb will enhance two tests for use in clinical trials through the creation and implementation of two novel digital pathology algorithms. The first test is VENTANA PD-L1 (SP142) Assay in which Bristol Myers Squibb will be involved in the generation of biomarker data from clinical trial samples.
  • In June 2022, during a historic CES keynote, Abbott introduces a new category of biowearables. In order to provide consumers a greater understanding of their health and wellness, Abbott will measure important indicators in the body such glucose, ketones, lactate, and alcohol.

Segmentation Analysis of the Diabetic Markers Market

By Biomarker:

  • Traditional Biomarkers
  • Novel Biomarkers
  • Inflammatory Biomarkers

By Application:

  • Type 1 Diabetes
  • Type 2 Diabetes

By End User:

  • Hospitals
  • Diagnostics Centers
  • Specialty Clinics
  • Academic and Research Institutes

By Region:

  • North America
  • Latin America
  • Europe
  • East Asia
  • South Asia
  • Oceania
  • The Middle East & Africa

Table of Content

  • 1. Executive Summary
  • 2. Market Overview
  • 3. Key Market Trends
  • 4. Value Added Insights
  • 5. Market Background
  • 6. Global Market Demand (in Value or Size in USD Million) Analysis 2012 to 2022 and Forecast, 2023 to 2033
  • 7. Global Market Analysis 2012 to 2022 and Forecast 2023 to 2033, By Biomarker
    • 7.1. Traditional Biomarkers
    • 7.2. Novel Biomarkers
    • 7.3. Inflammatory Biomarkers
  • 8. Global Market Analysis 2012 to 2022 and Forecast 2023 to 2033, By Application
    • 8.1. Type 1 Diabetes
    • 8.2. Type 2 Diabetes
  • 9. Global Market Analysis 2012 to 2022 and Forecast 2023 to 2033, By End User
    • 9.1. Hospitals
    • 9.2. Diagnostics Centers
    • 9.3. Specialty Clinics
    • 9.4. Academic and Research Institutes
  • 10. Global Market Analysis 2012 to 2022 and Forecast 2023 to 2033, By Region
    • 10.1. North America
    • 10.2. Latin America
    • 10.3. Europe
    • 10.4. South Asia
    • 10.5. East Asia
    • 10.6. Oceania
    • 10.7. Middle East and Africa (Middle East & Africa)
  • 11. North America Market Analysis 2012 to 2022 and Forecast 2023 to 2033
  • 12. Latin America Market Analysis 2012 to 2022 and Forecast 2023 to 2033
  • 13. Europe Market Analysis 2012 to 2022 and Forecast 2023 to 2033
  • 14. South Asia Market Analysis 2012 to 2022 and Forecast 2023 to 2033
  • 15. East Asia Market Analysis 2012 to 2022 and Forecast 2023 to 2033
  • 16. Oceania Market Analysis 2012 to 2022 and Forecast 2023 to 2033
  • 17. Middle East and Africa Market Analysis 2012 to 2022 and Forecast 2023 to 2033
  • 18. Market Structure Analysis
  • 19. Competition Analysis
    • 19.1. Tosoh Corporation
    • 19.2. Roche Diagnostics
    • 19.3. Abbott Laboratories
    • 19.4. Siemens Healthineers
    • 19.5. Bio-Rad Laboratories
    • 19.6. Becton, Dickinson and Company
    • 19.7. Sysmex Corporation
    • 19.8. Ortho Clinical Diagnostics
    • 19.9. Beckman Coulter
    • 19.10. Randox Laboratories
    • 19.11. DiaSys Diagnostic Systems
    • 19.12. Trividia Health
  • 20. Assumptions and Acronyms Used
  • 21. Research Methodology

List of Tables

Table 01: Global Market Value (US$ Million) Analysis and Forecast 2012 to 2033, by Biomarker

Table 02: Global Market Value (US$ Million) Analysis and Forecast 2012 to 2033, by Application

Table 03: Global Market Value (US$ Million) Analysis and Forecast 2012 to 2033, by End User

Table 04: Global Market Value (US$ Million) Analysis and Forecast 2012 to 2033, by Region

Table 05: North America Market Value (US$ Million) Analysis 2012 to 2022 and Forecast 2023 to 2033, by Country

Table 06: North America Market Value (US$ Million) Analysis and Forecast 2012 to 2033, by Biomarker

Table 07: North America Market Value (US$ Million) Analysis and Forecast 2012 to 2033, by Application

Table 08: North America Market Value (US$ Million) Analysis and Forecast 2012 to 2033, by End User

Table 09: Latin America Market Value (US$ Million) Analysis 2012 to 2022 and Forecast 2023 to 2033, by Country

Table 10: Latin America Market Value (US$ Million) Analysis and Forecast 2012 to 2033, by Biomarker

Table 11: Latin America Market Value (US$ Million) Analysis and Forecast 2012 to 2033, by Application

Table 12: Latin America Market Value (US$ Million) Analysis and Forecast 2012 to 2033, by End User

Table 13: Europe Market Value (US$ Million) Analysis 2012 to 2022 and Forecast 2023 to 2033, by Country

Table 14: Europe Market Value (US$ Million) Analysis and Forecast 2012 to 2033, by Biomarker

Table 15: Europe Market Value (US$ Million) Analysis and Forecast 2012 to 2033, by Application

Table 16: Europe Market Value (US$ Million) Analysis and Forecast 2012 to 2033, by End User

Table 17: South Asia Market Value (US$ Million) Analysis 2012 to 2022 and Forecast 2023 to 2033, by Country

Table 18: South Asia Market Value (US$ Million) Analysis and Forecast 2012 to 2033, by Biomarker

Table 19: South Asia Market Value (US$ Million) Analysis and Forecast 2012 to 2033, by Application

Table 20: South Asia Market Value (US$ Million) Analysis and Forecast 2012 to 2033, by End User

Table 21: East Asia Market Value (US$ Million) Analysis 2012 to 2022 and Forecast 2023 to 2033, by Country

Table 22: East Asia Market Value (US$ Million) Analysis and Forecast 2012 to 2033, by Biomarker

Table 23: East Asia Market Value (US$ Million) Analysis and Forecast 2012 to 2033, by Application

Table 24: East Asia Market Value (US$ Million) Analysis and Forecast 2012 to 2033, by End User

Table 25: Oceania Market Value (US$ Million) Analysis 2012 to 2022 and Forecast 2023 to 2033, by Country

Table 26: Oceania Market Value (US$ Million) Analysis and Forecast 2012 to 2033, by Biomarker

Table 27: Oceania Market Value (US$ Million) Analysis and Forecast 2012 to 2033, by Application

Table 28: Oceania Market Value (US$ Million) Analysis and Forecast 2012 to 2033, by End User

Table 29: Middle East & Africa Market Value (US$ Million) Analysis 2012 to 2022 and Forecast 2023 to 2033, by Country

Table 30: Middle East & Africa Market Value (US$ Million) Analysis and Forecast 2012 to 2033, by Biomarker

Table 31: Middle East & Africa Market Value (US$ Million) Analysis and Forecast 2012 to 2033, by Application

Table 32: Middle East & Africa Market Value (US$ Million) Analysis and Forecast 2012 to 2033, by End User

List of Figures

Figure 01: Global Market Value (US$ Million) Analysis, 2012 to 2022

Figure 02: Global Market Forecast & Y-o-Y Growth, 2023 to 2033

Figure 03: Global Market Absolute $ Opportunity (US$ Million) Analysis, 2023 to 2033

Figure 04: Global Market Value Share (%) Analysis 2023 and 2033, by Biomarker

Figure 05: Global Market Y-o-Y Growth (%) Analysis 2023 to 2033, by Biomarker

Figure 06: Global Market Attractiveness Analysis 2023 to 2033, by Biomarker

Figure 07: Global Market Value Share (%) Analysis 2023 and 2033, by Application

Figure 08: Global Market Y-o-Y Growth (%) Analysis 2023 to 2033, by Application

Figure 09: Global Market Attractiveness Analysis 2023 to 2033, by Application

Figure 10: Global Market Value Share (%) Analysis 2023 and 2033, by End User

Figure 11: Global Market Y-o-Y Growth (%) Analysis 2023 to 2033, by End User

Figure 12: Global Market Attractiveness Analysis 2023 to 2033, by End User

Figure 13: Global Market Value Share (%) Analysis 2023 and 2033, by Region

Figure 14: Global Market Y-o-Y Growth (%) Analysis 2023 to 2033, by Region

Figure 15: Global Market Attractiveness Analysis 2023 to 2033, by Region

Figure 16: North America Market Value (US$ Million) Analysis, 2012 to 2022

Figure 17: North America Market Value (US$ Million) Forecast, 2023 to 2033

Figure 18: North America Market Value Share, by Biomarker (2023 E)

Figure 19: North America Market Value Share, by Application (2023 E)

Figure 20: North America Market Value Share, by End User (2023 E)

Figure 21: North America Market Value Share, by Country (2023 E)

Figure 22: North America Market Attractiveness Analysis by Biomarker, 2023 to 2033

Figure 23: North America Market Attractiveness Analysis by Application, 2023 to 2033

Figure 24: North America Market Attractiveness Analysis by End User, 2023 to 2033

Figure 25: North America Market Attractiveness Analysis by Country, 2023 to 2033

Figure 26: USA Market Value Proportion Analysis, 2022

Figure 27: Global Vs. USA Growth Comparison

Figure 28: USA Market Share Analysis (%) by Biomarker, 2023 & 2033

Figure 29: USA Market Share Analysis (%) by Application, 2023 & 2033

Figure 30: USA Market Share Analysis (%) by End User, 2023 & 2033

Figure 31: Canada Market Value Proportion Analysis, 2022

Figure 32: Global Vs. Canada. Growth Comparison

Figure 33: Canada Market Share Analysis (%) by Biomarker, 2023 & 2033

Figure 34: Canada Market Share Analysis (%) by Application, 2023 & 2033

Figure 35: Canada Market Share Analysis (%) by End User, 2023 & 2033

Figure 36: Latin America Market Value (US$ Million) Analysis, 2012 to 2022

Figure 37: Latin America Market Value (US$ Million) Forecast, 2023 to 2033

Figure 38: Latin America Market Value Share, by Biomarker (2023 E)

Figure 39: Latin America Market Value Share, by Application (2023 E)

Figure 40: Latin America Market Value Share, by End User (2023 E)

Figure 41: Latin America Market Value Share, by Country (2023 E)

Figure 42: Latin America Market Attractiveness Analysis by Biomarker, 2023 to 2033

Figure 43: Latin America Market Attractiveness Analysis by Application, 2023 to 2033

Figure 44: Latin America Market Attractiveness Analysis by End User, 2023 to 2033

Figure 45: Latin America Market Attractiveness Analysis by Country, 2023 to 2033

Figure 46: Mexico Market Value Proportion Analysis, 2022

Figure 47: Global Vs Mexico Growth Comparison

Figure 48: Mexico Market Share Analysis (%) by Biomarker, 2023 & 2033

Figure 49: Mexico Market Share Analysis (%) by Application, 2023 & 2033

Figure 50: Mexico Market Share Analysis (%) by End User, 2023 & 2033

Figure 51: Brazil Market Value Proportion Analysis, 2022

Figure 52: Global Vs. Brazil. Growth Comparison

Figure 53: Brazil Market Share Analysis (%) by Biomarker, 2023 & 2033

Figure 54: Brazil Market Share Analysis (%) by Application, 2023 & 2033

Figure 55: Brazil Market Share Analysis (%) by End User, 2023 & 2033

Figure 56: Argentina Market Value Proportion Analysis, 2022

Figure 57: Global Vs Argentina Growth Comparison

Figure 58: Argentina Market Share Analysis (%) by Biomarker, 2023 & 2033

Figure 59: Argentina Market Share Analysis (%) by Application, 2023 & 2033

Figure 60: Argentina Market Share Analysis (%) by End User, 2023 & 2033

Figure 61: Europe Market Value (US$ Million) Analysis, 2012 to 2022

Figure 62: Europe Market Value (US$ Million) Forecast, 2023 to 2033

Figure 63: Europe Market Value Share, by Biomarker (2023 E)

Figure 64: Europe Market Value Share, by Application (2023 E)

Figure 65: Europe Market Value Share, by End User (2023 E)

Figure 66: Europe Market Value Share, by Country (2023 E)

Figure 67: Europe Market Attractiveness Analysis by Biomarker, 2023 to 2033

Figure 68: Europe Market Attractiveness Analysis by Application, 2023 to 2033

Figure 69: Europe Market Attractiveness Analysis by End User, 2023 to 2033

Figure 70: Europe Market Attractiveness Analysis by Country, 2023 to 2033

Figure 71: UK Market Value Proportion Analysis, 2022

Figure 72: Global Vs. UK Growth Comparison

Figure 73: UK Market Share Analysis (%) by Biomarker, 2023 & 2033

Figure 74: UK Market Share Analysis (%) by Application, 2023 & 2033

Figure 75: UK Market Share Analysis (%) by End User, 2023 & 2033

Figure 76: Germany Market Value Proportion Analysis, 2022

Figure 77: Global Vs. Germany Growth Comparison

Figure 78: Germany Market Share Analysis (%) by Biomarker, 2023 & 2033

Figure 79: Germany Market Share Analysis (%) by Application, 2023 & 2033

Figure 80: Germany Market Share Analysis (%) by End User, 2023 & 2033

Figure 81: Italy Market Value Proportion Analysis, 2022

Figure 82: Global Vs. Italy Growth Comparison

Figure 83: Italy Market Share Analysis (%) by Biomarker, 2023 & 2033

Figure 84: Italy Market Share Analysis (%) by Application, 2023 & 2033

Figure 85: Italy Market Share Analysis (%) by End User, 2023 & 2033

Figure 86: France Market Value Proportion Analysis, 2022

Figure 87: Global Vs France Growth Comparison

Figure 88: France Market Share Analysis (%) by Biomarker, 2023 & 2033

Figure 89: France Market Share Analysis (%) by Application, 2023 & 2033

Figure 90: France Market Share Analysis (%) by End User, 2023 & 2033

Figure 91: Spain Market Value Proportion Analysis, 2022

Figure 92: Global Vs Spain Growth Comparison

Figure 93: Spain Market Share Analysis (%) by Biomarker, 2023 & 2033

Figure 94: Spain Market Share Analysis (%) by Application, 2023 & 2033

Figure 95: Spain Market Share Analysis (%) by End User, 2023 & 2033

Figure 96: Russia Market Value Proportion Analysis, 2022

Figure 97: Global Vs Russia Growth Comparison

Figure 98: Russia Market Share Analysis (%) by Biomarker, 2023 & 2033

Figure 99: Russia Market Share Analysis (%) by Application, 2023 & 2033

Figure 100: Russia Market Share Analysis (%) by End User, 2023 & 2033

Figure 101: BENELUX Market Value Proportion Analysis, 2022

Figure 102: Global Vs BENELUX Growth Comparison

Figure 103: BENELUX Market Share Analysis (%) by Biomarker, 2023 & 2033

Figure 104: BENELUX Market Share Analysis (%) by Application, 2023 & 2033

Figure 105: BENELUX Market Share Analysis (%) by End User, 2023 & 2033

Figure 106: East Asia Market Value (US$ Million) Analysis, 2012 to 2022

Figure 107: East Asia Market Value (US$ Million) Forecast, 2023 to 2033

Figure 108: East Asia Market Value Share, by Biomarker (2023 E)

Figure 109: East Asia Market Value Share, by Application (2023 E)

Figure 110: East Asia Market Value Share, by End User (2023 E)

Figure 111: East Asia Market Value Share, by Country (2023 E)

Figure 112: East Asia Market Attractiveness Analysis by Biomarker, 2023 to 2033

Figure 113: East Asia Market Attractiveness Analysis by Application, 2023 to 2033

Figure 114: East Asia Market Attractiveness Analysis by End User, 2023 to 2033

Figure 115: East Asia Market Attractiveness Analysis by Country, 2023 to 2033

Figure 116: China Market Value Proportion Analysis, 2022

Figure 117: Global Vs. China Growth Comparison

Figure 118: China Market Share Analysis (%) by Biomarker, 2023 & 2033

Figure 119: China Market Share Analysis (%) by Application, 2023 & 2033

Figure 120: China Market Share Analysis (%) by End User, 2023 & 2033

Figure 121: Japan Market Value Proportion Analysis, 2022

Figure 122: Global Vs. Japan Growth Comparison

Figure 123: Japan Market Share Analysis (%) by Biomarker, 2023 & 2033

Figure 124: Japan Market Share Analysis (%) by Application, 2023 & 2033

Figure 125: Japan Market Share Analysis (%) by End User, 2023 & 2033

Figure 126: South Korea Market Value Proportion Analysis, 2022

Figure 127: Global Vs South Korea Growth Comparison

Figure 128: South Korea Market Share Analysis (%) by Biomarker, 2023 & 2033

Figure 129: South Korea Market Share Analysis (%) by Application, 2023 & 2033

Figure 130: South Korea Market Share Analysis (%) by End User, 2023 & 2033

Figure 131: South Asia Market Value (US$ Million) Analysis, 2012 to 2022

Figure 132: South Asia Market Value (US$ Million) Forecast, 2023 to 2033

Figure 133: South Asia Market Value Share, by Biomarker (2023 E)

Figure 134: South Asia Market Value Share, by Application (2023 E)

Figure 135: South Asia Market Value Share, by End User (2023 E)

Figure 136: South Asia Market Value Share, by Country (2023 E)

Figure 137: South Asia Market Attractiveness Analysis by Biomarker, 2023 to 2033

Figure 138: South Asia Market Attractiveness Analysis by Application, 2023 to 2033

Figure 139: South Asia Market Attractiveness Analysis by End User, 2023 to 2033

Figure 140: South Asia Market Attractiveness Analysis by Country, 2023 to 2033

Figure 141: India Market Value Proportion Analysis, 2022

Figure 142: Global Vs. India Growth Comparison

Figure 143: India Market Share Analysis (%) by Biomarker, 2023 & 2033

Figure 144: India Market Share Analysis (%) by Application, 2023 & 2033

Figure 145: India Market Share Analysis (%) by End User, 2023 & 2033

Figure 146: Indonesia Market Value Proportion Analysis, 2022

Figure 147: Global Vs. Indonesia Growth Comparison

Figure 148: Indonesia Market Share Analysis (%) by Biomarker, 2023 & 2033

Figure 149: Indonesia Market Share Analysis (%) by Application, 2023 & 2033

Figure 150: Indonesia Market Share Analysis (%) by End User, 2023 & 2033

Figure 151: Malaysia Market Value Proportion Analysis, 2022

Figure 152: Global Vs. Malaysia Growth Comparison

Figure 153: Malaysia Market Share Analysis (%) by Biomarker, 2023 & 2033

Figure 154: Malaysia Market Share Analysis (%) by Application, 2023 & 2033

Figure 155: Malaysia Market Share Analysis (%) by End User, 2023 & 2033

Figure 156: Thailand Market Value Proportion Analysis, 2022

Figure 157: Global Vs. Thailand Growth Comparison

Figure 158: Thailand Market Share Analysis (%) by Biomarker, 2023 & 2033

Figure 159: Thailand Market Share Analysis (%) by Application, 2023 & 2033

Figure 160: Thailand Market Share Analysis (%) by End User, 2023 & 2033

Figure 161: Oceania Market Value (US$ Million) Analysis, 2012 to 2022

Figure 162: Oceania Market Value (US$ Million) Forecast, 2023 to 2033

Figure 163: Oceania Market Value Share, by Biomarker (2023 E)

Figure 164: Oceania Market Value Share, by Application (2023 E)

Figure 165: Oceania Market Value Share, by End User (2023 E)

Figure 166: Oceania Market Value Share, by Country (2023 E)

Figure 167: Oceania Market Attractiveness Analysis by Biomarker, 2023 to 2033

Figure 168: Oceania Market Attractiveness Analysis by Application, 2023 to 2033

Figure 169: Oceania Market Attractiveness Analysis by End User, 2023 to 2033

Figure 170: Oceania Market Attractiveness Analysis by Country, 2023 to 2033

Figure 171: Australia Market Value Proportion Analysis, 2022

Figure 172: Global Vs. Australia Growth Comparison

Figure 173: Australia Market Share Analysis (%) by Biomarker, 2023 & 2033

Figure 174: Australia Market Share Analysis (%) by Application, 2023 & 2033

Figure 175: Australia Market Share Analysis (%) by End User, 2023 & 2033

Figure 176: New Zealand Market Value Proportion Analysis, 2022

Figure 177: Global Vs New Zealand Growth Comparison

Figure 178: New Zealand Market Share Analysis (%) by Biomarker, 2023 & 2033

Figure 179: New Zealand Market Share Analysis (%) by Application, 2023 & 2033

Figure 180: New Zealand Market Share Analysis (%) by End User, 2023 & 2033

Figure 181: Middle East & Africa Market Value (US$ Million) Analysis, 2012 to 2022

Figure 182: Middle East & Africa Market Value (US$ Million) Forecast, 2023 to 2033

Figure 183: Middle East & Africa Market Value Share, by Biomarker (2023 E)

Figure 184: Middle East & Africa Market Value Share, by Application (2023 E)

Figure 185: Middle East & Africa Market Value Share, by End User (2023 E)

Figure 186: Middle East & Africa Market Value Share, by Country (2023 E)

Figure 187: Middle East & Africa Market Attractiveness Analysis by Biomarker, 2023 to 2033

Figure 188: Middle East & Africa Market Attractiveness Analysis by Application, 2023 to 2033

Figure 189: Middle East & Africa Market Attractiveness Analysis by End User, 2023 to 2033

Figure 190: Middle East & Africa Market Attractiveness Analysis by Country, 2023 to 2033

Figure 191: GCC Countries Market Value Proportion Analysis, 2022

Figure 192: Global Vs GCC Countries Growth Comparison

Figure 193: GCC Countries Market Share Analysis (%) by Biomarker, 2023 & 2033

Figure 194: GCC Countries Market Share Analysis (%) by Application, 2023 & 2033

Figure 195: GCC Countries Market Share Analysis (%) by End User, 2023 & 2033

Figure 196: Türkiye Market Value Proportion Analysis, 2022

Figure 197: Global Vs. Türkiye Growth Comparison

Figure 198: Türkiye Market Share Analysis (%) by Biomarker, 2023 & 2033

Figure 199: Türkiye Market Share Analysis (%) by Application, 2023 & 2033

Figure 200: Türkiye Market Share Analysis (%) by End User, 2023 & 2033

Figure 201: South Africa Market Value Proportion Analysis, 2022

Figure 202: Global Vs. South Africa Growth Comparison

Figure 203: South Africa Market Share Analysis (%) by Biomarker, 2023 & 2033

Figure 204: South Africa Market Share Analysis (%) by Application, 2023 & 2033

Figure 205: South Africa Market Share Analysis (%) by End User, 2023 & 2033

Figure 206: Northern Africa Market Value Proportion Analysis, 2022

Figure 207: Global Vs Northern Africa Growth Comparison

Figure 208: Northern Africa Market Share Analysis (%) by Biomarker, 2023 & 2033

Figure 209: Northern Africa Market Share Analysis (%) by Application, 2023 & 2033

Figure 210: Northern Africa Market Share Analysis (%) by End User, 2023 & 2033

Frequently Asked Questions

What is the Current Worth of the Diabetic Markers Market?

The global diabetic markers market is expected to reach a valuation of USD 928.1 million by 2023.

How is the Demand for Diabetic Markers Market Increasing?

The diabetic markers market demand is set to expand by 11.0% during the assessment period.

Which Therapeutic Area Holds the Notable Market Share in the Global Diabetic Markers Market?

The traditional biomarker is projected to hold the dominant share of the market.

What is the Predicted Valuation of the Diabetic Markers Market by 2033?

The market is predicted to exceed USD 2.6 billion by 2033.

Which is the Most Profitable Region for the Diabetic Markers Industry?

The North America offers key opportunities for new entrants in the diabetic markers market.

What is the growth rate from 2023 to 2033?

The market will expand at an 11% CAGR from 2023 to 2033.

What is the 2023 market value?

The market in 2023 totals USD 928.1 million.

What country shows high lucrativeness in the market?

United States is expected to value USD 771.6 million.

What is the projected market size by 2033?

The market is expected to reach USD 2.6 billion by 2033.

How did the market perform historically?

From 2018 to 2022, the market rose at a 15.1% CAGR.

Explore In-vitro Diagnostics Devices Insights

Future Market Insights

Diabetic Markers Market