Imaging Markers Market Size, Share, and Forecast Outlook 2025 to 2035

The imaging markers market is projected to grow from USD 1.2 billion in 2025 to USD 2.3 billion by 2035, registering a CAGR of 6.8%.Between 2025 and 2035, demand for imaging markers expanded due to increased use in oncology and neurology diagnostics, particularly in MRI and PET applications.
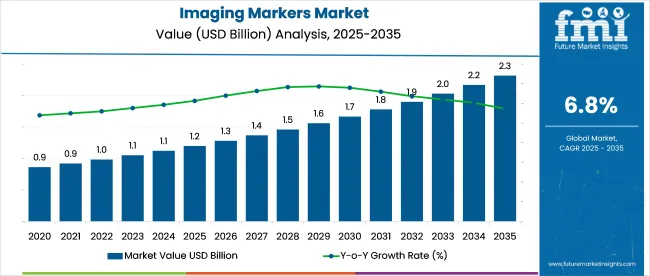
Quick Stats in Imaging Markers Market

  • Market Size (2025): USD 1.2 billion
  • Market Forecast (2035): USD 2.3 billion
  • CAGR (2025 to 2035): 6.8%
  • Top Marker Segment: MRI Markers (32.0% share in 2025)
  • Leading Therapeutic Area: Oncology (46.0% share in 2025)
  • Top Growing Country: China (8.9% CAGR)

Imaging Markers Market

Rising cancer incidence globally and enhanced reimbursement for image-guided procedures contributed to early-stage growth. High demand for precision imaging in North America and Western Europe accelerated adoption, with a strong pull from radiology departments and clinical research centers.

By 2025, imaging markers have become integral to diagnostic imaging workflows, improving the visualization of soft tissues, metabolic activity, and vascular structures. Continued integration with AI-assisted interpretation systems is enabling radiologists to extract quantifiable data from scans, especially in tumor tracking and neurodegenerative disease monitoring. Growth is further supported by the adoption of personalized medicine approaches, where imaging biomarkers are used to monitor treatment response and disease progression.

The market outlook through 2035 is positive, with increasing investments in contrast agent innovation and dual-modality markers. Challenges remain in regulatory approval timelines, standardization of imaging protocols, and marker-specific safety validation. Expansion into Asia and Latin America is expected as diagnostic infrastructure matures.

The imaging markers market holds a strategic role within several core healthcare verticals. In the global medical imaging industry, valued at over USD 45 billion, imaging markers account for nearly 3-5%, owing to their precision support in diagnostic scans. Within the USD 90 billion oncology diagnostics space, around 6-8% is influenced by imaging marker integration for tumor tracking and response monitoring.

In nuclear medicine, which exceeds USD 10 billion, PET/SPECT-compatible imaging markers contribute close to 10-12% due to their role in metabolic and functional imaging. The clinical trials sector, worth nearly USD 60 billion, attributes 4-6% of diagnostic tool usage to imaging biomarkers for patient stratification. Even in the USD 25 billion contrast agent segment, 5-7% involves imaging markers used for targeted imaging applications.

Analyzing Imaging Markers Market by Top Investment Segments

The market continues to gain momentum across hospital diagnostic centers, MRI-based technologies, and cancer-focused imaging solutions. Innovation in non-invasive diagnostics and real-time image enhancement is steering long-term growth across multiple healthcare verticals.
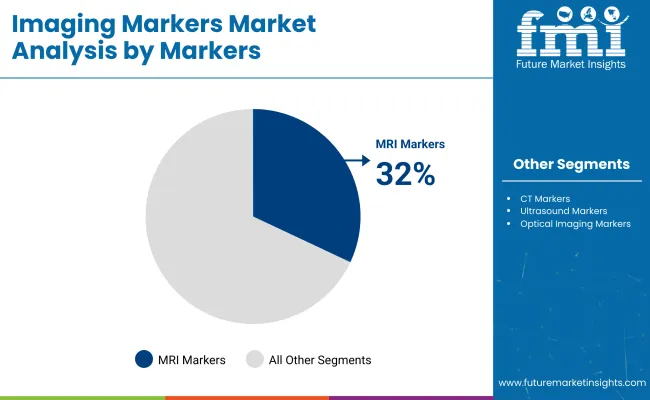
MRI Markers Lead Imaging Precision with 32.0% Market Share

Imaging Markers Market Analysis By Markers

MRI markers are anticipated to secure 32.0% of the global market by 2025. These markers improve visibility in MRI scans and aid in accurate anatomical localization, particularly for neurological and soft-tissue imaging. Demand is being driven by widespread adoption in hospital-based MRI suites and radiology labs.
  • Radiologists use MRI markers to track lesion progression without radiation exposure.
  • Consistent demand from neurology and musculoskeletal clinics supports recurring usage.
  • Integration with AI-based imaging software enhances diagnostic accuracy and workflow efficiency.

Oncology Imaging Surges Ahead with 46.0% Market Share

Imaging Markers Market Analysis By Therapeutic Area

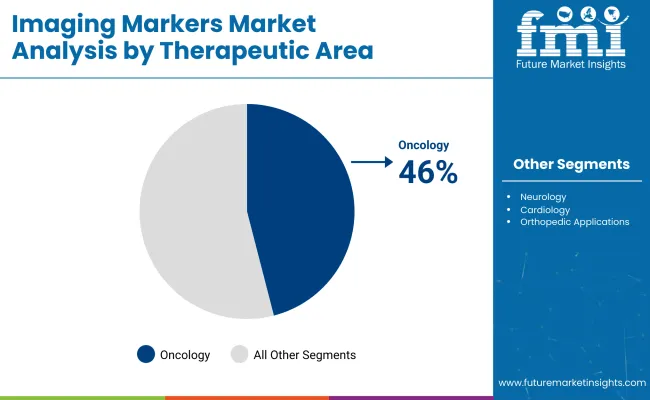
Oncology accounts for 46.0% of the imaging markers market by 2025, emerging as the dominant therapeutic area. These markers are essential for tumor detection, therapy planning, and post-treatment evaluation. The oncology segment is growing due to increased cancer incidence and adoption of precision medicine protocols.
  • Tumor tracking and metastasis visualization are enhanced using radiopaque and MR-visible markers.
  • Cancer centers prioritize marker-based imaging to improve early-stage detection.
  • Integration with immunotherapy and radiotherapy is fueling higher uptake in oncology diagnostics.

Diagnostic Applications Take the Lead with 42.0% Market Share

Imaging Markers Market Analysis By Application

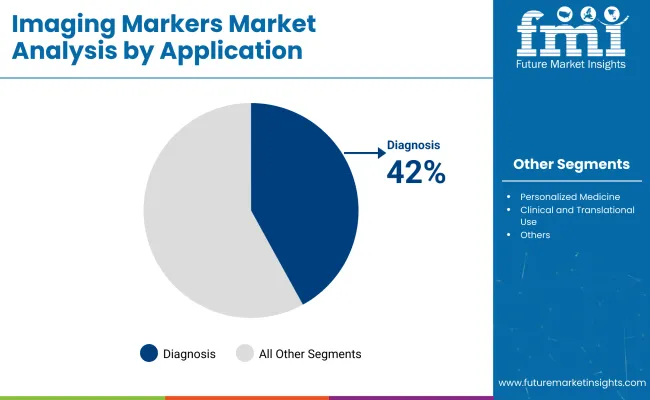
Diagnosis is forecast to be the top application segment, capturing 42.0% of total market share by 2025. Imaging markers are used to detect a range of conditions, from cardiac irregularities to neurological disorders, enhancing early-stage detection capabilities.
  • Hospitals use imaging markers in CT, PET, and MRI procedures to refine diagnostic accuracy.
  • Non-invasive scans using markers support early intervention for chronic diseases.
  • Growth in preventive health screening fuels demand for diagnostic-focused marker technologies.

Hospitals Dominate Usage Landscape with 38.0% Market Share

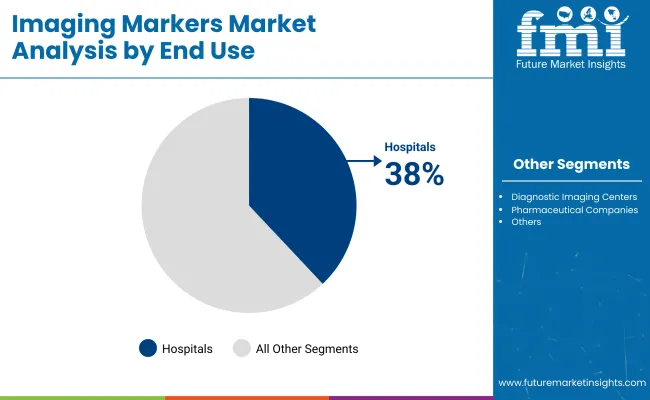
Imaging Markers Market Analysis By End Use

Hospitals are expected to generate 38.0% of the imaging marker demand by 2025, making them the leading end-use segment. Investments in MRI and CT systems across public and private hospitals are expanding market opportunities.

  • Imaging markers are embedded into clinical protocols for oncology, orthopedics, and cardiology.
  • Multi-specialty hospitals require marker-based systems to meet quality and precision benchmarks.
  • Expansion of diagnostic imaging departments in emerging economies further accelerates growth.

Top Imaging Markers Market Dynamics

Growth in the market is being shaped by accelerated use in oncology and neuroimaging, alongside advances in radiotracer stability and multi-modal integration. Demand is rising for high-affinity, low-toxicity compounds that improve lesion detectability, streamline diagnostics, and support AI-assisted scan interpretation across PET, SPECT, and MRI platforms.

Oncology Imaging Sees Marker-Driven Workflow Efficiency

Imaging markers tailored for tumor localization drove a 47% increase in PET-CT scan volumes in cancer centers between Q2 2024 and Q2 2025. Markers with half-lives of 90-110 minutes enabled batch preparation, improving scanner utilization by 26%.

Enhanced tumor-to-background ratios (≥4.5:1) improved lesion visibility in dense tissue regions. Automated marker-dosing modules cut tracer preparation time by 33%, while paired AI interpretation tools reduced scan-to-report intervals from 4.8 to 3.2 hours.

Oncology-focused markers now account for 58% of all imaging marker procurement, with breast, lung, and prostate scans dominating usage. These trends continue to push hybrid marker development and modular radio pharmacy expansion.

Neuroimaging Demands High-Specificity Tracers

Neurology centers prioritized imaging markers targeting amyloid, tau, and dopamine pathways, contributing to a 41% YoY rise in PET tracer consumption for neurodegenerative diagnostics. Markers with ≤2% off-target binding saw 29% higher adoption due to improved signal precision in cortical regions.

Facilities using high-specificity tracers reduced follow-up scan requirements by 22%, translating into annual operational savings of USD 420,000 in mid-size hospitals. Co-registration accuracy improved by 18% when paired with dual-isotope protocols.

These markers are increasingly bundled with cloud-based neuro analytics platforms, enabling faster differential diagnosis of Alzheimer’s, Parkinson’s, and frontotemporal dementia. Their clinical and operational impact is reshaping neuro-PET investment decisions.
Top Countries Innovating, Manufacturing, Supplying, and Scaling Imaging Markers

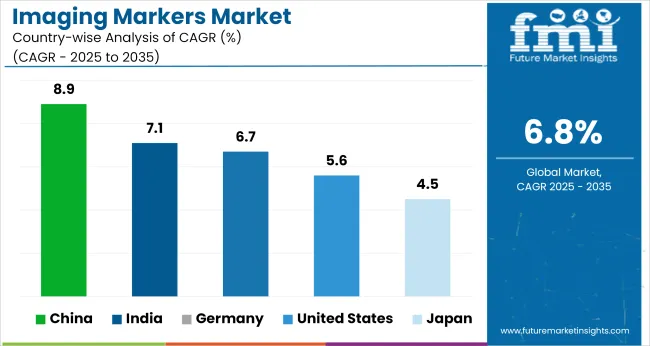
Imaging Markers Market Cagr Analysis By Country

Countries CAGR (2025 to 2035)
China 8.9%
India 7.1%
Germany 6.7%
United States 5.6%
Japan 4.5%

The global market is projected to grow at a CAGR of 6.8% between 2025 and 2035. China leads with an 8.9% CAGR, outperforming the global average by over 30%, supported by expansion in oncology imaging infrastructure and a surge in clinical trial activity. India also posts strong momentum at 7.1%, attributed to broader access to radiopharmaceuticals and private diagnostic investment across urban centers.

Germany, representing OECD markets, closely aligns with the global trend at 6.7%, with growth driven by the integration of AI-guided imaging in hospitals. The USA lags at 5.6%, falling 18% below the global baseline, reflecting slower capital expenditure in smaller healthcare networks. Japan records the weakest growth among the profiled nations at 4.5%, constrained by stringent approval cycles for novel contrast agents and a shrinking patient base due to demographic aging, placing it 34% under the global CAGR.

The report provides insights across 40+ countries. The five below are highlighted for their strategic influence and growth trajectory.

Precision Imaging Technology Advancements Propel Growth in China

The market in China is projected to expand at a CAGR of 8.9% from 2025 to 2035. Between 2020 and 2024, growth was driven primarily by oncology-focused applications within large public hospitals. Looking ahead, the next decade will witness accelerated uptake in AI-assisted diagnostics, nuclear medicine centers, and high-resolution PET and MRI technologies. Nationwide deployment of tiered healthcare and a surge in imaging volumes is boosting demand for molecular imaging markers.

  • Over 600 tertiary hospitals are investing in high-sensitivity radiotracers
  • AI-based image annotation platforms now integrate imaging markers for precision diagnosis
  • Public-private funding for imaging biomarker development has grown 18% YoY since 2022

India Sees Robust Uptake in Radiotracer and Contrast Marker Applications

India is forecast to register a CAGR of 7.1% between 2025 and 2035. From 2020 to 2024, limited infrastructure and high cost constrained demand, but recent improvements in imaging facility density and insurance coverage are expanding the market base. Increasing usage of contrast markers in CT and MRI scans, particularly in cardiac and neurological diagnostics, is enhancing the role of markers in clinical imaging workflows.

  • Over 200 new diagnostic centers expected to be operational by 2027
  • Central funding under PM-ABHIM boosting radio diagnostic infrastructure
  • Private labs scaling up radiopharmaceutical marker usage in metro and tier-2 cities

Germany Accelerates Clinical Trial Adoption of Imaging Markers

Germany is anticipated to grow at a CAGR of 6.7% through 2035. During 2020 to 2024, usage was concentrated in diagnostic radiology and hospital oncology departments. Since 2025, clinical trial centers and CROs have increased their reliance on imaging biomarkers for endpoint assessment, particularly in neurodegenerative and autoimmune disease research. Imaging biomarker quantification is now standard in Phase II and III drug trials.

  • EMA-aligned imaging validation protocols accelerating marker adoption
  • Over 60% of clinical research organizations now utilize molecular imaging endpoints
  • Expansion of PET-CT installations in academic research hospitals driving demand

United States Expands Use of Imaging Markers in Personalized Medicine

The US market is projected to grow at a CAGR of 5.6% between 2025 and 2035. From 2020 to 2024, demand centered around oncology diagnostics and hospital radiology departments. Recent trends show significant movement toward personalized medicine, where imaging markers are being used to monitor drug response, disease staging, and early detection. Integration of imaging data with genomics and EHR platforms is reshaping radiological workflows.

  • 1 in 3 academic hospitals now utilize imaging markers in precision oncology trials
  • Growth in Alzheimer’s and cardiac PET markers is strengthening outpatient demand
  • AI firms increasingly developing marker-enhanced diagnostic algorithms

Japan Expands Radiopharmaceutical Infrastructure to Support Marker Demand

Japan is forecast to grow at a CAGR of 4.5% from 2025 to 2035. Between 2020 and 2024, usage was primarily limited to major university hospitals and cancer centers. The next phase will see broader use of imaging markers in regional diagnostic clinics, driven by new guidelines promoting early disease detection. Government investment in domestic radiopharmaceutical production is reducing reliance on imports and improving marker availability.
  • Ministry of Health incentives supporting PET marker production by 2026
  • Over 150 diagnostic facilities to be upgraded with advanced imaging systems
  • Aging population trends increasing demand for early-stage dementia diagnostics

Leading Imaging Markers Manufacturers

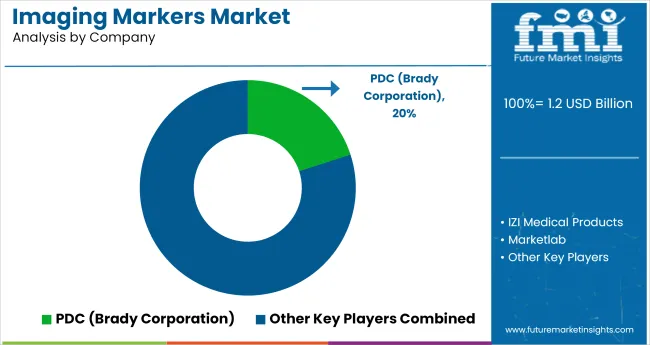
Imaging Markers Market Analysis By Company

The market is moderately fragmented, with a mix of specialized medical imaging firms and diversified healthcare suppliers. PDC, a Brady Corporation brand, holds a leading position with over 20% market share, driven by its extensive hospital partnerships and FDA-cleared radiology skin markers. IZI Medical Products follows closely, offering a wide range of MRI-, CT-, and X-ray-compatible markers with a focus on disposable and precision-guided biopsy applications.

Medline Industries and Market lab leverage broad distribution networks to offer customizable markers in bulk, targeting outpatient and diagnostic imaging centers. AliMed and Solstice Corporation emphasize ergonomic and color-coded marker designs that enhance technician workflow. Maven Imaging has carved a niche in portable imaging accessories for urgent care and point-of-care ultrasound environments. Demand is rising for single-use, latex-free, and antimicrobial markers compatible with AI-enabled imaging systems.

Recent Imaging Markers Industry News

In March 2024, Brady Corporation entered exclusive talks to acquire Gravotech Holding for €123 million. The move enhances Brady’s precision marking capabilities across its imaging identification systems. This strategic acquisition strengthens PDC’s portfolio within the medical imaging markers segment and expands its European manufacturing and technological footprint.

Report Coverage and Scope Summary

Report Attributes Details
Market Size (2025) USD 1.2 billion
Projected Market Size (2035) USD 2.3 billion
CAGR (2025 to 2035) 6.8%
Base Year for Estimation 2024
Historical Period 2020 to 2024
Projections Period 2025 to 2035
Quantitative Units USD billion for market value
Markers Analyzed (Segment 1) MRI Markers, CT Markers, PET and SPECT Markers, Ultrasound Markers, Optical Imaging Markers, Others
Therapeutic Areas Analyzed (Segment 2) Oncology, Neurology, Cardiology, Infectious Disease/Inflammation, Hepatic Imaging, Orthopedics
Applications Analyzed (Segment 3) Diagnosis, Treatment Planning & Monitoring, Drug Development & Research, Personalized Medicine
End Users Analyzed (Segment 4) Hospitals, Diagnostic Imaging Centers, Research Institutes, Pharmaceutical Companies, CROs
Regions Covered North America, Latin America, Eastern Europe, Western Europe, East Asia, South Asia & Pacific, Central Asia, Balkan & Baltic Countries, Russia & Belarus, Middle East & Africa
Key Players PDC (Brady Corporation), IZI Medical Products, Marketlab, Medline Industries, AliMed, Maven Imaging, Solstice Corporation
Additional Attributes Dollar sales by marker type and therapeutic focus, rising use in precision diagnostics, growing clinical research adoption, and integration of imaging markers in multimodal imaging workflows.

Leading Players in Imaging Markers Market

  • PDC (Brady Corporation)
  • IZI Medical Products
  • Marketlab
  • Medline Industries
  • AliMed
  • Maven Imaging
  • Solstice Corporation

Imaging Markers Market Analyzed by Key Investment Segments

By Markers:

The market is segmented into MRI markers, CT markers, PET and SPECT markers, ultrasound markers, optical imaging markers, and others, each enhancing imaging precision across modalities.

By Therapeutic Area:

Key therapeutic areas include oncology, neurology, cardiology, infectious disease/inflammation, hepatic imaging, and orthopedic applications, reflecting broad clinical relevance.

By Application:

Applications span diagnosis, treatment planning and monitoring, drug development and research, and personalized medicine, supporting both clinical and translational use.

By End User:

End users include hospitals, diagnostic imaging centers, research institutes, pharmaceutical companies, and CROs, covering the full diagnostic and development ecosystem.

By Region:

Geographic analysis covers North America, Latin America, Eastern Europe, Western Europe, East Asia, South Asia & Pacific, Central Asia, Balkan and Baltic Countries, Russia & Belarus, and the Middle East & Africa.

Table of Content

  1. Executive Summary
    • Global Market Outlook
    • Demand-side Trends
    • Supply-side Trends
    • Technology Roadmap Analysis
    • Analysis and Recommendations
  2. Market Overview
    • Market Coverage / Taxonomy
    • Market Definition / Scope / Limitations
  3. Market Background
    • Market Dynamics
      • Drivers
      • Restraints
      • Opportunity
      • Trends
    • Scenario Forecast
      • Demand in Optimistic Scenario
      • Demand in Likely Scenario
      • Demand in Conservative Scenario
    • Opportunity Map Analysis
    • Product Life Cycle Analysis
    • Supply Chain Analysis
      • Supply Side Participants and their Roles
        • Producers
        • Mid-Level Participants (Traders/ Agents/ Brokers)
        • Wholesalers and Distributors
      • Value Added and Value Created at Node in the Supply Chain
      • List of Raw Material Suppliers
      • List of Existing and Potential Buyer’s
    • Investment Feasibility Matrix
    • Value Chain Analysis
      • Profit Margin Analysis
      • Wholesalers and Distributors
      • Retailers
    • PESTLE and Porter’s Analysis
    • Regulatory Landscape
      • By Key Regions
      • By Key Countries
    • Regional Parent Market Outlook
    • Production and Consumption Statistics
    • Import and Export Statistics
  4. Global Market Analysis 2020 to 2024 and Forecast, 2025 to 2035
    • Historical Market Size Value (USD Billion) & Volume (Units) Analysis, 2020 to 2024
    • Current and Future Market Size Value (USD Billion) & Volume (Units) Projections, 2025 to 2035
      • Y-o-Y Growth Trend Analysis
      • Absolute $ Opportunity Analysis
  5. Global Market Pricing Analysis 2020 to 2024 and Forecast 2025 to 2035
  6. Global Market Analysis 2020 to 2024 and Forecast 2025 to 2035, By Markers
    • Introduction / Key Findings
    • Historical Market Size Value (USD Billion) & Volume (Units) Analysis By Markers, 2020 to 2024
    • Current and Future Market Size Value (USD Billion) & Volume (Units) Analysis and Forecast By Markers, 2025 to 2035
      • Magnetic Resonance Imaging (MRI) Markers
      • Computed Tomography (CT) Markers
      • PET and SPECT Markers
      • Ultrasound Markers
      • Optical Imaging Markers
      • Others
    • Y-o-Y Growth Trend Analysis By Markers, 2020 to 2024
    • Absolute $ Opportunity Analysis By Markers, 2025 to 2035
  7. Global Market Analysis 2020 to 2024 and Forecast 2025 to 2035, By Therapeutic Area
    • Introduction / Key Findings
    • Historical Market Size Value (USD Billion) & Volume (Units) Analysis By Therapeutic Area, 2020 to 2024
    • Current and Future Market Size Value (USD Billion) & Volume (Units) Analysis and Forecast By Therapeutic Area, 2025 to 2035
      • Oncology
      • Neurology
      • Cardiology
      • Infectious Disease / Inflammation
      • Hepatic Imaging
      • Orthopedic
    • Y-o-Y Growth Trend Analysis By Therapeutic Area, 2020 to 2024
    • Absolute $ Opportunity Analysis By Therapeutic Area, 2025 to 2035
  8. Global Market Analysis 2020 to 2024 and Forecast 2025 to 2035, By Application
    • Introduction / Key Findings
    • Historical Market Size Value (USD Billion) & Volume (Units) Analysis By Application, 2020 to 2024
    • Current and Future Market Size Value (USD Billion) & Volume (Units) Analysis and Forecast By Application, 2025 to 2035
      • Diagnosis
      • Treatment Planning and Monitoring
      • Drug Development / Research
      • Personalized Medicine
    • Y-o-Y Growth Trend Analysis By Application, 2020 to 2024
    • Absolute $ Opportunity Analysis By Application, 2025 to 2035
  9. Global Market Analysis 2020 to 2024 and Forecast 2025 to 2035, By End User
    • Introduction / Key Findings
    • Historical Market Size Value (USD Billion) & Volume (Units) Analysis By End User, 2020 to 2024
    • Current and Future Market Size Value (USD Billion) & Volume (Units) Analysis and Forecast By End User, 2025 to 2035
      • Hospitals
      • Diagnostic Imaging Centers
      • Research Institutes
      • Pharmaceutical Companies
      • Contract Research Organizations (CROs)
    • Y-o-Y Growth Trend Analysis By End User, 2020 to 2024
    • Absolute $ Opportunity Analysis By End User, 2025 to 2035
  10. Global Market Analysis 2020 to 2024 and Forecast 2025 to 2035, By Region
    • Introduction
    • Historical Market Size Value (USD Billion) & Volume (Units) Analysis By Region, 2020 to 2024
    • Current Market Size Value (USD Billion) & Volume (Units) Analysis and Forecast By Region, 2025 to 2035
      • North America
      • Latin America
      • Western Europe
      • Eastern Europe
      • East Asia
      • South Asia & Pacific
      • Middle East and Africa
    • Market Attractiveness Analysis By Region
  11. North America Market Analysis 2020 to 2024 and Forecast 2025 to 2035, By Country
    • Historical Market Size Value (USD Billion) & Volume (Units) Trend Analysis By Market Taxonomy, 2020 to 2024
    • Market Size Value (USD Billion) & Volume (Units) Forecast By Market Taxonomy, 2025 to 2035
      • By Country
        • USA
        • Canada
        • Mexico
      • By Markers
      • By Therapeutic Area
      • By Application
      • By End User
    • Market Attractiveness Analysis
      • By Country
      • By Markers
      • By Therapeutic Area
      • By Application
      • By End User
    • Key Takeaways
  12. Latin America Market Analysis 2020 to 2024 and Forecast 2025 to 2035, By Country
    • Historical Market Size Value (USD Billion) & Volume (Units) Trend Analysis By Market Taxonomy, 2020 to 2024
    • Market Size Value (USD Billion) & Volume (Units) Forecast By Market Taxonomy, 2025 to 2035
      • By Country
        • Brazil
        • Argentina
        • Rest of LATAM
      • By Markers
      • By Therapeutic Area
      • By Application
      • By End User
    • Market Attractiveness Analysis
      • By Country
      • By Markers
      • By Therapeutic Area
      • By Application
      • By End User
    • Key Takeaways
  13. Western Europe Market Analysis 2020 to 2024 and Forecast 2025 to 2035, By Country
    • Historical Market Size Value (USD Billion) & Volume (Units) Trend Analysis By Market Taxonomy, 2020 to 2024
    • Market Size Value (USD Billion) & Volume (Units) Forecast By Market Taxonomy, 2025 to 2035
      • By Country
        • Germany
        • Italy
        • France
        • UK
        • Spain
        • BENELUX
        • Nordic
        • Rest of W.Europe
      • By Markers
      • By Therapeutic Area
      • By Application
      • By End User
    • Market Attractiveness Analysis
      • By Country
      • By Markers
      • By Therapeutic Area
      • By Application
      • By End User
    • Key Takeaways
  14. Eastern Europe Market Analysis 2020 to 2024 and Forecast 2025 to 2035, By Country
    • Historical Market Size Value (USD Billion) & Volume (Units) Trend Analysis By Market Taxonomy, 2020 to 2024
    • Market Size Value (USD Billion) & Volume (Units) Forecast By Market Taxonomy, 2025 to 2035
      • By Country
        • Russia
        • Hungary
        • Poland
        • Balkan & Baltics
        • Rest of E. Europe
      • By Markers
      • By Therapeutic Area
      • By Application
      • By End User
    • Market Attractiveness Analysis
      • By Country
      • By Markers
      • By Therapeutic Area
      • By Application
      • By End User
    • Key Takeaways
  15. East Asia Market Analysis 2020 to 2024 and Forecast 2025 to 2035, By Country
    • Historical Market Size Value (USD Billion) & Volume (Units) Trend Analysis By Market Taxonomy, 2020 to 2024
    • Market Size Value (USD Billion) & Volume (Units) Forecast By Market Taxonomy, 2025 to 2035
      • By Country
        • China
        • Japan
        • South Korea
      • By Markers
      • By Therapeutic Area
      • By Application
      • By End User
    • Market Attractiveness Analysis
      • By Country
      • By Markers
      • By Therapeutic Area
      • By Application
      • By End User
    • Key Takeaways
  16. South Asia & Pacific Market Analysis 2020 to 2024 and Forecast 2025 to 2035, By Country
    • Historical Market Size Value (USD Billion) & Volume (Units) Trend Analysis By Market Taxonomy, 2020 to 2024
    • Market Size Value (USD Billion) & Volume (Units) Forecast By Market Taxonomy, 2025 to 2035
      • By Country
        • India
        • Australia & New Zealand
        • ASEAN
        • Rest of SAP
      • By Markers
      • By Therapeutic Area
      • By Application
      • By End User
    • Market Attractiveness Analysis
      • By Country
      • By Markers
      • By Therapeutic Area
      • By Application
      • By End User
    • Key Takeaways
  17. Middle East and Africa Market Analysis 2020 to 2024 and Forecast 2025 to 2035, By Country
    • Historical Market Size Value (USD Billion) & Volume (Units) Trend Analysis By Market Taxonomy, 2020 to 2024
    • Market Size Value (USD Billion) & Volume (Units) Forecast By Market Taxonomy, 2025 to 2035
      • By Country
        • GCC Countries
        • Northern Africa
        • South Africa
        • Turkiye
        • Rest of MEA
      • By Markers
      • By Therapeutic Area
      • By Application
      • By End User
    • Market Attractiveness Analysis
      • By Country
      • By Markers
      • By Therapeutic Area
      • By Application
      • By End User
    • Key Takeaways
  18. Key Countries Market Analysis
    • USA
      • Pricing Analysis
      • Market Share Analysis, 2024
        • By Markers
        • By Therapeutic Area
        • By Application
        • By End User
    • Canada
      • Pricing Analysis
      • Market Share Analysis, 2024
        • By Markers
        • By Therapeutic Area
        • By Application
        • By End User
    • Brazil
      • Pricing Analysis
      • Market Share Analysis, 2024
        • By Markers
        • By Therapeutic Area
        • By Application
        • By End User
    • Mexico
      • Pricing Analysis
      • Market Share Analysis, 2024
        • By Markers
        • By Therapeutic Area
        • By Application
        • By End User
    • Argentina
      • Pricing Analysis
      • Market Share Analysis, 2024
        • By Markers
        • By Therapeutic Area
        • By Application
        • By End User
  19. Market Structure Analysis
    • Competition Dashboard
    • Competition Benchmarking
    • Market Share Analysis of Top Players
      • By Regional
      • By Markers
      • By Therapeutic Area
      • By Application
      • By End User
  20. Competition Analysis
    • Competition Deep Dive
      • PDC (Brady Corporation)
        • Overview
        • Product Portfolio
        • Profitability by Market Segments (Product/Age /Sales Channel/Region)
        • Sales Footprint
        • Strategy Overview
          • Marketing Strategy
          • Product Strategy
          • Channel Strategy
      • IZI Medical Products
        • Overview
        • Product Portfolio
        • Profitability by Market Segments (Product/Age /Sales Channel/Region)
        • Sales Footprint
        • Strategy Overview
          • Marketing Strategy
          • Product Strategy
          • Channel Strategy
      • Marketlab
        • Overview
        • Product Portfolio
        • Profitability by Market Segments (Product/Age /Sales Channel/Region)
        • Sales Footprint
        • Strategy Overview
          • Marketing Strategy
          • Product Strategy
          • Channel Strategy
      • Medline Industries
        • Overview
        • Product Portfolio
        • Profitability by Market Segments (Product/Age /Sales Channel/Region)
        • Sales Footprint
        • Strategy Overview
          • Marketing Strategy
          • Product Strategy
          • Channel Strategy
      • AliMed
        • Overview
        • Product Portfolio
        • Profitability by Market Segments (Product/Age /Sales Channel/Region)
        • Sales Footprint
        • Strategy Overview
          • Marketing Strategy
          • Product Strategy
          • Channel Strategy
      • Maven Imaging
        • Overview
        • Product Portfolio
        • Profitability by Market Segments (Product/Age /Sales Channel/Region)
        • Sales Footprint
        • Strategy Overview
          • Marketing Strategy
          • Product Strategy
          • Channel Strategy
      • Solstice Corporation
        • Overview
        • Product Portfolio
        • Profitability by Market Segments (Product/Age /Sales Channel/Region)
        • Sales Footprint
        • Strategy Overview
          • Marketing Strategy
          • Product Strategy
          • Channel Strategy
  21. Assumptions & Acronyms Used
  22. Research Methodology

List of Tables

  • Table 1: Global Market Value (USD Billion) Forecast by Region, 2020 to 2035
  • Table 2: Global Market Volume (Units) Forecast by Region, 2020 to 2035
  • Table 3: Global Market Value (USD Billion) Forecast by By Markers, 2020 to 2035
  • Table 4: Global Market Volume (Units) Forecast by By Markers, 2020 to 2035
  • Table 5: Global Market Value (USD Billion) Forecast by By Therapeutic Area, 2020 to 2035
  • Table 6: Global Market Volume (Units) Forecast by By Therapeutic Area, 2020 to 2035
  • Table 7: Global Market Value (USD Billion) Forecast by By Application, 2020 to 2035
  • Table 8: Global Market Volume (Units) Forecast by By Application, 2020 to 2035
  • Table 9: Global Market Value (USD Billion) Forecast by By End User, 2020 to 2035
  • Table 10: Global Market Volume (Units) Forecast by By End User, 2020 to 2035
  • Table 11: North America Market Value (USD Billion) Forecast by Country, 2020 to 2035
  • Table 12: North America Market Volume (Units) Forecast by Country, 2020 to 2035
  • Table 13: North America Market Value (USD Billion) Forecast by By Markers, 2020 to 2035
  • Table 14: North America Market Volume (Units) Forecast by By Markers, 2020 to 2035
  • Table 15: North America Market Value (USD Billion) Forecast by By Therapeutic Area, 2020 to 2035
  • Table 16: North America Market Volume (Units) Forecast by By Therapeutic Area, 2020 to 2035
  • Table 17: North America Market Value (USD Billion) Forecast by By Application, 2020 to 2035
  • Table 18: North America Market Volume (Units) Forecast by By Application, 2020 to 2035
  • Table 19: North America Market Value (USD Billion) Forecast by By End User, 2020 to 2035
  • Table 20: North America Market Volume (Units) Forecast by By End User, 2020 to 2035
  • Table 21: Latin America Market Value (USD Billion) Forecast by Country, 2020 to 2035
  • Table 22: Latin America Market Volume (Units) Forecast by Country, 2020 to 2035
  • Table 23: Latin America Market Value (USD Billion) Forecast by By Markers, 2020 to 2035
  • Table 24: Latin America Market Volume (Units) Forecast by By Markers, 2020 to 2035
  • Table 25: Latin America Market Value (USD Billion) Forecast by By Therapeutic Area, 2020 to 2035
  • Table 26: Latin America Market Volume (Units) Forecast by By Therapeutic Area, 2020 to 2035
  • Table 27: Latin America Market Value (USD Billion) Forecast by By Application, 2020 to 2035
  • Table 28: Latin America Market Volume (Units) Forecast by By Application, 2020 to 2035
  • Table 29: Latin America Market Value (USD Billion) Forecast by By End User, 2020 to 2035
  • Table 30: Latin America Market Volume (Units) Forecast by By End User, 2020 to 2035
  • Table 31: Western Europe Market Value (USD Billion) Forecast by Country, 2020 to 2035
  • Table 32: Western Europe Market Volume (Units) Forecast by Country, 2020 to 2035
  • Table 33: Western Europe Market Value (USD Billion) Forecast by By Markers, 2020 to 2035
  • Table 34: Western Europe Market Volume (Units) Forecast by By Markers, 2020 to 2035
  • Table 35: Western Europe Market Value (USD Billion) Forecast by By Therapeutic Area, 2020 to 2035
  • Table 36: Western Europe Market Volume (Units) Forecast by By Therapeutic Area, 2020 to 2035
  • Table 37: Western Europe Market Value (USD Billion) Forecast by By Application, 2020 to 2035
  • Table 38: Western Europe Market Volume (Units) Forecast by By Application, 2020 to 2035
  • Table 39: Western Europe Market Value (USD Billion) Forecast by By End User, 2020 to 2035
  • Table 40: Western Europe Market Volume (Units) Forecast by By End User, 2020 to 2035
  • Table 41: Eastern Europe Market Value (USD Billion) Forecast by Country, 2020 to 2035
  • Table 42: Eastern Europe Market Volume (Units) Forecast by Country, 2020 to 2035
  • Table 43: Eastern Europe Market Value (USD Billion) Forecast by By Markers, 2020 to 2035
  • Table 44: Eastern Europe Market Volume (Units) Forecast by By Markers, 2020 to 2035
  • Table 45: Eastern Europe Market Value (USD Billion) Forecast by By Therapeutic Area, 2020 to 2035
  • Table 46: Eastern Europe Market Volume (Units) Forecast by By Therapeutic Area, 2020 to 2035
  • Table 47: Eastern Europe Market Value (USD Billion) Forecast by By Application, 2020 to 2035
  • Table 48: Eastern Europe Market Volume (Units) Forecast by By Application, 2020 to 2035
  • Table 49: Eastern Europe Market Value (USD Billion) Forecast by By End User, 2020 to 2035
  • Table 50: Eastern Europe Market Volume (Units) Forecast by By End User, 2020 to 2035
  • Table 51: East Asia Market Value (USD Billion) Forecast by Country, 2020 to 2035
  • Table 52: East Asia Market Volume (Units) Forecast by Country, 2020 to 2035
  • Table 53: East Asia Market Value (USD Billion) Forecast by By Markers, 2020 to 2035
  • Table 54: East Asia Market Volume (Units) Forecast by By Markers, 2020 to 2035
  • Table 55: East Asia Market Value (USD Billion) Forecast by By Therapeutic Area, 2020 to 2035
  • Table 56: East Asia Market Volume (Units) Forecast by By Therapeutic Area, 2020 to 2035
  • Table 57: East Asia Market Value (USD Billion) Forecast by By Application, 2020 to 2035
  • Table 58: East Asia Market Volume (Units) Forecast by By Application, 2020 to 2035
  • Table 59: East Asia Market Value (USD Billion) Forecast by By End User, 2020 to 2035
  • Table 60: East Asia Market Volume (Units) Forecast by By End User, 2020 to 2035
  • Table 61: South Asia & Pacific Market Value (USD Billion) Forecast by Country, 2020 to 2035
  • Table 62: South Asia & Pacific Market Volume (Units) Forecast by Country, 2020 to 2035
  • Table 63: South Asia & Pacific Market Value (USD Billion) Forecast by By Markers, 2020 to 2035
  • Table 64: South Asia & Pacific Market Volume (Units) Forecast by By Markers, 2020 to 2035
  • Table 65: South Asia & Pacific Market Value (USD Billion) Forecast by By Therapeutic Area, 2020 to 2035
  • Table 66: South Asia & Pacific Market Volume (Units) Forecast by By Therapeutic Area, 2020 to 2035
  • Table 67: South Asia & Pacific Market Value (USD Billion) Forecast by By Application, 2020 to 2035
  • Table 68: South Asia & Pacific Market Volume (Units) Forecast by By Application, 2020 to 2035
  • Table 69: South Asia & Pacific Market Value (USD Billion) Forecast by By End User, 2020 to 2035
  • Table 70: South Asia & Pacific Market Volume (Units) Forecast by By End User, 2020 to 2035
  • Table 71: Middle East and Africa Market Value (USD Billion) Forecast by Country, 2020 to 2035
  • Table 72: Middle East and Africa Market Volume (Units) Forecast by Country, 2020 to 2035
  • Table 73: Middle East and Africa Market Value (USD Billion) Forecast by By Markers, 2020 to 2035
  • Table 74: Middle East and Africa Market Volume (Units) Forecast by By Markers, 2020 to 2035
  • Table 75: Middle East and Africa Market Value (USD Billion) Forecast by By Therapeutic Area, 2020 to 2035
  • Table 76: Middle East and Africa Market Volume (Units) Forecast by By Therapeutic Area, 2020 to 2035
  • Table 77: Middle East and Africa Market Value (USD Billion) Forecast by By Application, 2020 to 2035
  • Table 78: Middle East and Africa Market Volume (Units) Forecast by By Application, 2020 to 2035
  • Table 79: Middle East and Africa Market Value (USD Billion) Forecast by By End User, 2020 to 2035
  • Table 80: Middle East and Africa Market Volume (Units) Forecast by By End User, 2020 to 2035

List of Figures

  • Figure 1: Global Market Volume (Units) Forecast 2020 to 2035
  • Figure 2: Global Market Pricing Analysis
  • Figure 3: Global Market Value (USD Billion) Forecast 2020 to 2035
  • Figure 4: Global Market Value Share and BPS Analysis by By Markers, 2025 and 2035
  • Figure 5: Global Market Y-o-Y Growth Comparison by By Markers, 2025 to 2035
  • Figure 6: Global Market Attractiveness Analysis by By Markers
  • Figure 7: Global Market Value Share and BPS Analysis by By Therapeutic Area, 2025 and 2035
  • Figure 8: Global Market Y-o-Y Growth Comparison by By Therapeutic Area, 2025 to 2035
  • Figure 9: Global Market Attractiveness Analysis by By Therapeutic Area
  • Figure 10: Global Market Value Share and BPS Analysis by By Application, 2025 and 2035
  • Figure 11: Global Market Y-o-Y Growth Comparison by By Application, 2025 to 2035
  • Figure 12: Global Market Attractiveness Analysis by By Application
  • Figure 13: Global Market Value Share and BPS Analysis by By End User, 2025 and 2035
  • Figure 14: Global Market Y-o-Y Growth Comparison by By End User, 2025 to 2035
  • Figure 15: Global Market Attractiveness Analysis by By End User
  • Figure 16: Global Market Value (Imaging Markers) Share and BPS Analysis by Region, 2025 and 2035
  • Figure 17: Global Market Y-o-Y Growth Comparison by Region, 2025 to 2035
  • Figure 18: Global Market Attractiveness Analysis by Region
  • Figure 19: North America Market Incremental $ Opportunity, 2025 to 2035
  • Figure 20: Latin America Market Incremental $ Opportunity, 2025 to 2035
  • Figure 21: Western Europe Market Incremental $ Opportunity, 2025 to 2035
  • Figure 22: Eastern Europe Market Incremental $ Opportunity, 2025 to 2035
  • Figure 23: East Asia Market Incremental $ Opportunity, 2025 to 2035
  • Figure 24: South Asia & Pacific Market Incremental $ Opportunity, 2025 to 2035
  • Figure 25: Middle East and Africa Market Incremental $ Opportunity, 2025 to 2035
  • Figure 26: North America Market Value Share and BPS Analysis by Country, 2025 and 2035
  • Figure 27: North America Market Value Share and BPS Analysis by By Markers, 2025 and 2035
  • Figure 28: North America Market Y-o-Y Growth Comparison by By Markers, 2025 to 2035
  • Figure 29: North America Market Attractiveness Analysis by By Markers
  • Figure 30: North America Market Value Share and BPS Analysis by By Therapeutic Area, 2025 and 2035
  • Figure 31: North America Market Y-o-Y Growth Comparison by By Therapeutic Area, 2025 to 2035
  • Figure 32: North America Market Attractiveness Analysis by By Therapeutic Area
  • Figure 33: North America Market Value Share and BPS Analysis by By Application, 2025 and 2035
  • Figure 34: North America Market Y-o-Y Growth Comparison by By Application, 2025 to 2035
  • Figure 35: North America Market Attractiveness Analysis by By Application
  • Figure 36: North America Market Value Share and BPS Analysis by By End User, 2025 and 2035
  • Figure 37: North America Market Y-o-Y Growth Comparison by By End User, 2025 to 2035
  • Figure 38: North America Market Attractiveness Analysis by By End User
  • Figure 39: Latin America Market Value Share and BPS Analysis by Country, 2025 and 2035
  • Figure 40: Latin America Market Value Share and BPS Analysis by By Markers, 2025 and 2035
  • Figure 41: Latin America Market Y-o-Y Growth Comparison by By Markers, 2025 to 2035
  • Figure 42: Latin America Market Attractiveness Analysis by By Markers
  • Figure 43: Latin America Market Value Share and BPS Analysis by By Therapeutic Area, 2025 and 2035
  • Figure 44: Latin America Market Y-o-Y Growth Comparison by By Therapeutic Area, 2025 to 2035
  • Figure 45: Latin America Market Attractiveness Analysis by By Therapeutic Area
  • Figure 46: Latin America Market Value Share and BPS Analysis by By Application, 2025 and 2035
  • Figure 47: Latin America Market Y-o-Y Growth Comparison by By Application, 2025 to 2035
  • Figure 48: Latin America Market Attractiveness Analysis by By Application
  • Figure 49: Latin America Market Value Share and BPS Analysis by By End User, 2025 and 2035
  • Figure 50: Latin America Market Y-o-Y Growth Comparison by By End User, 2025 to 2035
  • Figure 51: Latin America Market Attractiveness Analysis by By End User
  • Figure 52: Western Europe Market Value Share and BPS Analysis by Country, 2025 and 2035
  • Figure 53: Western Europe Market Value Share and BPS Analysis by By Markers, 2025 and 2035
  • Figure 54: Western Europe Market Y-o-Y Growth Comparison by By Markers, 2025 to 2035
  • Figure 55: Western Europe Market Attractiveness Analysis by By Markers
  • Figure 56: Western Europe Market Value Share and BPS Analysis by By Therapeutic Area, 2025 and 2035
  • Figure 57: Western Europe Market Y-o-Y Growth Comparison by By Therapeutic Area, 2025 to 2035
  • Figure 58: Western Europe Market Attractiveness Analysis by By Therapeutic Area
  • Figure 59: Western Europe Market Value Share and BPS Analysis by By Application, 2025 and 2035
  • Figure 60: Western Europe Market Y-o-Y Growth Comparison by By Application, 2025 to 2035
  • Figure 61: Western Europe Market Attractiveness Analysis by By Application
  • Figure 62: Western Europe Market Value Share and BPS Analysis by By End User, 2025 and 2035
  • Figure 63: Western Europe Market Y-o-Y Growth Comparison by By End User, 2025 to 2035
  • Figure 64: Western Europe Market Attractiveness Analysis by By End User
  • Figure 65: Eastern Europe Market Value Share and BPS Analysis by Country, 2025 and 2035
  • Figure 66: Eastern Europe Market Value Share and BPS Analysis by By Markers, 2025 and 2035
  • Figure 67: Eastern Europe Market Y-o-Y Growth Comparison by By Markers, 2025 to 2035
  • Figure 68: Eastern Europe Market Attractiveness Analysis by By Markers
  • Figure 69: Eastern Europe Market Value Share and BPS Analysis by By Therapeutic Area, 2025 and 2035
  • Figure 70: Eastern Europe Market Y-o-Y Growth Comparison by By Therapeutic Area, 2025 to 2035
  • Figure 71: Eastern Europe Market Attractiveness Analysis by By Therapeutic Area
  • Figure 72: Eastern Europe Market Value Share and BPS Analysis by By Application, 2025 and 2035
  • Figure 73: Eastern Europe Market Y-o-Y Growth Comparison by By Application, 2025 to 2035
  • Figure 74: Eastern Europe Market Attractiveness Analysis by By Application
  • Figure 75: Eastern Europe Market Value Share and BPS Analysis by By End User, 2025 and 2035
  • Figure 76: Eastern Europe Market Y-o-Y Growth Comparison by By End User, 2025 to 2035
  • Figure 77: Eastern Europe Market Attractiveness Analysis by By End User
  • Figure 78: East Asia Market Value Share and BPS Analysis by Country, 2025 and 2035
  • Figure 79: East Asia Market Value Share and BPS Analysis by By Markers, 2025 and 2035
  • Figure 80: East Asia Market Y-o-Y Growth Comparison by By Markers, 2025 to 2035
  • Figure 81: East Asia Market Attractiveness Analysis by By Markers
  • Figure 82: East Asia Market Value Share and BPS Analysis by By Therapeutic Area, 2025 and 2035
  • Figure 83: East Asia Market Y-o-Y Growth Comparison by By Therapeutic Area, 2025 to 2035
  • Figure 84: East Asia Market Attractiveness Analysis by By Therapeutic Area
  • Figure 85: East Asia Market Value Share and BPS Analysis by By Application, 2025 and 2035
  • Figure 86: East Asia Market Y-o-Y Growth Comparison by By Application, 2025 to 2035
  • Figure 87: East Asia Market Attractiveness Analysis by By Application
  • Figure 88: East Asia Market Value Share and BPS Analysis by By End User, 2025 and 2035
  • Figure 89: East Asia Market Y-o-Y Growth Comparison by By End User, 2025 to 2035
  • Figure 90: East Asia Market Attractiveness Analysis by By End User
  • Figure 91: South Asia & Pacific Market Value Share and BPS Analysis by Country, 2025 and 2035
  • Figure 92: South Asia & Pacific Market Value Share and BPS Analysis by By Markers, 2025 and 2035
  • Figure 93: South Asia & Pacific Market Y-o-Y Growth Comparison by By Markers, 2025 to 2035
  • Figure 94: South Asia & Pacific Market Attractiveness Analysis by By Markers
  • Figure 95: South Asia & Pacific Market Value Share and BPS Analysis by By Therapeutic Area, 2025 and 2035
  • Figure 96: South Asia & Pacific Market Y-o-Y Growth Comparison by By Therapeutic Area, 2025 to 2035
  • Figure 97: South Asia & Pacific Market Attractiveness Analysis by By Therapeutic Area
  • Figure 98: South Asia & Pacific Market Value Share and BPS Analysis by By Application, 2025 and 2035
  • Figure 99: South Asia & Pacific Market Y-o-Y Growth Comparison by By Application, 2025 to 2035
  • Figure 100: South Asia & Pacific Market Attractiveness Analysis by By Application
  • Figure 101: South Asia & Pacific Market Value Share and BPS Analysis by By End User, 2025 and 2035
  • Figure 102: South Asia & Pacific Market Y-o-Y Growth Comparison by By End User, 2025 to 2035
  • Figure 103: South Asia & Pacific Market Attractiveness Analysis by By End User
  • Figure 104: Middle East and Africa Market Value Share and BPS Analysis by Country, 2025 and 2035
  • Figure 105: Middle East and Africa Market Value Share and BPS Analysis by By Markers, 2025 and 2035
  • Figure 106: Middle East and Africa Market Y-o-Y Growth Comparison by By Markers, 2025 to 2035
  • Figure 107: Middle East and Africa Market Attractiveness Analysis by By Markers
  • Figure 108: Middle East and Africa Market Value Share and BPS Analysis by By Therapeutic Area, 2025 and 2035
  • Figure 109: Middle East and Africa Market Y-o-Y Growth Comparison by By Therapeutic Area, 2025 to 2035
  • Figure 110: Middle East and Africa Market Attractiveness Analysis by By Therapeutic Area
  • Figure 111: Middle East and Africa Market Value Share and BPS Analysis by By Application, 2025 and 2035
  • Figure 112: Middle East and Africa Market Y-o-Y Growth Comparison by By Application, 2025 to 2035
  • Figure 113: Middle East and Africa Market Attractiveness Analysis by By Application
  • Figure 114: Middle East and Africa Market Value Share and BPS Analysis by By End User, 2025 and 2035
  • Figure 115: Middle East and Africa Market Y-o-Y Growth Comparison by By End User, 2025 to 2035
  • Figure 116: Middle East and Africa Market Attractiveness Analysis by By End User
  • Figure 117: Global Market - Tier Structure Analysis
  • Figure 118: Global Market - Company Share Analysis

Frequently Asked Questions

What is the market size of the imaging markers market in 2025?

The market is expected to reach USD 1.2 billion in 2025.

What is the projected market size of the imaging markers market by 2035?

The market is forecasted to reach USD 2.3 billion by 2035.

What is the CAGR of the imaging markers market from 2025 to 2035?

The market is anticipated to grow at a CAGR of 6.8% during the forecast period.

Which segment holds the largest share in the imaging markers market by marker type?

MRI markers lead the market with a 32.0% share in 2025.

Which country is the fastest-growing in the imaging markers market?

China is projected to grow at the fastest rate, with a CAGR of 8.9% from 2025 to 2035.

Explore Similar Insights

Future Market Insights

Imaging Markers Market