In Vivo Imaging Systems Market Size and Share Forecast Outlook 2025 to 2035

The In Vivo Imaging Systems Market is estimated to be valued at USD 58.6 million in 2025 and is projected to reach USD 80.3 million by 2035, registering a compound annual growth rate (CAGR) of 3.2% over the forecast period.
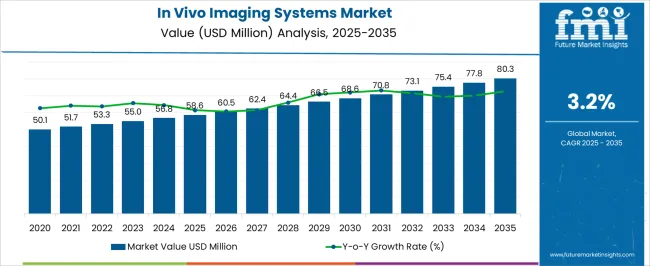
Quick Stats for In Vivo Imaging Systems Market

  • In Vivo Imaging Systems Market Industry Value (2025): USD 58.6 million
  • In Vivo Imaging Systems Market Forecast Value (2035): USD 80.3 million
  • In Vivo Imaging Systems Market Forecast CAGR: 3.2%
  • Leading Segment in In Vivo Imaging Systems Market in 2025: Monitoring Drug Treatment Response (33.5%)
  • Key Growth Region in In Vivo Imaging Systems Market: North America, Asia-Pacific, Europe
  • Top Key Players in In Vivo Imaging Systems Market: Bruker Corporation, Life Technologies Corporation, Miltenyi Viotech GmbH, Biosacan, Inc., Gamma Meddica, Targeson, Inc., Sanco Medical, Aspect Imaging, Mediso Medical Imaging Systems, Perkin Elmer Inc., FUJIFILM Holdings Corporation, Siemens AG

In Vivo Imaging Systems Market   Market Value Analysis

Metric Value
In Vivo Imaging Systems Market Estimated Value in (2025 E) USD 58.6 million
In Vivo Imaging Systems Market Forecast Value in (2035 F) USD 80.3 million
Forecast CAGR (2025 to 2035) 3.2%

Rationale for Segmental Growth in the In Vivo Imaging Systems Market

Market Overview

The in vivo imaging systems market is experiencing steady advancement due to rising demand for real time visualization of biological processes and disease progression in living organisms. The increasing emphasis on personalized medicine and the need for precise drug evaluation are driving demand for advanced imaging modalities that deliver high resolution and non invasive analysis.

Technological improvements in image fusion, contrast agents, and functional imaging have expanded the application scope across oncology, neurology, and cardiovascular research. Greater investments in preclinical and translational research, coupled with supportive regulatory environments, are promoting widespread adoption of imaging systems in both clinical and academic settings.

The growing need for accurate biomarker tracking and therapeutic efficacy assessment is expected to sustain market growth, especially as healthcare systems move toward evidence based approaches in treatment planning and monitoring.

Segmental Analysis

The market is segmented by Application, Technology, and End-Use and region. By Application, the market is divided into Monitoring Drug Treatment Response, Bio Distribution Studies, Cancer Cell Detection, Biomarkers, Longitudinal Studies, and Epigenetics. In terms of Technology, the market is classified into Magnetic Resonance Imaging (MRI), Digital Angiography, Ultrasound, Nuclear Imaging, Positron Emission Tomography (PET), Single Photon Emission Computerized Tomography (SPECT), Optical Imaging (OI), Bioluminescence Imaging, Cerenkov Luminescence Imaging, Others, Ultrasound Imaging, and Computerized Tomography (CT). Based on End-Use, the market is segmented into Hospitals, Clinics, Pharmaceutical Research Institutes, Diagnostic Laboratories, Forensic Laboratories, and Educational Research Institutes. Regionally, the market is classified into North America, Latin America, Western Europe, Eastern Europe, Balkan & Baltic Countries, Russia & Belarus, Central Asia, East Asia, South Asia & Pacific, and the Middle East & Africa.
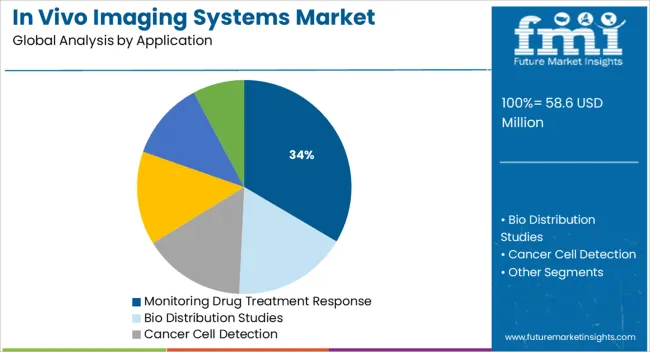
Insights into the Monitoring Drug Treatment Response Application Segment

In Vivo Imaging Systems Market   Analysis By Application

The monitoring drug treatment response segment is expected to contribute 33.50% of total market revenue by 2025 under the application category, making it the leading segment. This growth is attributed to the increasing need for dynamic evaluation of therapeutic interventions in real time.

In vivo imaging systems enable visualization of treatment impact at the cellular and molecular levels, which is critical for drug development, clinical trials, and personalized medicine approaches. Their ability to provide longitudinal data from the same subject reduces variability and improves study efficiency.

This application supports rapid decision making in therapy adjustment and is widely adopted across pharmaceutical companies and research institutions. As treatment efficacy monitoring becomes central to precision healthcare, this segment continues to lead due to its strategic role in improving patient outcomes and optimizing therapeutic strategies.
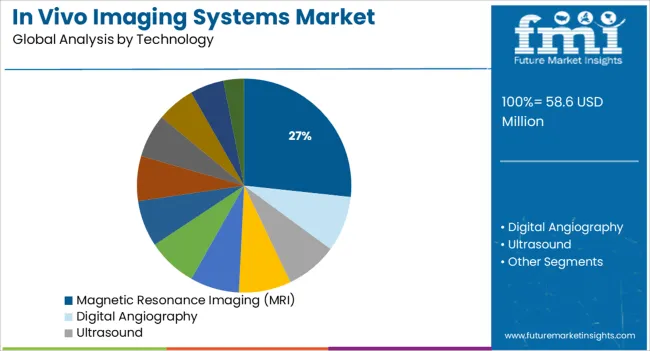
Insights into the Magnetic Resonance Imaging Technology Segment

In Vivo Imaging Systems Market   Analysis By Technology

The magnetic resonance imaging segment is projected to account for 26.70% of total revenue by 2025 within the technology category. This dominance is driven by its capability to deliver high contrast images without ionizing radiation, making it ideal for repeated imaging in both clinical and research settings.

MRI provides detailed anatomical and functional information which is essential for early diagnosis, tumor tracking, and brain imaging. It is especially valued for its superior soft tissue resolution and ability to assess physiological processes non invasively.

With ongoing advancements in imaging speed, hardware miniaturization, and contrast agent development, MRI continues to be widely utilized in preclinical and in vivo research. Its non invasive nature and accuracy reinforce its role as a leading technology within the market.
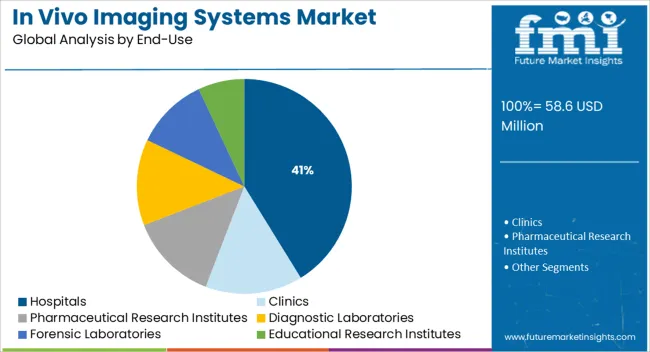
Insights into the Hospitals End Use Segment

In Vivo Imaging Systems Market   Analysis By End Use

The hospitals segment is expected to hold 41.20% of total market revenue by 2025 under the end use category, making it the most dominant segment. This is due to the increasing integration of in vivo imaging systems into clinical workflows for diagnosis, treatment planning, and follow up.

Hospitals benefit from the ability to provide comprehensive imaging services that enhance patient care and clinical decision making. The availability of advanced infrastructure, trained personnel, and cross functional teams further supports adoption in this setting.

In vivo imaging systems in hospitals are also instrumental in supporting clinical trials and real world evidence generation. As hospitals continue to expand their diagnostic capabilities and embrace personalized medicine, this segment remains at the forefront of market expansion.

In-Vivo Imaging Market Driver

The main factors influencing In Vivo Imaging System include increasing customer demand for the product, successful marketing strategies in new markets, and large financial investments in product development.

In-Vivo Imaging Market Challenges

One of the problems facing in vivo imaging systems on the market is their easy accessibility to competitors. The low price of alternatives is another hindrance in the industry. However, businesses plan to get over this problem by utilising cutting-edge technology and controlling prices, which will ultimately increase product demand.

Furthermore, researchers have identified significant obstacles for market participants that must be overcome for them to mitigate risks, modify their plans, and continue operations. Producers will be able to effectively manage their resources in this way without compromising the quality of their products or the timeliness of their market supply.

In-Vivo Imaging Market Opportunity

Businesses that make the right preparations can profit from them. The opportunities discussed in the report help the stakeholders and report buyers plan their investments effectively and get the best return on their money.

In-Vivo Imaging Market Trend

A few developments in the industry help organisations create more effective strategies. Current trends are covered in the study using the most recent data. Customers can learn about the new products on the market, and businesses can use this information to plan on developing significantly better solutions.

In vivo Imaging Systems Market: Drivers and Restraints

Technological advancement of imaging systems, rise in the rate of adoption of multi-modality imaging systems in clinical and preclinical research studies, growth in the acceptance of preclinical imaging for drug discovery and development process, growing awareness about the benefits of early disease diagnosis are some of the crucial parameters driving the current Imaging markets.

A number of factors such as high implementation cost of sophisticated clinical and preclinical imaging systems, High cost of maintenance, low life span of accessories used are restricting the growth of the global imaging market.

In vivo Imaging Systems Market: Overview

The in vivo market has some well establish technology, but on and off there are some of the technological advancement taking place in the market. In case of MRI the currently used technology for diagnostic purpose ranges from 1.5 T to 3 T, for human clinical studies 9.4 T and animal clinical studies 21. T.

The combination of PET-MRI at 9.4 T is operational since 2009, but presently only brain can be imaged such high magnetic field strengths.

In vivo Imaging Systems Market: Region-wise Outlook

North America market is a leader for In vivo imaging systems followed by the European market. Research Institutes and Pharmaceutical companies, growing usage for in vivo imaging system and technological advancements, rising awareness and applications of functional imaging that are factors driving market growth.

Asia-Pacific market is also growing at fastest pace due to growing number of research institutes, increasing number of funds given by government for research and rising industry-academia partnerships for small animal research and increasing medical tourism.

In vivo Imaging Systems Market: Key Players

The research report presents a comprehensive assessment of the market and contains thoughtful insights, facts, historical data, and statistically supported and industry-validated market data. It also contains projections using a suitable set of assumptions and methodologies.

The research report provides analysis and information according to categories such as market segments, geographies, types, technology and applications.

The key players in the in vivo imaging system market include Bruker Corporation, Life Technologies Corporation, Miltenyi Viotech GmbH, Biosacan, Inc., Gamma Meddica, Targeson, Inc., Sanco Medical, Aspect Imaging, Mediso Medical Imaging Systems, Perkin Elmer, Inc., FUJIFILM Holdings Corporation and Siemens AG.

The report covers exhaustive analysis on

  • Market Segments
  • Market Dynamics
  • Market Size
  • Supply & Demand
  • Current Trends/Issues/Challenges
  • Competition & Companies involved
  • Technology
  • Value Chain

Regional analysis includes

  • North America (USA, Canada)
  • Latin America (Mexico, Brazil, Rest of Latin America)
  • Western Europe (Germany, Italy, Spain, France, UK, Rest Of Western Europe)
  • Eastern Europe (Poland, Russia, Rest of Eastern Europe)
  • Asia Pacific (China, India, ASEAN, Australia & New Zealand)
  • Japan
  • Middle East and Africa (GCC countries, S. Africa, Rest of MEA)

The report is a compilation of first-hand information, qualitative and quantitative assessment by industry analysts, inputs from industry experts and industry participants across the value chain.

The report provides in-depth analysis of parent market trends, macro-economic indicators and governing factors along with market attractiveness as per segments. The report also maps the qualitative impact of various market factors on market segments and geographies.

In vivo Imaging Systems Market: Segmentation

Based on application:

  • Monitoring Drug Treatment Response
  • Bio Distribution Studies
  • Cancer Cell Detection
  • Biomarkers
  • Longitudinal Studies
  • Epigenetics

Based on technology:

  • Magnetic Resonance Imaging (MRI)
  • Digital Angiography
  • Ultrasound
  • Nuclear Imaging
  • Positron Emission Tomography (PET)
  • Single Photon Emission Computerized Tomography (SPECT)
  • Optical Imaging (OI)
  • Bioluminescence Imaging
  • Cerenkov Luminescence Imaging
  • Others
  • Ultrasound Imaging
  • Computerized Tomography (CT)

Based on end user:

  • Hospitals
  • Clinics
  • Pharmaceutical Research Institutes
  • Diagnostic Laboratories
  • Forensic Laboratories
  • Educational research institutes

Based on geography:

  • North America (USA, Canada)
  • Latin America (Mexico, Brazil)
  • Western Europe (Germany, Italy, UK, Spain, France, Rest of Western Europe)
  • Eastern Europe (Russia)
  • Asia Pacific (China, India, ASEAN, Australia & New Zealand)
  • Japan
  • Middle East and Africa (GCC, S. Africa)

Table of Content

  1. Executive Summary
    • Global Market Outlook
    • Demand-side Trends
    • Supply-side Trends
    • Technology Roadmap Analysis
    • Analysis and Recommendations
  2. Market Overview
    • Market Coverage / Taxonomy
    • Market Definition / Scope / Limitations
  3. Market Background
    • Market Dynamics
      • Drivers
      • Restraints
      • Opportunity
      • Trends
    • Scenario Forecast
      • Demand in Optimistic Scenario
      • Demand in Likely Scenario
      • Demand in Conservative Scenario
    • Opportunity Map Analysis
    • Product Life Cycle Analysis
    • Supply Chain Analysis
    • Investment Feasibility Matrix
    • Value Chain Analysis
    • PESTLE and Porter’s Analysis
    • Regulatory Landscape
    • Regional Parent Market Outlook
    • Production and Consumption Statistics
    • Import and Export Statistics
  4. Global Market Analysis 2020 to 2024 and Forecast, 2025 to 2035
    • Historical Market Size Value (USD Million) Analysis, 2020 to 2024
    • Current and Future Market Size Value (USD Million) Projections, 2025 to 2035
      • Y-o-Y Growth Trend Analysis
      • Absolute $ Opportunity Analysis
  5. Global Market Pricing Analysis 2020 to 2024 and Forecast 2025 to 2035
  6. Global Market Analysis 2020 to 2024 and Forecast 2025 to 2035, By Application
    • Introduction / Key Findings
    • Historical Market Size Value (USD Million) Analysis By Application , 2020 to 2024
    • Current and Future Market Size Value (USD Million) Analysis and Forecast By Application , 2025 to 2035
      • Monitoring Drug Treatment Response
      • Bio Distribution Studies
      • Cancer Cell Detection
      • Biomarkers
      • Longitudinal Studies
      • Epigenetics
    • Y-o-Y Growth Trend Analysis By Application , 2020 to 2024
    • Absolute $ Opportunity Analysis By Application , 2025 to 2035
  7. Global Market Analysis 2020 to 2024 and Forecast 2025 to 2035, By Technology
    • Introduction / Key Findings
    • Historical Market Size Value (USD Million) Analysis By Technology, 2020 to 2024
    • Current and Future Market Size Value (USD Million) Analysis and Forecast By Technology, 2025 to 2035
      • Magnetic Resonance Imaging (MRI)
      • Digital Angiography
      • Ultrasound
      • Nuclear Imaging
      • Positron Emission Tomography (PET)
      • Single Photon Emission Computerized Tomography (SPECT)
      • Optical Imaging (OI)
      • Bioluminescence Imaging
      • Cerenkov Luminescence Imaging
      • Others
      • Ultrasound Imaging
    • Y-o-Y Growth Trend Analysis By Technology, 2020 to 2024
    • Absolute $ Opportunity Analysis By Technology, 2025 to 2035
  8. Global Market Analysis 2020 to 2024 and Forecast 2025 to 2035, By End-Use
    • Introduction / Key Findings
    • Historical Market Size Value (USD Million) Analysis By End-Use, 2020 to 2024
    • Current and Future Market Size Value (USD Million) Analysis and Forecast By End-Use, 2025 to 2035
      • Hospitals
      • Clinics
      • Pharmaceutical Research Institutes
      • Diagnostic Laboratories
      • Forensic Laboratories
      • Educational Research Institutes
    • Y-o-Y Growth Trend Analysis By End-Use, 2020 to 2024
    • Absolute $ Opportunity Analysis By End-Use, 2025 to 2035
  9. Global Market Analysis 2020 to 2024 and Forecast 2025 to 2035, By Region
    • Introduction
    • Historical Market Size Value (USD Million) Analysis By Region, 2020 to 2024
    • Current Market Size Value (USD Million) Analysis and Forecast By Region, 2025 to 2035
      • North America
      • Latin America
      • Western Europe
      • Eastern Europe
      • East Asia
      • South Asia and Pacific
      • Middle East & Africa
    • Market Attractiveness Analysis By Region
  10. North America Market Analysis 2020 to 2024 and Forecast 2025 to 2035, By Country
    • Historical Market Size Value (USD Million) Trend Analysis By Market Taxonomy, 2020 to 2024
    • Market Size Value (USD Million) Forecast By Market Taxonomy, 2025 to 2035
      • By Country
        • USA
        • Canada
        • Mexico
      • By Application
      • By Technology
      • By End-Use
    • Market Attractiveness Analysis
      • By Country
      • By Application
      • By Technology
      • By End-Use
    • Key Takeaways
  11. Latin America Market Analysis 2020 to 2024 and Forecast 2025 to 2035, By Country
    • Historical Market Size Value (USD Million) Trend Analysis By Market Taxonomy, 2020 to 2024
    • Market Size Value (USD Million) Forecast By Market Taxonomy, 2025 to 2035
      • By Country
        • Brazil
        • Chile
        • Rest of Latin America
      • By Application
      • By Technology
      • By End-Use
    • Market Attractiveness Analysis
      • By Country
      • By Application
      • By Technology
      • By End-Use
    • Key Takeaways
  12. Western Europe Market Analysis 2020 to 2024 and Forecast 2025 to 2035, By Country
    • Historical Market Size Value (USD Million) Trend Analysis By Market Taxonomy, 2020 to 2024
    • Market Size Value (USD Million) Forecast By Market Taxonomy, 2025 to 2035
      • By Country
        • Germany
        • UK
        • Italy
        • Spain
        • France
        • Nordic
        • BENELUX
        • Rest of Western Europe
      • By Application
      • By Technology
      • By End-Use
    • Market Attractiveness Analysis
      • By Country
      • By Application
      • By Technology
      • By End-Use
    • Key Takeaways
  13. Eastern Europe Market Analysis 2020 to 2024 and Forecast 2025 to 2035, By Country
    • Historical Market Size Value (USD Million) Trend Analysis By Market Taxonomy, 2020 to 2024
    • Market Size Value (USD Million) Forecast By Market Taxonomy, 2025 to 2035
      • By Country
        • Russia
        • Poland
        • Hungary
        • Balkan & Baltic
        • Rest of Eastern Europe
      • By Application
      • By Technology
      • By End-Use
    • Market Attractiveness Analysis
      • By Country
      • By Application
      • By Technology
      • By End-Use
    • Key Takeaways
  14. East Asia Market Analysis 2020 to 2024 and Forecast 2025 to 2035, By Country
    • Historical Market Size Value (USD Million) Trend Analysis By Market Taxonomy, 2020 to 2024
    • Market Size Value (USD Million) Forecast By Market Taxonomy, 2025 to 2035
      • By Country
        • China
        • Japan
        • South Korea
      • By Application
      • By Technology
      • By End-Use
    • Market Attractiveness Analysis
      • By Country
      • By Application
      • By Technology
      • By End-Use
    • Key Takeaways
  15. South Asia and Pacific Market Analysis 2020 to 2024 and Forecast 2025 to 2035, By Country
    • Historical Market Size Value (USD Million) Trend Analysis By Market Taxonomy, 2020 to 2024
    • Market Size Value (USD Million) Forecast By Market Taxonomy, 2025 to 2035
      • By Country
        • India
        • ASEAN
        • Australia & New Zealand
        • Rest of South Asia and Pacific
      • By Application
      • By Technology
      • By End-Use
    • Market Attractiveness Analysis
      • By Country
      • By Application
      • By Technology
      • By End-Use
    • Key Takeaways
  16. Middle East & Africa Market Analysis 2020 to 2024 and Forecast 2025 to 2035, By Country
    • Historical Market Size Value (USD Million) Trend Analysis By Market Taxonomy, 2020 to 2024
    • Market Size Value (USD Million) Forecast By Market Taxonomy, 2025 to 2035
      • By Country
        • Kingdom of Saudi Arabia
        • Other GCC Countries
        • Turkiye
        • South Africa
        • Other African Union
        • Rest of Middle East & Africa
      • By Application
      • By Technology
      • By End-Use
    • Market Attractiveness Analysis
      • By Country
      • By Application
      • By Technology
      • By End-Use
    • Key Takeaways
  17. Key Countries Market Analysis
    • USA
      • Pricing Analysis
      • Market Share Analysis, 2024
        • By Application
        • By Technology
        • By End-Use
    • Canada
      • Pricing Analysis
      • Market Share Analysis, 2024
        • By Application
        • By Technology
        • By End-Use
    • Mexico
      • Pricing Analysis
      • Market Share Analysis, 2024
        • By Application
        • By Technology
        • By End-Use
    • Brazil
      • Pricing Analysis
      • Market Share Analysis, 2024
        • By Application
        • By Technology
        • By End-Use
    • Chile
      • Pricing Analysis
      • Market Share Analysis, 2024
        • By Application
        • By Technology
        • By End-Use
    • Germany
      • Pricing Analysis
      • Market Share Analysis, 2024
        • By Application
        • By Technology
        • By End-Use
    • UK
      • Pricing Analysis
      • Market Share Analysis, 2024
        • By Application
        • By Technology
        • By End-Use
    • Italy
      • Pricing Analysis
      • Market Share Analysis, 2024
        • By Application
        • By Technology
        • By End-Use
    • Spain
      • Pricing Analysis
      • Market Share Analysis, 2024
        • By Application
        • By Technology
        • By End-Use
    • France
      • Pricing Analysis
      • Market Share Analysis, 2024
        • By Application
        • By Technology
        • By End-Use
    • India
      • Pricing Analysis
      • Market Share Analysis, 2024
        • By Application
        • By Technology
        • By End-Use
    • ASEAN
      • Pricing Analysis
      • Market Share Analysis, 2024
        • By Application
        • By Technology
        • By End-Use
    • Australia & New Zealand
      • Pricing Analysis
      • Market Share Analysis, 2024
        • By Application
        • By Technology
        • By End-Use
    • China
      • Pricing Analysis
      • Market Share Analysis, 2024
        • By Application
        • By Technology
        • By End-Use
    • Japan
      • Pricing Analysis
      • Market Share Analysis, 2024
        • By Application
        • By Technology
        • By End-Use
    • South Korea
      • Pricing Analysis
      • Market Share Analysis, 2024
        • By Application
        • By Technology
        • By End-Use
    • Russia
      • Pricing Analysis
      • Market Share Analysis, 2024
        • By Application
        • By Technology
        • By End-Use
    • Poland
      • Pricing Analysis
      • Market Share Analysis, 2024
        • By Application
        • By Technology
        • By End-Use
    • Hungary
      • Pricing Analysis
      • Market Share Analysis, 2024
        • By Application
        • By Technology
        • By End-Use
    • Kingdom of Saudi Arabia
      • Pricing Analysis
      • Market Share Analysis, 2024
        • By Application
        • By Technology
        • By End-Use
    • Turkiye
      • Pricing Analysis
      • Market Share Analysis, 2024
        • By Application
        • By Technology
        • By End-Use
    • South Africa
      • Pricing Analysis
      • Market Share Analysis, 2024
        • By Application
        • By Technology
        • By End-Use
  18. Market Structure Analysis
    • Competition Dashboard
    • Competition Benchmarking
    • Market Share Analysis of Top Players
      • By Regional
      • By Application
      • By Technology
      • By End-Use
  19. Competition Analysis
    • Competition Deep Dive
      • Bruker Corporation
        • Overview
        • Product Portfolio
        • Profitability by Market Segments (Product/Age /Sales Channel/Region)
        • Sales Footprint
        • Strategy Overview
          • Marketing Strategy
          • Product Strategy
          • Channel Strategy
      • Life Technologies Corporation
      • Miltenyi Viotech GmbH
      • Biosacan, Inc.
      • Gamma Meddica
      • Targeson, Inc.
      • Sanco Medical
      • Aspect Imaging
      • Mediso Medical Imaging Systems
      • Perkin Elmer Inc.
      • FUJIFILM Holdings Corporation
      • Siemens AG
  20. Assumptions & Acronyms Used
  21. Research Methodology

List of Tables

  • Table 1: Global Market Value (USD Million) Forecast by Region, 2020-2035
  • Table 2: Global Market Value (USD Million) Forecast by Application , 2020-2035
  • Table 3: Global Market Value (USD Million) Forecast by Technology, 2020-2035
  • Table 4: Global Market Value (USD Million) Forecast by End-Use, 2020-2035
  • Table 5: North America Market Value (USD Million) Forecast by Country, 2020-2035
  • Table 6: North America Market Value (USD Million) Forecast by Application , 2020-2035
  • Table 7: North America Market Value (USD Million) Forecast by Technology, 2020-2035
  • Table 8: North America Market Value (USD Million) Forecast by End-Use, 2020-2035
  • Table 9: Latin America Market Value (USD Million) Forecast by Country, 2020-2035
  • Table 10: Latin America Market Value (USD Million) Forecast by Application , 2020-2035
  • Table 11: Latin America Market Value (USD Million) Forecast by Technology, 2020-2035
  • Table 12: Latin America Market Value (USD Million) Forecast by End-Use, 2020-2035
  • Table 13: Western Europe Market Value (USD Million) Forecast by Country, 2020-2035
  • Table 14: Western Europe Market Value (USD Million) Forecast by Application , 2020-2035
  • Table 15: Western Europe Market Value (USD Million) Forecast by Technology, 2020-2035
  • Table 16: Western Europe Market Value (USD Million) Forecast by End-Use, 2020-2035
  • Table 17: Eastern Europe Market Value (USD Million) Forecast by Country, 2020-2035
  • Table 18: Eastern Europe Market Value (USD Million) Forecast by Application , 2020-2035
  • Table 19: Eastern Europe Market Value (USD Million) Forecast by Technology, 2020-2035
  • Table 20: Eastern Europe Market Value (USD Million) Forecast by End-Use, 2020-2035
  • Table 21: East Asia Market Value (USD Million) Forecast by Country, 2020-2035
  • Table 22: East Asia Market Value (USD Million) Forecast by Application , 2020-2035
  • Table 23: East Asia Market Value (USD Million) Forecast by Technology, 2020-2035
  • Table 24: East Asia Market Value (USD Million) Forecast by End-Use, 2020-2035
  • Table 25: South Asia and Pacific Market Value (USD Million) Forecast by Country, 2020-2035
  • Table 26: South Asia and Pacific Market Value (USD Million) Forecast by Application , 2020-2035
  • Table 27: South Asia and Pacific Market Value (USD Million) Forecast by Technology, 2020-2035
  • Table 28: South Asia and Pacific Market Value (USD Million) Forecast by End-Use, 2020-2035
  • Table 29: Middle East & Africa Market Value (USD Million) Forecast by Country, 2020-2035
  • Table 30: Middle East & Africa Market Value (USD Million) Forecast by Application , 2020-2035
  • Table 31: Middle East & Africa Market Value (USD Million) Forecast by Technology, 2020-2035
  • Table 32: Middle East & Africa Market Value (USD Million) Forecast by End-Use, 2020-2035

List of Figures

  • Figure 1: Global Market Pricing Analysis
  • Figure 2: Global Market Value (USD Million) Forecast 2020-2035
  • Figure 3: Global Market Value (USD Million) Share and BPS Analysis by Region, 2025 and 2035
  • Figure 4: Global Market Y-o-Y Growth Comparison by Region, 2025-2035
  • Figure 5: Global Market Attractiveness Analysis by Region
  • Figure 6: North America Market Incremental Dollar Opportunity, 2025-2035
  • Figure 7: Latin America Market Incremental Dollar Opportunity, 2025-2035
  • Figure 8: Western Europe Market Incremental Dollar Opportunity, 2025-2035
  • Figure 9: Eastern Europe Market Incremental Dollar Opportunity, 2025-2035
  • Figure 10: East Asia Market Incremental Dollar Opportunity, 2025-2035
  • Figure 11: South Asia and Pacific Market Incremental Dollar Opportunity, 2025-2035
  • Figure 12: Middle East & Africa Market Incremental Dollar Opportunity, 2025-2035
  • Figure 13: North America Market Value Share and BPS Analysis by Country, 2025 and 2035
  • Figure 14: Latin America Market Value Share and BPS Analysis by Country, 2025 and 2035
  • Figure 15: Western Europe Market Value Share and BPS Analysis by Country, 2025 and 2035
  • Figure 16: Eastern Europe Market Value Share and BPS Analysis by Country, 2025 and 2035
  • Figure 17: East Asia Market Value Share and BPS Analysis by Country, 2025 and 2035
  • Figure 18: South Asia and Pacific Market Value Share and BPS Analysis by Country, 2025 and 2035
  • Figure 19: Middle East & Africa Market Value Share and BPS Analysis by Country, 2025 and 2035
  • Figure 20: Global Market - Tier Structure Analysis
  • Figure 21: Global Market - Company Share Analysis

Frequently Asked Questions

How big is the in vivo imaging systems market in 2025?

The global in vivo imaging systems market is estimated to be valued at USD 58.6 million in 2025.

What will be the size of in vivo imaging systems market in 2035?

The market size for the in vivo imaging systems market is projected to reach USD 80.3 million by 2035.

How much will be the in vivo imaging systems market growth between 2025 and 2035?

The in vivo imaging systems market is expected to grow at a 3.2% CAGR between 2025 and 2035.

What are the key product types in the in vivo imaging systems market?

The key product types in in vivo imaging systems market are monitoring drug treatment response, bio distribution studies, cancer cell detection, biomarkers, longitudinal studies and epigenetics.

Which technology segment to contribute significant share in the in vivo imaging systems market in 2025?

In terms of technology, magnetic resonance imaging (mri) segment to command 26.7% share in the in vivo imaging systems market in 2025.

Explore Similar Insights

Future Market Insights

In Vivo Imaging Systems Market