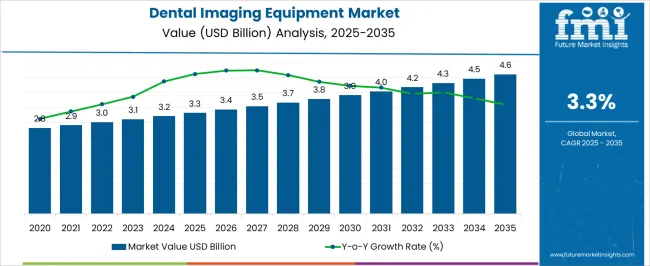
The dental imaging equipment market is experiencing consistent expansion driven by increasing demand for advanced diagnostic tools, rising prevalence of dental disorders, and the growing emphasis on early and accurate diagnosis. The current scenario reflects a strong shift toward digital and 3D imaging systems that enhance precision and reduce patient discomfort.
Integration of artificial intelligence and computer-aided imaging has further strengthened diagnostic capabilities across clinical practices. The future outlook remains positive as dental service providers continue adopting technologically advanced imaging solutions to improve patient outcomes and operational efficiency.
Growth is being supported by the rising number of dental procedures, expanding access to oral healthcare, and favorable reimbursement policies across developed regions The market’s long-term expansion is underpinned by the modernization of dental facilities, training programs for digital imaging proficiency, and increasing investment in portable and user-friendly imaging devices that align with the evolving needs of dental professionals.

| Metric | Value |
|---|---|
| Dental Imaging Equipment Market Estimated Value in (2025 E) | USD 3.3 billion |
| Dental Imaging Equipment Market Forecast Value in (2035 F) | USD 4.6 billion |
| Forecast CAGR (2025 to 2035) | 3.3% |

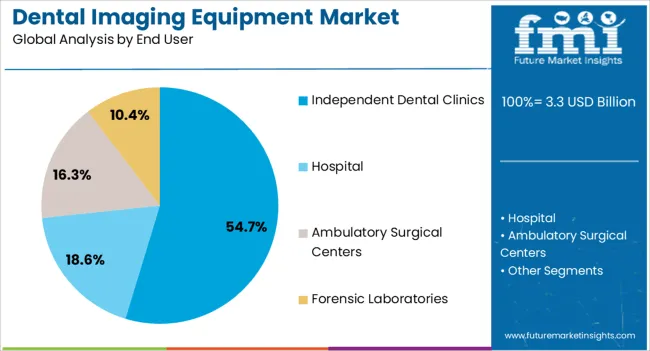
The market is segmented by Product Type and End User and region. By Product Type, the market is divided into Intraoral X-Ray Systems, Intraoral Plate Scanner, Intraoral Sensors, Intraoral Phosphor Storage Plates, Extraoral X-ray Systems, Cone-Beam Computed Tomography (CBCT) Imaging, and Intraoral Cameras. In terms of End User, the market is classified into Independent Dental Clinics, Hospital, Ambulatory Surgical Centers, and Forensic Laboratories. Regionally, the market is classified into North America, Latin America, Western Europe, Eastern Europe, Balkan & Baltic Countries, Russia & Belarus, Central Asia, East Asia, South Asia & Pacific, and the Middle East & Africa.

The intraoral X-ray systems segment, accounting for 36.40% of the product type category, has maintained its leadership due to its critical role in providing detailed images for diagnostics, treatment planning, and monitoring of oral diseases. The segment’s growth is supported by consistent adoption in both routine dental checkups and specialized procedures.
Technological innovations such as digital sensors, low-radiation devices, and real-time imaging have enhanced operational efficiency and patient safety. Demand has been reinforced by the affordability and compact design of intraoral systems, making them suitable for a wide range of dental practices.
Manufacturers are focusing on enhancing image resolution and integrating wireless capabilities to streamline workflow With continued emphasis on preventive dentistry and precision diagnostics, the segment is expected to sustain strong adoption rates and contribute significantly to overall market expansion.

The independent dental clinics segment, holding 54.70% of the end user category, has emerged as the dominant user group due to the rapid expansion of private dental practices and increasing patient preference for personalized care. The segment’s dominance is supported by flexibility in equipment procurement and quicker adoption of advanced imaging technologies compared to larger institutional setups.
Independent clinics are prioritizing digital transformation to enhance diagnostic accuracy, patient experience, and treatment efficiency. Accessibility to affordable financing options and leasing models has further encouraged equipment upgrades.
Additionally, rising competition among clinics has prompted investments in state-of-the-art imaging systems to differentiate service offerings As dental care awareness grows and patient volumes increase, independent dental clinics are expected to remain the primary growth driver for the dental imaging equipment market in the coming years.
| Historical CAGR | 4.80% |
|---|---|
| Forecast CAGR | 3.30% |
The historical CAGR of the dental imaging equipment market stood at 4.80%, reflecting a period of robust expansion driven by several key factors. Initially, advancements in imaging technology, such as digital radiography and cone-beam computed tomography (CBCT), fueled demand as dental practitioners sought more precise and efficient diagnostic tools.
However, the forecasted CAGR of 3.30% indicates a deceleration in growth compared to historical performance. Several factors have contributed to this downward trend. One significant factor is market saturation in developed regions, where the adoption of dental imaging equipment has reached a plateau due to widespread availability and high penetration rates.
Moreover, economic uncertainties and budget constraints in the healthcare sector have led some dental practices to delay or defer investments in new imaging technologies, impacting market growth.
Rising Demand for Digital Dentistry
The shift towards digital dentistry practices is fueling the adoption of dental imaging equipment. Digital workflows streamline processes, improve treatment planning accuracy, and enhance patient outcomes. As dental practices increasingly embrace digital solutions for diagnosis, treatment, and patient management, the demand for advanced imaging equipment is expected to surge.
Growing Awareness of Preventive Dentistry
Increasing awareness among patients about the importance of preventive dental care is influencing market dynamics. Dental professionals are emphasizing early detection and intervention through routine imaging screenings, promoting the adoption of imaging equipment in both general and specialized dental practices. The emphasis on preventive dentistry is projected to sustain market growth in the long term.
Emphasis on Minimally Invasive Dentistry
The growing trend towards minimally invasive dental procedures is driving the demand for imaging equipment that enables precise diagnostics and treatment planning. Dental professionals are increasingly adopting imaging solutions that enable conservative treatment options and preserve tooth structure, reflecting a broader trend towards patient-centric care.
Integration with Practice Management Software
Integration of dental imaging equipment with practice management software systems is becoming increasingly important for dental practices seeking to streamline workflows and improve efficiency. Equipment manufacturers are focusing on developing interoperable solutions that seamlessly integrate with existing practice management platforms, offering dentists greater convenience and workflow optimization.
This section provides detailed insights into specific segments in the dental imaging equipment industry.
| Top Product Type | Intraoral X-ray Systems |
|---|---|
| Market Share in 2025 | 25% |
Intraoral x-ray systems are projected to capture a substantial 25% market share in 2025, signifying their widespread use in dental practices.
Growth Drivers:
| Dominating End User | Independent Dental Clinics |
|---|---|
| Market Share in 2025 | 69% |
Independent dental clinics are expected to hold a dominant 69% market share in 2025.
The section analyzes the dental imaging equipment market across key countries, including the United States, United Kingdom, Thailand, India, and Germany. The analysis delves into the specific factors driving the demand for dental imaging equipments in these countries.
| Countries | CAGR |
|---|---|
| United States | 2.4% |
| United Kingdom | 1.20% |
| Thailand | 5.2% |
| India | 6.20% |
| Germany | 1.40% |

The dental imaging equipment industry in the United States is anticipated to rise at a CAGR of 2.4% through 2035.
The dental imaging equipment industry in the United Kingdom is projected to rise at a CAGR of 1.20% through 2035.
Thailand’s dental imaging equipment industry is likely to witness expansion at a CAGR of 5.2% through 2035.
India's dental imaging equipment industry is projected to rise at a CAGR of 6.20% through 2035.
Germany's dental imaging equipment market is expected to expand at a 1.40% CAGR through 2035.

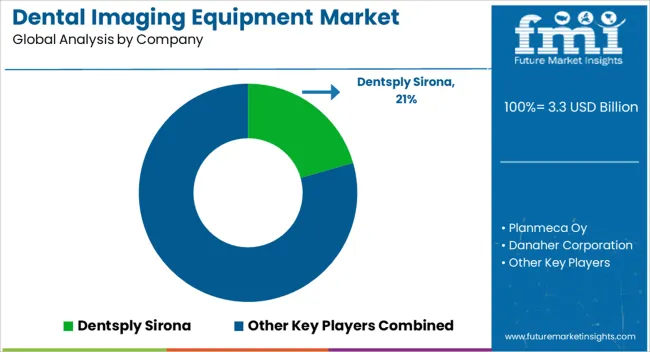
The dental imaging equipment industry presents a landscape where established players and aspiring challengers vie for market share. Multinational corporations like Dentsply Sirona, Danaher Corporation (through its subsidiary, Sirona Dental), and Planmeca Oy hold a dominant position, leveraging their extensive product portfolios, brand recognition, and well-established distribution networks.
Innovative startups are emerging, offering niche solutions and harnessing technological advancements to carve out a space in the market. These companies often target specific applications, like cone beam CT (CBCT) imaging or cloud-based software solutions, catering to the evolving needs of dental professionals. Additionally, strategic partnerships and acquisitions are shaping the competitive landscape.
Established players are forging collaborations with technology companies to integrate cutting-edge features like artificial intelligence (AI) and machine learning into their imaging equipment.
Recent Developments in the Dental Imaging Equipment Industry
The global dental imaging equipment market is estimated to be valued at USD 3.3 billion in 2025.
The market size for the dental imaging equipment market is projected to reach USD 4.6 billion by 2035.
The dental imaging equipment market is expected to grow at a 3.3% CAGR between 2025 and 2035.
The key product types in dental imaging equipment market are intraoral x-ray systems, _wall/floor mounted intraoral x-ray systems, _hand-held intraoral x-ray systems, intraoral plate scanner, intraoral sensors, intraoral phosphor storage plates, extraoral x-ray systems, _panoramic x-rays systems, _cephalometric projections systems, cone-beam computed tomography (cbct) imaging and intraoral cameras.
In terms of end user, independent dental clinics segment to command 54.7% share in the dental imaging equipment market in 2025.


Our Research Products

The "Full Research Suite" delivers actionable market intel, deep dives on markets or technologies, so clients act faster, cut risk, and unlock growth.

The Leaderboard benchmarks and ranks top vendors, classifying them as Established Leaders, Leading Challengers, or Disruptors & Challengers.

Locates where complements amplify value and substitutes erode it, forecasting net impact by horizon

We deliver granular, decision-grade intel: market sizing, 5-year forecasts, pricing, adoption, usage, revenue, and operational KPIs—plus competitor tracking, regulation, and value chains—across 60 countries broadly.

Spot the shifts before they hit your P&L. We track inflection points, adoption curves, pricing moves, and ecosystem plays to show where demand is heading, why it is changing, and what to do next across high-growth markets and disruptive tech

Real-time reads of user behavior. We track shifting priorities, perceptions of today’s and next-gen services, and provider experience, then pace how fast tech moves from trial to adoption, blending buyer, consumer, and channel inputs with social signals (#WhySwitch, #UX).

Partner with our analyst team to build a custom report designed around your business priorities. From analysing market trends to assessing competitors or crafting bespoke datasets, we tailor insights to your needs.
Supplier Intelligence
Discovery & Profiling
Capacity & Footprint
Performance & Risk
Compliance & Governance
Commercial Readiness
Who Supplies Whom
Scorecards & Shortlists
Playbooks & Docs
Category Intelligence
Definition & Scope
Demand & Use Cases
Cost Drivers
Market Structure
Supply Chain Map
Trade & Policy
Operating Norms
Deliverables
Buyer Intelligence
Account Basics
Spend & Scope
Procurement Model
Vendor Requirements
Terms & Policies
Entry Strategy
Pain Points & Triggers
Outputs
Pricing Analysis
Benchmarks
Trends
Should-Cost
Indexation
Landed Cost
Commercial Terms
Deliverables
Brand Analysis
Positioning & Value Prop
Share & Presence
Customer Evidence
Go-to-Market
Digital & Reputation
Compliance & Trust
KPIs & Gaps
Outputs
Full Research Suite comprises of:
Market outlook & trends analysis
Interviews & case studies
Strategic recommendations
Vendor profiles & capabilities analysis
5-year forecasts
8 regions and 60+ country-level data splits
Market segment data splits
12 months of continuous data updates
DELIVERED AS:
PDF EXCEL ONLINE
Global Nuclear Imaging Equipment Market Insights – Trends & Forecast 2024-2034
Veterinary Dental Equipment Market Size and Share Forecast Outlook 2025 to 2035
Refurbished Dental Equipment Market Size and Share Forecast Outlook 2025 to 2035
Dental Diagnostic and Surgical Equipment Market Analysis - Trends & Forecast 2024 to 2034
Orthopaedic Imaging Equipment Market Report – Growth & Forecast 2025-2035
Dental Repair Membranes for Implant Procedures Market Size and Share Forecast Outlook 2025 to 2035
Dental Cavity Filling Materials Market Size and Share Forecast Outlook 2025 to 2035
Dental Implant and Prosthetic Market Size and Share Forecast Outlook 2025 to 2035
Dental Wounds Treatment Market Size and Share Forecast Outlook 2025 to 2035
Dental Radiometer Market Size and Share Forecast Outlook 2025 to 2035
Dental Anaesthetic Market Size and Share Forecast Outlook 2025 to 2035
Dental Diamond Bur Market Size and Share Forecast Outlook 2025 to 2035
Dental Laboratory Market Size and Share Forecast Outlook 2025 to 2035
Dental Matrix Systems Market Size and Share Forecast Outlook 2025 to 2035
Dental Permanent Cements Market Size and Share Forecast Outlook 2025 to 2035
Dental Bleaching Agent Market Size and Share Forecast Outlook 2025 to 2035
Dental Care Products Market Size and Share Forecast Outlook 2025 to 2035
Dental Etching Liquid Market Size and Share Forecast Outlook 2025 to 2035
Dental Sutures Market Analysis - Size, Share, and Forecast Outlook 2025 to 2035
Equipment Management Software Market Size and Share Forecast Outlook 2025 to 2035

Thank you!
You will receive an email from our Business Development Manager. Please be sure to check your SPAM/JUNK folder too.
Chat With
MaRIA