The Dental Units Market is estimated to be valued at USD 698.0 million in 2025 and is projected to reach USD 1,126.2 million by 2035, registering a compound annual growth rate (CAGR) of 4.9% over the forecast period.
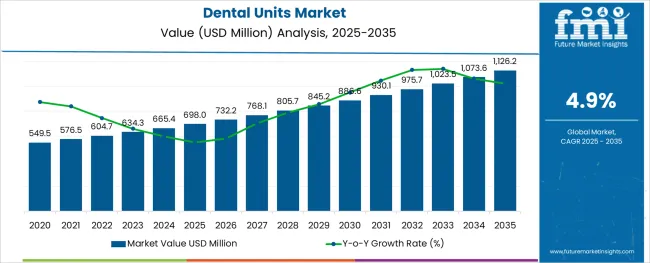
The dental units market is experiencing steady growth driven by advancements in dental care technology and increasing demand for modern treatment facilities. Growing awareness of oral health and rising patient visits to dental clinics have encouraged the adoption of advanced dental equipment. The need for ergonomic and efficient dental units has become crucial to improving treatment outcomes and patient comfort.
Enhanced features in dental units such as automation and precision controls are meeting the evolving requirements of dental professionals. Furthermore, expanding dental infrastructure, particularly in urban areas, is contributing to market growth. Increasing investments in dental clinics and rising healthcare expenditure have also played significant roles in market expansion.
Future growth is expected to be supported by innovations in product design and the integration of digital technology. Segmental growth is projected to be led by electromechanical dental unit chairs as the preferred product type, over-the-patient delivery dental units in chair delivery systems, and dental units designed for dental clinics in end users.
The market is segmented by Product Type, Chair Delivery System, and End Users and region. By Product Type, the market is divided into Electromechanical Dental Unit Chairs and Hydraulic Dental Units. In terms of Chair Delivery System, the market is classified into Over-the-patient Delivery Dental Units, Over-the-head Dental Unit Systems, Rare Dental Unit Delivery System, and Side Dental Unit Delivery System.
Based on End Users, the market is segmented into Dental Units for Dental Clinics, Dental Units for Hospitals, and Dental Units for Academic & Research Institutes. Regionally, the market is classified into North America, Latin America, Western Europe, Eastern Europe, Balkan & Baltic Countries, Russia & Belarus, Central Asia, East Asia, South Asia & Pacific, and the Middle East & Africa.
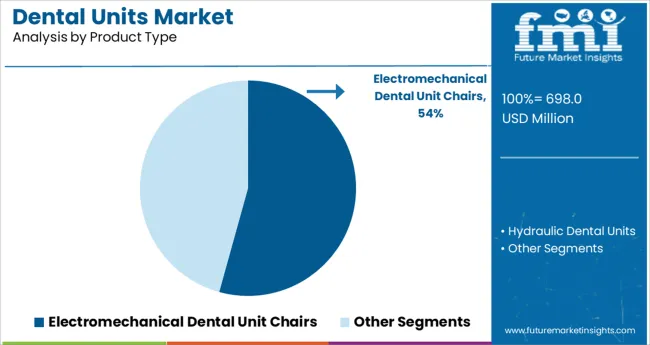
The electromechanical dental unit chairs segment is expected to account for 54.3% of the market revenue in 2025, maintaining its dominance among product types. This segment’s growth is attributed to the enhanced precision and ease of operation provided by electromechanical systems. Dental professionals favor these chairs for their ability to offer smooth positioning and multiple programmable functions that improve procedural efficiency and patient comfort.
The integration of advanced technology in electromechanical units has facilitated better control over chair movements, reducing manual adjustments. Additionally, the durability and low maintenance requirements of these units have made them preferred choices for dental clinics aiming for long-term investments.
The increasing trend toward automation and digital integration in dental practices is expected to sustain the growth of electromechanical dental unit chairs.
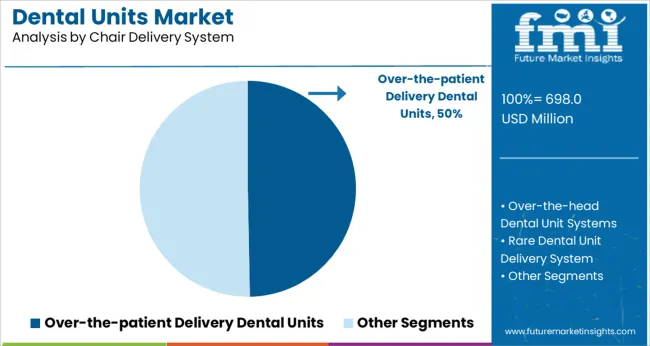
The over-the-patient delivery dental units segment is projected to hold 49.7% of the market revenue in 2025, leading the chair delivery system category. This segment has grown due to the convenience and accessibility offered by over-the-patient delivery systems, allowing dental professionals to manage instruments and controls efficiently during procedures.
The design enhances workspace ergonomics and reduces treatment time by positioning equipment within easy reach. Dental clinics prefer these systems as they improve operational workflow and patient management.
Furthermore, advances in compact and modular designs have made these units adaptable to various clinic sizes and treatment requirements. The growing emphasis on improving clinical efficiency and patient comfort is expected to drive continued adoption of over-the-patient delivery dental units.
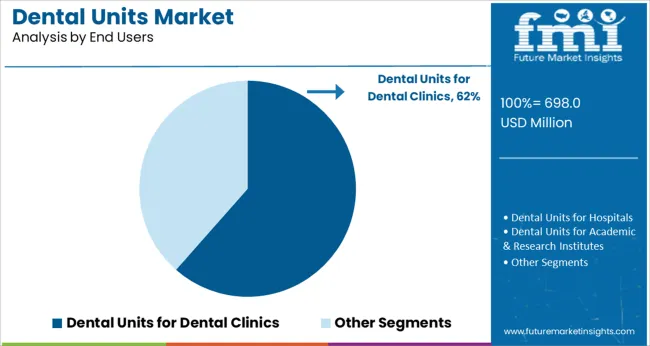
The dental units for dental clinics segment is projected to contribute 61.5% of the market revenue in 2025, maintaining its position as the largest end user segment. Growth in this segment has been driven by the increasing number of dental clinics worldwide and their focus on upgrading clinical infrastructure. Clinics prioritize dental units that provide comprehensive functionality, reliability, and patient comfort to enhance service quality.
The rise in dental tourism and demand for cosmetic dentistry procedures has further fueled the need for advanced dental units in clinics. Additionally, dental professionals are investing in equipment that supports a wide range of treatments to cater to diverse patient needs.
Expanding healthcare access and increasing government initiatives to improve oral health infrastructure are also supporting segment growth. The dental units for dental clinics segment is expected to continue dominating the market due to these factors.
The growing prevalence of dental disorders like periodontal diseases, tooth decay, dental crack, dental cavities, and gum diseases are expected to benefit the market during the forecast period. Another factor contributing to the market growth is the growing awareness of dental aesthetics and ongoing development in dental setups. Also, the growing number of dentists in developing didn’t is projected to offer significant market opportunities to the players in the coming time.
For instance, India has the second-largest number of dentists in the world. In 2024 the country achieved more than the ideal dentist to population ratio of 1: 5000 as against 1:7500 recommended by the World Health Organization. Attributed to such factors, the market is expected to expand significantly in the forecast period.
High costs associated with dental chairs and lack of awareness regarding oral health are expected to hamper the market growth during the forecast period. The cost of a dental chair ranges from USD 1,000 for the basic model, with the average model costing from USD 2,000 to 4,000 and premium chairs costing more than USD 8,000. Thus, the inability to afford the expensive is projected to play a significant role in limiting the market growth during the forecast period.
However, growing medical tourism in developing countries and increasing disposable income can counter the hampering causes and act as a significant opportunity for the market in the assessment period.
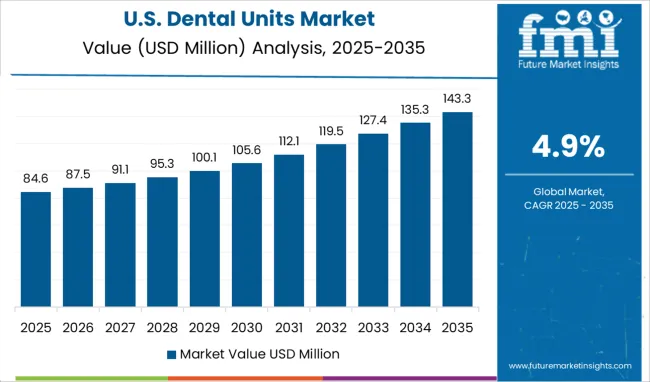
As per the analysis, the global dental units market is expected to dominate the market in the forecast period. The region is expected to garner about 37.8% of the global market share in 2025.
Domination of the region can be attributed to the awareness of oral hygiene among the population. As per American Dental Association, 85% of Americans value dental health and consider oral health an essential component of a healthy life. Further, strong medical infrastructure and well-established reimbursement policies are projected to support the market growth in the forecast period.
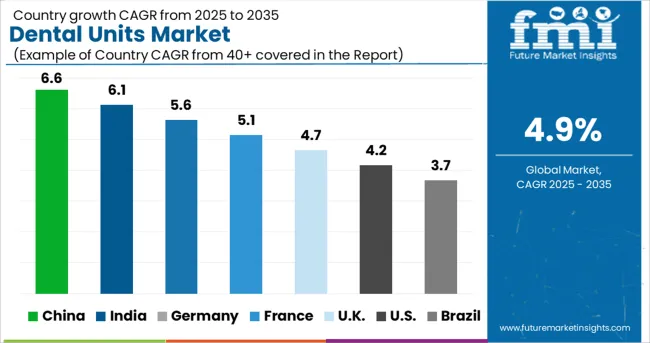
As per the analysis, Europe is projected to secure the second-largest market during the forecast period. As of 2025, the region is expected to secure 31.3% of the global market share.
The growth of the region can be attributed to the growing awareness of oral hygiene and the introduction of technologies like CAD/CAM for dental restoration procedures is anticipated to be another factor boosting the market growth during the forecast period.
Emerging entities such as Clowak Innovations, Tend, One Medical, Smile Direct Club, Tend, UniCorn DenMart, Envista Holdings Corporation (Danaher) and SilverfoxDental, among others, are projected to make a significant contribution to developing the market during the forecast period. Aforementioned players are anticipated to make it big in the global dental units market, seeking to address key challenges involved in disbursing good quality dental care.
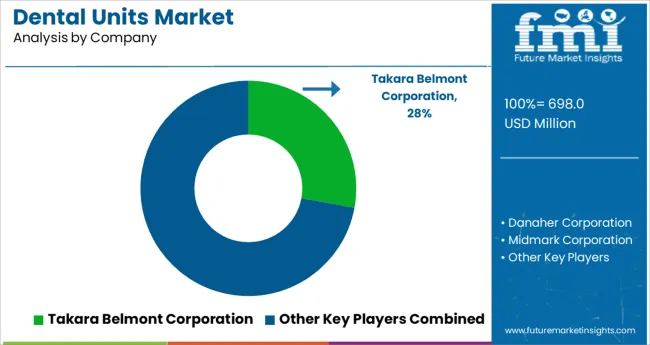
Key players in the global dental units market include Danaher Corporation, Takara Belmont Corporation, Midmark Corporation, Planmeca Oy, KaVo Group companies, Dentsply Sirona, Ritter Dental, SMTmax, Pelton & Crane, ULTRA DENT Dental-Medizinische Geräte GmbH & Co. KG, among others.
Recent Developments in the Industry include
| Report Attribute | Details |
|---|---|
| Growth Rate | 4.9% CAGR from 2025 to 2035 |
| Market Value in 2025 | USD 698.0 million |
| Market Value in 2035 | USD 1,126.2 million |
| Base Year for Estimation | 2024 |
| Historical Data | 2020 to 2024 |
| Forecast Period | 2025 to 2035 |
| Quantitative Units | million for Value |
| Report Coverage | Revenue Forecast, Volume Forecast, Company Ranking, Competitive Landscape, Growth Factors, Trends, and Pricing Analysis |
| Segments Covered | Product Type, Chair Delivery System, End User, Region |
| Regions Covered | North America; Latin America; Europe; Asia Pacific; Middle East & Africa |
| Key Countries Profiled | USA, Canada, Brazil, Mexico, Germany, UK, France, Spain, Italy, China, Japan, South Korea, GCC, South Africa, Israel |
| Key Companies Profiled | Danaher Corporation; Takara Belmont Corporation; Midmark Corporation; Planmeca Oy; KaVo Group; Dentsply Sirona; Ritter Dental; SMTmax; Pelton & Crane; ULTRADENT Dental-Medizinische Geräte GmbH & Co. KG |
| Customization Scope | Available upon Request |
The global dental units market is estimated to be valued at USD 698.0 million in 2025.
It is projected to reach USD 1,126.2 million by 2035.
The market is expected to grow at a 4.9% CAGR between 2025 and 2035.
The key product types are electromechanical dental unit chairs and hydraulic dental units.
over-the-patient delivery dental units segment is expected to dominate with a 49.7% industry share in 2025.


Full Research Suite comprises of:
Market outlook & trends analysis
Interviews & case studies
Strategic recommendations
Vendor profiles & capabilities analysis
5-year forecasts
8 regions and 60+ country-level data splits
Market segment data splits
12 months of continuous data updates
DELIVERED AS:
PDF EXCEL ONLINE
Dental Imaging Equipment Market Forecast and Outlook 2025 to 2035
Dental Wounds Treatment Market Size and Share Forecast Outlook 2025 to 2035
Dental Radiometer Market Size and Share Forecast Outlook 2025 to 2035
Dental Anaesthetic Market Size and Share Forecast Outlook 2025 to 2035
Dental Diamond Bur Market Size and Share Forecast Outlook 2025 to 2035
Dental Laboratory Market Size and Share Forecast Outlook 2025 to 2035
Dental Matrix Systems Market Size and Share Forecast Outlook 2025 to 2035
Dental Permanent Cements Market Size and Share Forecast Outlook 2025 to 2035
Dental Bleaching Agent Market Size and Share Forecast Outlook 2025 to 2035
Dental Care Products Market Size and Share Forecast Outlook 2025 to 2035
Dental Etching Liquid Market Size and Share Forecast Outlook 2025 to 2035
Dental Sutures Market Analysis - Size, Share, and Forecast Outlook 2025 to 2035
Dental Hygiene Devices Market Size and Share Forecast Outlook 2025 to 2035
Dental Implantology Software Market Analysis - Size, Growth, & Forecast Outlook 2025 to 2035
Dental Veneers Market Size and Share Forecast Outlook 2025 to 2035
Dental X-Ray Systems Market Analysis - Size, Share, and Forecast Outlook 2025 to 2035
Dental Suction Systems Market Size and Share Forecast Outlook 2025 to 2035
Dental Articulators Market Size and Share Forecast Outlook 2025 to 2035
Dental Fluoride Varnish Market Size and Share Forecast Outlook 2025 to 2035
Dental Adhesives Market Size and Share Forecast Outlook 2025 to 2035

Thank you!
You will receive an email from our Business Development Manager. Please be sure to check your SPAM/JUNK folder too.
Chat With
MaRIA