Dental Sutures Market Forecast and Outlook 2025 to 2035

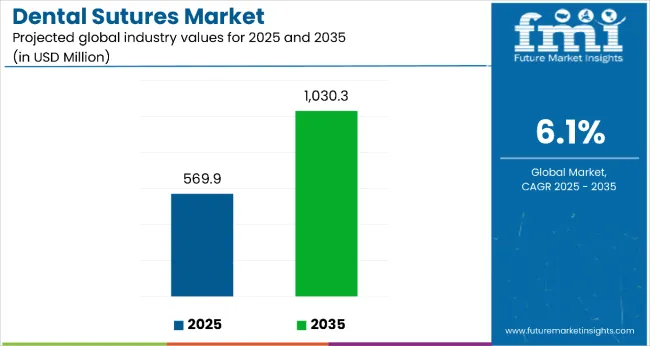
The sector is expected to expand robustly from USD 569.9 million in 2025 to USD 1,030.3 million by 2035, growing at a CAGR of 6.1%. Growth is driven by increasing dental surgeries, rising awareness of oral health, growing cosmetic dentistry demand, and technological advancements in suture materials.
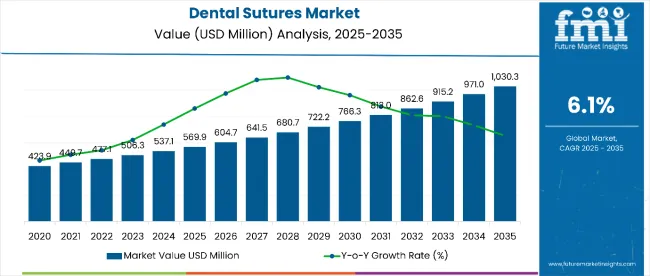
Dental Sutures Market Value Analysis

Quick Stats for Dental Sutures Market

  • Dental Sutures Market Value (2025): USD 569.9 million
  • Dental Sutures Market Forecast Value (2035): USD 1030.3 million
  • Dental Sutures Market Forecast CAGR (2025 to 2035): 6.1%
  • Leading Segment in Dental Sutures Market 2025: Emergency (67%)
  • Key Growth Regions in Dental Sutures Market: Asia Pacific and North America
  • Top Players in Dental Sutures Market: B. Braun Melsungen AG, Medtronic plc, Johnson & Johnson, Teleflex Incorporated, Smith & Nephew plc

Dental Sutures Market

Metric Value
Estimated Value in 2025 (E) USD 569.9 million
Forecast Value in 2035 (F) USD 1030.3 million
Forecast CAGR (2025 to 2035) 6.1%

Additionally, supportive government initiatives to improve dental healthcare infrastructure and the rising prevalence of oral diseases contribute significantly to market expansion. The increasing number of trained dental professionals globally also fuels the demand for advanced and reliable dental suturing solutions.

By 2030, the market is projected to reach USD 766.3 million, reflecting healthy mid-term growth driven by the increasing global incidence of dental procedures requiring effective wound closure. Over 2025 to 2035, the sector is poised to achieve an absolute growth of USD 460.2 million, underscoring the expanding patient base, increasing number of dental specialists, and innovations in absorbable and synthetic suture technologies that improve safety and efficacy in dental treatments worldwide.

Leading companies such as B. Braun Melsungen AG, Medtronic plc, Johnson & Johnson, Teleflex Incorporated, and Smith & Nephew plc are consolidating their positions by strengthening product portfolios and advancing next‑generation dental suture technologies.

Their focus includes enhanced biocompatible materials, improved tensile strength, and bioabsorbable innovations that minimize tissue reaction and promote faster healing, enabling stronger market penetration across both developed healthcare systems and emerging regions. By investing in innovation, reliability, and cost-effective solutions, these players are enhancing access for dental professionals while capturing growth opportunities in a competitive and evolving dental care segment.

The market holds a critical position in oral surgical and implant procedures, driven by increasing volumes of dental surgeries and cosmetic dentistry treatments. Absorbable sutures, representing 58% of usage, reduce follow-up visits and minimize discomfort.

Synthetic sutures account for 62% of usage due to superior handling and infection control, are favored for their superior handling and infection control properties. This sector contributes substantially to the broader dental care and surgical supplies market, driven by consistent procedural demand, advancements in suture technology, and expanding dental healthcare access globally.

The market is evolving with bioabsorbable polymers, antibacterial coatings, and monofilament designs that enhance surgical precision, reduce infection risk, and improve patient comfort and outcomes. Companies are strengthening their offerings with smarter, easier-to-use suture systems aiming to optimize healing and reduce complications such as stitch abscesses or tissue inflammation. Strategic collaborations with dental clinics, hospitals, and dental associations are enhancing accessibility, positioning advanced sutures as essential for oral surgery, implantology, and periodontal treatments globally.

Why is the Dental Sutures Market Growing?

The market is experiencing robust growth driven by multiple interconnected factors. One of the primary drivers is the increasing number of dental surgeries worldwide, fueled by the rising prevalence of oral diseases such as periodontal disease, tooth decay, and oral cancers.

As more patients seek restorative, reconstructive, and cosmetic dental procedures, the demand for effective wound closure solutions like dental sutures naturally escalates. Furthermore, increasing awareness about oral health among the global population encourages patients to pursue timely dental treatments, contributing to higher procedural volumes.

Advancements in dental suture technologies also play a crucial role. Innovations in biocompatible, absorbable, and synthetic material sutures have improved surgical outcomes by reducing tissue inflammation, minimizing infection risk, and enhancing wound healing. These developments make dental sutures more convenient and effective for both dentists and patients. Moreover, the growing demand for cosmetic dentistry, spurred by a younger generation valuing dental aesthetics, further boosts market expansion.

Dental Sutures Market Analysis by Top Investment Segments

The market is segmented by application, end user, and region. By application, the market is divided into emergency, non-emergency (mental health transport, intensive care patient transport, and others), and non-medical transportation (medical repatriation services, event covers, and others). Based on end user, the market is categorized into hospitals, medical centres, retirement communities, hospice care facilities, private paying customers, and nursing care facilities. Regionally, the market is classified into North America, Latin America, East Asia, South Asia and Pacific, Western Europe, Eastern Europe, and the Middle East and Africa.
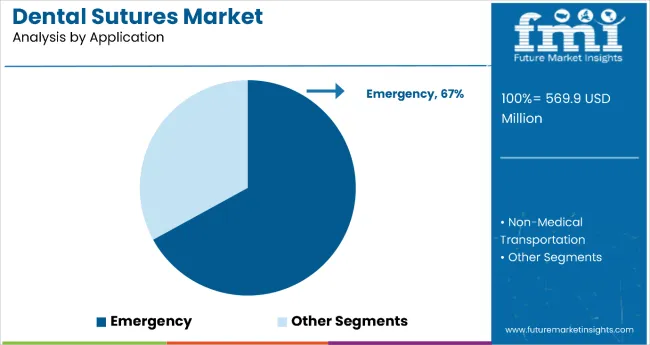
By Application, Emergency Segment Accounts for 67% Market Share

Dental Sutures Market By Application

The emergency segment is the most critical and lucrative within dental sutures applications, commanding 67% of the segment revenue in 2025. This segment’s prominence is attributed to its indispensable role in providing rapid and life-saving transport for patients experiencing acute medical conditions such as trauma, cardiac arrests, strokes, and other emergencies where immediate clinical intervention is vital. Emergency services utilize ambulances equipped with advanced life support systems and staffed by trained medical professionals to deliver critical care en route to healthcare facilities, significantly improving patient outcomes.

Growth in this segment is driven by rising incidences of chronic diseases, increasing traffic accidents, aging populations, and heightened public and governmental focus on emergency preparedness and healthcare infrastructure investment. Technological advancements in ambulance design, onboard medical equipment, and real-time communication systems further enhance service efficiency and patient safety. Regionally, North America leads this market, supported by well-established emergency medical services and regulatory frameworks, while Asia Pacific is witnessing rapid growth due to expanding healthcare infrastructure and urbanization.
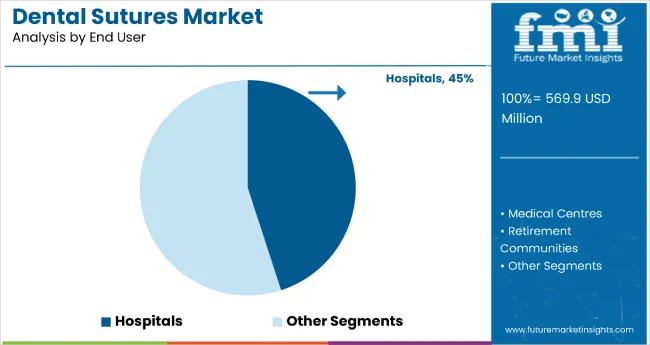
By End User, Hospitals Segment Account for 45% Market Share

Dental Sutures Market By End User

The most lucrative end-user segment in the medical transportation market is Hospitals, commanding a significant market share of 45% in 2025. Hospitals dominate due to their critical role as primary providers of dental surgical procedures requiring sutures, supported by advanced infrastructure and high procedural volumes. The rising prevalence of chronic diseases such as cardiovascular disorders, strokes, and respiratory illnesses drives frequent patient transfers to hospitals for immediate and continuous care.

Furthermore, hospitals require reliable transportation networks to ensure timely access to diagnostic, surgical, and rehabilitation services. This end-user segment benefits from accelerated investment in healthcare expansion globally, especially in developed regions like North America and Europe, alongside growing infrastructure in emerging markets. The emphasis on improving patient outcomes and reducing hospital readmissions through efficient transport services also fuels demand. Overall, continuous advancements in hospital facilities, increased patient volumes, and the critical need for timely medical intervention position Hospitals as the most lucrative and fastest-growing end-user segment in the medical transportation market.

What are the Drivers, Restraints, and Key Trends of the Dental Sutures Market?

From 2025 to 2035, the market is driven by increasing dental surgery rates, rising prevalence of oral diseases among pediatric and elderly populations, and expanding dental healthcare infrastructure globally. Technological advancements such as bioabsorbable sutures, antimicrobial coatings, and enhanced synthetic materials are improving safety, efficacy, and patient comfort, encouraging wider adoption. Increasing access in emerging regions like India and China fuels market expansion.

Health Awareness and Clinical Innovation Boost Dental Sutures Market Growth

Growing awareness among dental professionals and patients about oral health, coupled with improved diagnostic technologies in dental care, is a key driver of the dental sutures market. Innovative suture materials, particularly absorbable and synthetic types, improve patient outcomes by reducing inflammation and promoting faster healing. Rising adoption of minimally invasive dental surgical techniques further supports market expansion.

Innovation and Sustainability Expanding Dental Sutures Market Opportunities

Innovation in dental sutures is broadening market opportunities beyond traditional suture types. Advances include antibacterial coatings, bioabsorbable polymers, and monofilament designs that improve healing and reduce infection risks. Manufacturers emphasize sustainable practices, including eco-friendly materials and production processes. Regulatory compliance, quality certifications, and durability standards are focal points, appealing to dental healthcare providers and patients alike.
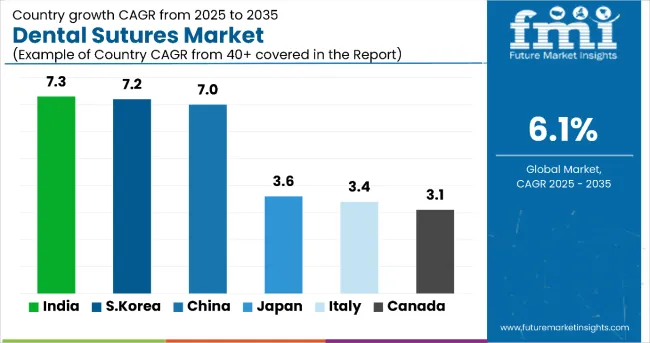
Dental Sutures Market Analysis by Key Countries

Dental Sutures Market Country Wise Analysis

Country CAGR
India 7.3%
South Korea 7.2%
China 7.0%
Japan 3.6%
Italy 3.4%
Canada 3.1%

The dental sutures market exhibits diverse growth across countries, driven by healthcare infrastructure and demographics. India leads with a 7.3% CAGR, fueled by expanding dental clinics and increased oral health awareness. South Korea and China follow closely with CAGRs of 7.2% and 7.0%, supported by innovation and urbanization. Mature markets like Japan (CAGR 3.6%), Italy (CAGR 3.4%), Canada (CAGR 3.1%), and France (CAGR 2.7%) show steady growth due to aging populations and established healthcare systems. Emerging economies have higher growth potential from underserved demand, while developed countries focus on innovation and maintaining care quality, reflecting global market maturity differences.

The report covers an in-depth analysis of 40+ countries; six top-performing OECD countries are highlighted below.

Production Capacity Trends in Dental Sutures Market in India

Revenue from dental sutures in India is witnessing rapid growth with a CAGR of 7.3%. This expansion is largely driven by rising oral health awareness and a growing number of dental surgeries, especially cosmetic procedures. Government initiatives aimed at enhancing healthcare infrastructure and increasing dental care accessibility in rural areas fuel demand. Increasing disposable incomes in urban regions are leading consumers to opt for advanced dental treatments, boosting the market. Additionally, collaborations between local manufacturers and global players are bringing cutting-edge bioabsorbable and synthetic sutures to the region.

The expanding network of dental clinics and the rise of dental tourism further accelerate volume growth. Research and development efforts focus on improving suture materials and techniques to better cater to patient needs. Overall, India’s favorable demographics, economic growth, and healthcare investments position it as a high-potential market in the dental sutures landscape.

  • Growing healthcare infrastructure and dental clinic networks.
  • Rising demand for cosmetic dentistry and advanced treatments.
  • Collaborations with global manufacturers enhancing technology transfer.

Output Expansion in Dental Sutures Market in South Korea

Revenue from dental sutures in South Korea exhibits a strong CAGR of 7.2% in the dental sutures market, driven by high innovation capacity and healthcare investment. The country boasts widespread adoption of advanced dental technologies such as bioabsorbable sutures that minimize tissue inflammation and improve healing. A skilled dental workforce and government support for healthcare innovation empower faster procedural adoption. Premium and cosmetic dental treatments are highly valued by South Korean consumers, expanding product demand.

Multinational firms maintain robust distribution channels, ensuring timely availability. Focus on R&D aids in developing next-generation sutures with antimicrobial properties and better biocompatibility. The increasing preference for minimally invasive procedures supports the uptake of advanced suturing materials. Overall, South Korea’s technologically advanced healthcare ecosystem underpins this market’s dynamic growth.

  • High rate of innovation in dental materials and techniques.
  • Government-backed healthcare innovation programs.
  • Robust dental insurance coverage improving accessibility.

Structural Adoption in Dental Sutures Market in China

Revenue from dental sutures in China maintains a CAGR of 7.0%, fueled by massive oral healthcare needs and expanding dental care access. Rapid urbanization and rising middle-class incomes are contributing factors, increasing demand for elective and preventive dental procedures. Tier-2 and tier-3 city healthcare infrastructure improvements broaden treatment availability beyond metropolitan centers. The government promotes oral health reforms and dental tourism, augmenting procedural volumes. Local manufacturers collaborate with foreign entities to enhance product range and distribution networks.

Popularity of synthetic and absorbable sutures reflects patient demand for less painful, complications-free post-surgical experiences. Education programs boost clinical expertise nationwide. Logistics optimization ensures product availability across vast geography, supporting sustained market growth rooted in both demographics and health policy.

  • Expanding dental clinic infrastructure beyond major cities.
  • Increasing oral health awareness and preventive care adoption.
  • Strategic partnerships between local and foreign players enhancing offerings.

Structural Growth Dynamics in Dental Sutures Market in Japan

Demand for dental sutures in Japan grows steadily with a CAGR of around 3.6%, reflecting its advanced healthcare maturity and aging demographic. Demand is sustained by a large geriatric population requiring restorative and rehabilitative dental treatments. The marketplace emphasizes biocompatible, absorbable sutures that reduce tissue irritation and prevent infections. Comprehensive dental insurance coverage facilitates these advanced treatments being affordable. Regulatory rigor ensures high quality and safety standards, fostering trust among providers and patients.

Manufacturer and dental clinic collaborations drive continuous product optimization tailored to clinical needs. Focus on minimally invasive surgical techniques further propels suture material innovation. Japan’s market highlights maturity, stable growth, and sustained adoption driven by patient-centric innovation.

  • Strong oral healthcare focus for aging population.
  • High regulatory standards ensuring product safety.
  • Emphasis on minimally invasive and biocompatible materials.

Production Capacity Enhancement in Dental Sutures Market in Italy

Demand for dental sutures in Italy, growing at a CAGR of 3.4%, benefits from its advanced healthcare system and rising dental procedures among the elderly. Increasing demand for cosmetic and reconstructive dental interventions is boosting suture consumption. The government supports dental insurance schemes encouraging elective surgeries.

Local manufacturers focus on innovation in synthetic and absorbable materials tailored to patient comfort and healing efficiency. Private dental clinics proliferate, particularly in metropolitan areas, catering to affluent populations seeking advanced care. Efforts to train more dental specialists and integrate new suture technologies improve overall treatment outcomes. These factors combine to sustain Italy’s meaningful presence in the global dental sutures supply chain and market.

  • Growing elective cosmetic and reconstructive dental procedures.
  • Government-supported dental insurance reimbursement.
  • Innovation in synthetic and absorbable sutures by local manufacturers.

Output Expansion Trends in Dental Sutures Market in Canada

Demand for dental sutures in Canada grows steadily at a CAGR of 3.1%, driven by comprehensive healthcare frameworks and increased oral health initiatives. Expanding public and private dental insurance coverage supports access to advanced suturing materials. The rising volume of dental surgeries due to increasing patient awareness and aging populations boosts demand.

Technological innovations such as bioabsorbable sutures improve procedural outcomes and patient satisfaction. The coexistence of public and private dental sectors enables wider market reach. Ongoing training of dental professionals sparks the adoption of newer suture product lines. Canada’s well-established healthcare infrastructure facilitates distribution and availability nationwide, making it a key market in North America’s dental sutures landscape.
  • Government oral health programs advancing prevention and care.
  • Expansion of dental insurance coverage influencing treatment uptake.
  • Increasing dental surgeries due to aging population and awareness.

Competitive Landscape of the Dental Sutures Market

Dental Sutures Market By Company

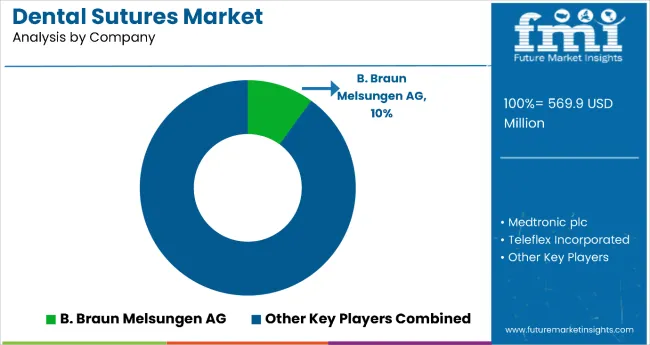
The market is characterized by the presence of several global and regional players focused on innovation, strategic partnerships, and expanding product portfolios to gain market share. Leading companies include B. Braun Melsungen AG, Medtronic plc, Johnson & Johnson, Teleflex Incorporated, and Smith & Nephew plc, all of which invest heavily in research and development to introduce advanced suturing materials such as bioabsorbable, antimicrobial, and synthetic sutures. These players aim to enhance product efficacy, safety, and patient comfort, catering to increasing demand from dental surgeries and cosmetic procedures.

Manufacturers are also leveraging strategic collaborations with dental clinics, hospitals, and distributors to expand geographical reach and strengthen supply chains. Emerging markets like India and China attract increased attention due to rising dental healthcare infrastructure and demand for high-quality suturing products. To differentiate, companies are focusing on developing minimally invasive suturing technologies and cost-effective solutions to appeal to diverse patient segments.

Scope of Report

Items Values
Quantitative Units (2025) USD 569.9 million
Application Emergency, Non-Emergency (Mental Health Transport, Intensive Care Patient Transport, Others, Non-Medical Transportation (Medical Repatriation Services, Event Covers, Others
End User Hospitals, Medical Centres, Retirement Communities, Hospice Care Facilities, Private Paying Customers, Nursing Care Facilities
Regions Covered India, South Korea, China, Japan, Italy, Canada, France
Countries Covered India, South Korea, China, Japan, Italy, Canada, France, United States, Germany, United Kingdom, Australia, and 40+ countries
Key Companies Profiled ATS Healthcare Solutions, Xpress Non-Emergency Medical Transportation, American Medical Response, ProHealth Care, Watts Healthcare, ERS Transition Ltd., ModivCare Solutions LLC, Goodfaith Medical Transportation Company Inc., Hope Medical Transportation Service LLC, National Medtrans Network, Air Methods Corporation, Envision Healthcare Corporation, Acadian, NSL Limited, Airmed International LLC, Airpal Inc., and Falck A/S.
Additional Attributes Revenue by product type and material type; regional demand trends; competitive landscape; adoption of bioabsorbable and antimicrobial sutures; healthcare infrastructure development; minimally invasive dental surgery advances; rising dental surgery volumes; oral health and cosmetic dentistry awareness

Key Segments

By Application:

  • Emergency
  • Non-Emergency
  • Mental Health Transport
  • Intensive Care Patient Transport
  • Others
  • Non-Medical Transportation
  • Medical Repatriation Services
  • Event Covers
  • Others

By End User:

  • Hospitals
  • Medical Centres
  • Retirement Communities
  • Hospice Care Facilities
  • Private Paying Customers
  • Nursing Care Facilities

By Region:

  • North America
  • Latin America
  • Western Europe
  • Eastern Europe
  • East Asia
  • South Asia & Pacific
  • Middle East and Africa

Table of Content

  1. Executive Summary
    • Global Market Outlook
    • Demand-side Trends
    • Supply-side Trends
    • Technology Roadmap Analysis
    • Analysis and Recommendations
  2. Market Overview
    • Market Coverage / Taxonomy
    • Market Definition / Scope / Limitations
  3. Market Background
    • Market Dynamics
      • Drivers
      • Restraints
      • Opportunity
      • Trends
    • Scenario Forecast
      • Demand in Optimistic Scenario
      • Demand in Likely Scenario
      • Demand in Conservative Scenario
    • Opportunity Map Analysis
    • Product Life Cycle Analysis
    • Supply Chain Analysis
      • Supply Side Participants and their Roles
        • Producers
        • Mid-Level Participants (Traders/ Agents/ Brokers)
        • Wholesalers and Distributors
      • Value Added and Value Created at Node in the Supply Chain
      • List of Raw Material Suppliers
      • List of Existing and Potential Buyer’s
    • Investment Feasibility Matrix
    • Value Chain Analysis
      • Profit Margin Analysis
      • Wholesalers and Distributors
      • Retailers
    • PESTLE and Porter’s Analysis
    • Regulatory Landscape
      • By Key Regions
      • By Key Countries
    • Regional Parent Market Outlook
    • Production and Consumption Statistics
    • Import and Export Statistics
  4. Global Market Analysis 2020 to 2024 and Forecast, 2025 to 2035
    • Historical Market Size Value (USD Million) & Volume (Units) Analysis, 2020 to 2024
    • Current and Future Market Size Value (USD Million) & Volume (Units) Projections, 2025 to 2035
      • Y-o-Y Growth Trend Analysis
      • Absolute $ Opportunity Analysis
  5. Global Market Pricing Analysis 2020 to 2024 and Forecast 2025 to 2035
  6. Global Market Analysis 2020 to 2024 and Forecast 2025 to 2035, By Application
    • Introduction / Key Findings
    • Historical Market Size Value (USD Million) & Volume (Units) Analysis By Application, 2020 to 2024
    • Current and Future Market Size Value (USD Million) & Volume (Units) Analysis and Forecast By Application, 2025 to 2035
      • Emergency
      • Non-Emergency
        • Mental Health Transport
        • Intensive Care Patient Transport
        • Others
      • Non-Medical Transportation
        • Medical Repatriation Services
        • Event Covers
        • Others
    • Y-o-Y Growth Trend Analysis By Application, 2020 to 2024
    • Absolute $ Opportunity Analysis By Application, 2025 to 2035
  7. Global Market Analysis 2020 to 2024 and Forecast 2025 to 2035, By End User
    • Introduction / Key Findings
    • Historical Market Size Value (USD Million) & Volume (Units) Analysis By End User, 2020 to 2024
    • Current and Future Market Size Value (USD Million) & Volume (Units) Analysis and Forecast By End User, 2025 to 2035
      • Hospitals
      • Medical Centres
      • Retirement Communities
      • Hospice Care Facilities
      • Private Paying Customers
      • Nursing Care Facilities
    • Y-o-Y Growth Trend Analysis By End User, 2020 to 2024
    • Absolute $ Opportunity Analysis By End User, 2025 to 2035
  8. Global Market Analysis 2020 to 2024 and Forecast 2025 to 2035, By Region
    • Introduction
    • Historical Market Size Value (USD Million) & Volume (Units) Analysis By Region, 2020 to 2024
    • Current Market Size Value (USD Million) & Volume (Units) Analysis and Forecast By Region, 2025 to 2035
      • North America
      • Latin America
      • Western Europe
      • Eastern Europe
      • East Asia
      • South Asia & Pacific
      • Middle East and Africa
    • Market Attractiveness Analysis By Region
  9. North America Market Analysis 2020 to 2024 and Forecast 2025 to 2035, By Country
    • Historical Market Size Value (USD Million) & Volume (Units) Trend Analysis By Market Taxonomy, 2020 to 2024
    • Market Size Value (USD Million) & Volume (Units) Forecast By Market Taxonomy, 2025 to 2035
      • By Country
        • USA
        • Canada
        • Mexico
      • By Application
      • By End User
    • Market Attractiveness Analysis
      • By Country
      • By Application
      • By End User
    • Key Takeaways
  10. Latin America Market Analysis 2020 to 2024 and Forecast 2025 to 2035, By Country
    • Historical Market Size Value (USD Million) & Volume (Units) Trend Analysis By Market Taxonomy, 2020 to 2024
    • Market Size Value (USD Million) & Volume (Units) Forecast By Market Taxonomy, 2025 to 2035
      • By Country
        • Brazil
        • Argentina
        • Rest of LATAM
      • By Application
      • By End User
    • Market Attractiveness Analysis
      • By Country
      • By Application
      • By End User
    • Key Takeaways
  11. Western Europe Market Analysis 2020 to 2024 and Forecast 2025 to 2035, By Country
    • Historical Market Size Value (USD Million) & Volume (Units) Trend Analysis By Market Taxonomy, 2020 to 2024
    • Market Size Value (USD Million) & Volume (Units) Forecast By Market Taxonomy, 2025 to 2035
      • By Country
        • Germany
        • Italy
        • France
        • UK
        • Spain
        • BENELUX
        • Nordic
        • Rest of W.Europe
      • By Application
      • By End User
    • Market Attractiveness Analysis
      • By Country
      • By Application
      • By End User
    • Key Takeaways
  12. Eastern Europe Market Analysis 2020 to 2024 and Forecast 2025 to 2035, By Country
    • Historical Market Size Value (USD Million) & Volume (Units) Trend Analysis By Market Taxonomy, 2020 to 2024
    • Market Size Value (USD Million) & Volume (Units) Forecast By Market Taxonomy, 2025 to 2035
      • By Country
        • Russia
        • Hungary
        • Poland
        • Balkan & Baltics
        • Rest of E. Europe
      • By Application
      • By End User
    • Market Attractiveness Analysis
      • By Country
      • By Application
      • By End User
    • Key Takeaways
  13. East Asia Market Analysis 2020 to 2024 and Forecast 2025 to 2035, By Country
    • Historical Market Size Value (USD Million) & Volume (Units) Trend Analysis By Market Taxonomy, 2020 to 2024
    • Market Size Value (USD Million) & Volume (Units) Forecast By Market Taxonomy, 2025 to 2035
      • By Country
        • China
        • Japan
        • South Korea
      • By Application
      • By End User
    • Market Attractiveness Analysis
      • By Country
      • By Application
      • By End User
    • Key Takeaways
  14. South Asia & Pacific Market Analysis 2020 to 2024 and Forecast 2025 to 2035, By Country
    • Historical Market Size Value (USD Million) & Volume (Units) Trend Analysis By Market Taxonomy, 2020 to 2024
    • Market Size Value (USD Million) & Volume (Units) Forecast By Market Taxonomy, 2025 to 2035
      • By Country
        • India
        • Australia & New Zealand
        • ASEAN
        • Rest of SAP
      • By Application
      • By End User
    • Market Attractiveness Analysis
      • By Country
      • By Application
      • By End User
    • Key Takeaways
  15. Middle East and Africa Market Analysis 2020 to 2024 and Forecast 2025 to 2035, By Country
    • Historical Market Size Value (USD Million) & Volume (Units) Trend Analysis By Market Taxonomy, 2020 to 2024
    • Market Size Value (USD Million) & Volume (Units) Forecast By Market Taxonomy, 2025 to 2035
      • By Country
        • GCC Countries
        • Northern Africa
        • South Africa
        • Turkiye
        • Rest of MEA
      • By Application
      • By End User
    • Market Attractiveness Analysis
      • By Country
      • By Application
      • By End User
    • Key Takeaways
  16. Key Countries Market Analysis
    • USA
      • Pricing Analysis
      • Market Share Analysis, 2024
        • By Application
        • By End User
    • Canada
      • Pricing Analysis
      • Market Share Analysis, 2024
        • By Application
        • By End User
    • Brazil
      • Pricing Analysis
      • Market Share Analysis, 2024
        • By Application
        • By End User
    • Mexico
      • Pricing Analysis
      • Market Share Analysis, 2024
        • By Application
        • By End User
    • Argentina
      • Pricing Analysis
      • Market Share Analysis, 2024
        • By Application
        • By End User
  17. Market Structure Analysis
    • Competition Dashboard
    • Competition Benchmarking
    • Market Share Analysis of Top Players
      • By Regional
      • By Application
      • By End User
  18. Competition Analysis
    • Competition Deep Dive
      • ATS Healthcare Solutions
        • Overview
        • Product Portfolio
        • Profitability by Market Segments (Product/Age /Sales Channel/Region)
        • Sales Footprint
        • Strategy Overview
          • Marketing Strategy
          • Product Strategy
          • Channel Strategy
      • Xpress Non-Emergency Medical Transportation
        • Overview
        • Product Portfolio
        • Profitability by Market Segments (Product/Age /Sales Channel/Region)
        • Sales Footprint
        • Strategy Overview
          • Marketing Strategy
          • Product Strategy
          • Channel Strategy
      • American Medical Response
        • Overview
        • Product Portfolio
        • Profitability by Market Segments (Product/Age /Sales Channel/Region)
        • Sales Footprint
        • Strategy Overview
          • Marketing Strategy
          • Product Strategy
          • Channel Strategy
      • ProHealth Care
        • Overview
        • Product Portfolio
        • Profitability by Market Segments (Product/Age /Sales Channel/Region)
        • Sales Footprint
        • Strategy Overview
          • Marketing Strategy
          • Product Strategy
          • Channel Strategy
      • Watts Healthcare
        • Overview
        • Product Portfolio
        • Profitability by Market Segments (Product/Age /Sales Channel/Region)
        • Sales Footprint
        • Strategy Overview
          • Marketing Strategy
          • Product Strategy
          • Channel Strategy
      • ERS Transition Ltd.
        • Overview
        • Product Portfolio
        • Profitability by Market Segments (Product/Age /Sales Channel/Region)
        • Sales Footprint
        • Strategy Overview
          • Marketing Strategy
          • Product Strategy
          • Channel Strategy
      • ModivCare Solutions, LLC
        • Overview
        • Product Portfolio
        • Profitability by Market Segments (Product/Age /Sales Channel/Region)
        • Sales Footprint
        • Strategy Overview
          • Marketing Strategy
          • Product Strategy
          • Channel Strategy
      • Goodfaith Medical Transportation Company, Inc.
        • Overview
        • Product Portfolio
        • Profitability by Market Segments (Product/Age /Sales Channel/Region)
        • Sales Footprint
        • Strategy Overview
          • Marketing Strategy
          • Product Strategy
          • Channel Strategy
      • Hope Medical Transportation Service LLC
        • Overview
        • Product Portfolio
        • Profitability by Market Segments (Product/Age /Sales Channel/Region)
        • Sales Footprint
        • Strategy Overview
          • Marketing Strategy
          • Product Strategy
          • Channel Strategy
      • National Medtrans Network
        • Overview
        • Product Portfolio
        • Profitability by Market Segments (Product/Age /Sales Channel/Region)
        • Sales Footprint
        • Strategy Overview
          • Marketing Strategy
          • Product Strategy
          • Channel Strategy
      • Air Methods Corporation
        • Overview
        • Product Portfolio
        • Profitability by Market Segments (Product/Age /Sales Channel/Region)
        • Sales Footprint
        • Strategy Overview
          • Marketing Strategy
          • Product Strategy
          • Channel Strategy
      • Envision Healthcare Corporation
        • Overview
        • Product Portfolio
        • Profitability by Market Segments (Product/Age /Sales Channel/Region)
        • Sales Footprint
        • Strategy Overview
          • Marketing Strategy
          • Product Strategy
          • Channel Strategy
      • Acadian
        • Overview
        • Product Portfolio
        • Profitability by Market Segments (Product/Age /Sales Channel/Region)
        • Sales Footprint
        • Strategy Overview
          • Marketing Strategy
          • Product Strategy
          • Channel Strategy
      • NSL Limited
        • Overview
        • Product Portfolio
        • Profitability by Market Segments (Product/Age /Sales Channel/Region)
        • Sales Footprint
        • Strategy Overview
          • Marketing Strategy
          • Product Strategy
          • Channel Strategy
      • Airmed International LLC
        • Overview
        • Product Portfolio
        • Profitability by Market Segments (Product/Age /Sales Channel/Region)
        • Sales Footprint
        • Strategy Overview
          • Marketing Strategy
          • Product Strategy
          • Channel Strategy
      • Airpal, Inc
        • Overview
        • Product Portfolio
        • Profitability by Market Segments (Product/Age /Sales Channel/Region)
        • Sales Footprint
        • Strategy Overview
          • Marketing Strategy
          • Product Strategy
          • Channel Strategy
      • Falck A/S
        • Overview
        • Product Portfolio
        • Profitability by Market Segments (Product/Age /Sales Channel/Region)
        • Sales Footprint
        • Strategy Overview
          • Marketing Strategy
          • Product Strategy
          • Channel Strategy
  19. Assumptions & Acronyms Used
  20. Research Methodology

List of Tables

  • Table 1: Global Market Value (USD Million) Forecast by Region, 2020-2035
  • Table 2: Global Market Volume (Units) Forecast by Region, 2020-2035
  • Table 3: Global Market Value (USD Million) Forecast by Application, 2020-2035
  • Table 4: Global Market Volume (Units) Forecast by Application, 2020-2035
  • Table 5: Global Market Value (USD Million) Forecast by End User, 2020-2035
  • Table 6: Global Market Volume (Units) Forecast by End User, 2020-2035
  • Table 7: North America Market Value (USD Million) Forecast by Country, 2020-2035
  • Table 8: North America Market Volume (Units) Forecast by Country, 2020-2035
  • Table 9: North America Market Value (USD Million) Forecast by Application, 2020-2035
  • Table 10: North America Market Volume (Units) Forecast by Application, 2020-2035
  • Table 11: North America Market Value (USD Million) Forecast by End User, 2020-2035
  • Table 12: North America Market Volume (Units) Forecast by End User, 2020-2035
  • Table 13: Latin America Market Value (USD Million) Forecast by Country, 2020-2035
  • Table 14: Latin America Market Volume (Units) Forecast by Country, 2020-2035
  • Table 15: Latin America Market Value (USD Million) Forecast by Application, 2020-2035
  • Table 16: Latin America Market Volume (Units) Forecast by Application, 2020-2035
  • Table 17: Latin America Market Value (USD Million) Forecast by End User, 2020-2035
  • Table 18: Latin America Market Volume (Units) Forecast by End User, 2020-2035
  • Table 19: Western Europe Market Value (USD Million) Forecast by Country, 2020-2035
  • Table 20: Western Europe Market Volume (Units) Forecast by Country, 2020-2035
  • Table 21: Western Europe Market Value (USD Million) Forecast by Application, 2020-2035
  • Table 22: Western Europe Market Volume (Units) Forecast by Application, 2020-2035
  • Table 23: Western Europe Market Value (USD Million) Forecast by End User, 2020-2035
  • Table 24: Western Europe Market Volume (Units) Forecast by End User, 2020-2035
  • Table 25: Eastern Europe Market Value (USD Million) Forecast by Country, 2020-2035
  • Table 26: Eastern Europe Market Volume (Units) Forecast by Country, 2020-2035
  • Table 27: Eastern Europe Market Value (USD Million) Forecast by Application, 2020-2035
  • Table 28: Eastern Europe Market Volume (Units) Forecast by Application, 2020-2035
  • Table 29: Eastern Europe Market Value (USD Million) Forecast by End User, 2020-2035
  • Table 30: Eastern Europe Market Volume (Units) Forecast by End User, 2020-2035
  • Table 31: East Asia Market Value (USD Million) Forecast by Country, 2020-2035
  • Table 32: East Asia Market Volume (Units) Forecast by Country, 2020-2035
  • Table 33: East Asia Market Value (USD Million) Forecast by Application, 2020-2035
  • Table 34: East Asia Market Volume (Units) Forecast by Application, 2020-2035
  • Table 35: East Asia Market Value (USD Million) Forecast by End User, 2020-2035
  • Table 36: East Asia Market Volume (Units) Forecast by End User, 2020-2035
  • Table 37: South Asia & Pacific Market Value (USD Million) Forecast by Country, 2020-2035
  • Table 38: South Asia & Pacific Market Volume (Units) Forecast by Country, 2020-2035
  • Table 39: South Asia & Pacific Market Value (USD Million) Forecast by Application, 2020-2035
  • Table 40: South Asia & Pacific Market Volume (Units) Forecast by Application, 2020-2035
  • Table 41: South Asia & Pacific Market Value (USD Million) Forecast by End User, 2020-2035
  • Table 42: South Asia & Pacific Market Volume (Units) Forecast by End User, 2020-2035
  • Table 43: Middle East and Africa Market Value (USD Million) Forecast by Country, 2020-2035
  • Table 44: Middle East and Africa Market Volume (Units) Forecast by Country, 2020-2035
  • Table 45: Middle East and Africa Market Value (USD Million) Forecast by Application, 2020-2035
  • Table 46: Middle East and Africa Market Volume (Units) Forecast by Application, 2020-2035
  • Table 47: Middle East and Africa Market Value (USD Million) Forecast by End User, 2020-2035
  • Table 48: Middle East and Africa Market Volume (Units) Forecast by End User, 2020-2035

List of Figures

  • Figure 1: Global Market Volume (Units) Forecast 2020-2035
  • Figure 2: Global Market Pricing Analysis
  • Figure 3: Global Market Value (USD Million) Forecast 2020-2035
  • Figure 4: Global Market Value Share and BPS Analysis by Application, 2025 and 2035
  • Figure 5: Global Market Y-o-Y Growth Comparison by Application, 2025-2035
  • Figure 6: Global Market Attractiveness Analysis by Application
  • Figure 7: Global Market Value Share and BPS Analysis by End User, 2025 and 2035
  • Figure 8: Global Market Y-o-Y Growth Comparison by End User, 2025-2035
  • Figure 9: Global Market Attractiveness Analysis by End User
  • Figure 10: Global Market Value (USD Million) Share and BPS Analysis by Region, 2025 and 2035
  • Figure 11: Global Market Y-o-Y Growth Comparison by Region, 2025-2035
  • Figure 12: Global Market Attractiveness Analysis by Region
  • Figure 13: North America Market Incremental $ Opportunity, 2025-2035
  • Figure 14: Latin America Market Incremental $ Opportunity, 2025-2035
  • Figure 15: Western Europe Market Incremental $ Opportunity, 2025-2035
  • Figure 16: Eastern Europe Market Incremental $ Opportunity, 2025-2035
  • Figure 17: East Asia Market Incremental $ Opportunity, 2025-2035
  • Figure 18: South Asia & Pacific Market Incremental $ Opportunity, 2025-2035
  • Figure 19: Middle East and Africa Market Incremental $ Opportunity, 2025-2035
  • Figure 20: North America Market Value Share and BPS Analysis by Country, 2025 and 2035
  • Figure 21: North America Market Value Share and BPS Analysis by Application, 2025 and 2035
  • Figure 22: North America Market Y-o-Y Growth Comparison by Application, 2025-2035
  • Figure 23: North America Market Attractiveness Analysis by Application
  • Figure 24: North America Market Value Share and BPS Analysis by End User, 2025 and 2035
  • Figure 25: North America Market Y-o-Y Growth Comparison by End User, 2025-2035
  • Figure 26: North America Market Attractiveness Analysis by End User
  • Figure 27: Latin America Market Value Share and BPS Analysis by Country, 2025 and 2035
  • Figure 28: Latin America Market Value Share and BPS Analysis by Application, 2025 and 2035
  • Figure 29: Latin America Market Y-o-Y Growth Comparison by Application, 2025-2035
  • Figure 30: Latin America Market Attractiveness Analysis by Application
  • Figure 31: Latin America Market Value Share and BPS Analysis by End User, 2025 and 2035
  • Figure 32: Latin America Market Y-o-Y Growth Comparison by End User, 2025-2035
  • Figure 33: Latin America Market Attractiveness Analysis by End User
  • Figure 34: Western Europe Market Value Share and BPS Analysis by Country, 2025 and 2035
  • Figure 35: Western Europe Market Value Share and BPS Analysis by Application, 2025 and 2035
  • Figure 36: Western Europe Market Y-o-Y Growth Comparison by Application, 2025-2035
  • Figure 37: Western Europe Market Attractiveness Analysis by Application
  • Figure 38: Western Europe Market Value Share and BPS Analysis by End User, 2025 and 2035
  • Figure 39: Western Europe Market Y-o-Y Growth Comparison by End User, 2025-2035
  • Figure 40: Western Europe Market Attractiveness Analysis by End User
  • Figure 41: Eastern Europe Market Value Share and BPS Analysis by Country, 2025 and 2035
  • Figure 42: Eastern Europe Market Value Share and BPS Analysis by Application, 2025 and 2035
  • Figure 43: Eastern Europe Market Y-o-Y Growth Comparison by Application, 2025-2035
  • Figure 44: Eastern Europe Market Attractiveness Analysis by Application
  • Figure 45: Eastern Europe Market Value Share and BPS Analysis by End User, 2025 and 2035
  • Figure 46: Eastern Europe Market Y-o-Y Growth Comparison by End User, 2025-2035
  • Figure 47: Eastern Europe Market Attractiveness Analysis by End User
  • Figure 48: East Asia Market Value Share and BPS Analysis by Country, 2025 and 2035
  • Figure 49: East Asia Market Value Share and BPS Analysis by Application, 2025 and 2035
  • Figure 50: East Asia Market Y-o-Y Growth Comparison by Application, 2025-2035
  • Figure 51: East Asia Market Attractiveness Analysis by Application
  • Figure 52: East Asia Market Value Share and BPS Analysis by End User, 2025 and 2035
  • Figure 53: East Asia Market Y-o-Y Growth Comparison by End User, 2025-2035
  • Figure 54: East Asia Market Attractiveness Analysis by End User
  • Figure 55: South Asia & Pacific Market Value Share and BPS Analysis by Country, 2025 and 2035
  • Figure 56: South Asia & Pacific Market Value Share and BPS Analysis by Application, 2025 and 2035
  • Figure 57: South Asia & Pacific Market Y-o-Y Growth Comparison by Application, 2025-2035
  • Figure 58: South Asia & Pacific Market Attractiveness Analysis by Application
  • Figure 59: South Asia & Pacific Market Value Share and BPS Analysis by End User, 2025 and 2035
  • Figure 60: South Asia & Pacific Market Y-o-Y Growth Comparison by End User, 2025-2035
  • Figure 61: South Asia & Pacific Market Attractiveness Analysis by End User
  • Figure 62: Middle East and Africa Market Value Share and BPS Analysis by Country, 2025 and 2035
  • Figure 63: Middle East and Africa Market Value Share and BPS Analysis by Application, 2025 and 2035
  • Figure 64: Middle East and Africa Market Y-o-Y Growth Comparison by Application, 2025-2035
  • Figure 65: Middle East and Africa Market Attractiveness Analysis by Application
  • Figure 66: Middle East and Africa Market Value Share and BPS Analysis by End User, 2025 and 2035
  • Figure 67: Middle East and Africa Market Y-o-Y Growth Comparison by End User, 2025-2035
  • Figure 68: Middle East and Africa Market Attractiveness Analysis by End User
  • Figure 69: Global Market - Tier Structure Analysis
  • Figure 70: Global Market - Company Share Analysis

Frequently Asked Questions

How big is the dental sutures market in 2025?

The global dental sutures market is estimated to be valued at USD 569.9 million in 2025.

What will be the size of dental sutures market in 2035?

The market size for dental sutures is projected to reach USD 1,030.3 million by 2035.

How much will be the dental sutures market growth between 2025 and 2035

The dental sutures market is expected to grow at a 6.1% CAGR between 2025 and 2035.

Which application segment is projected to lead in the dental sutures market in 2025?

The emergency application segment is projected to lead in the dental sutures market with 67% market share in 2025.

Which end-user segment is projected to contribute significant share in the dental sutures market in 2025?

Hospitals are projected to dominate in the dental sutures market with 45% market share in 2025.

Explore Similar Insights

Future Market Insights

Dental Sutures Market

Chat With

MaRIA

Hi There, I am MaRIA, Your Market Research Intelligence Assistant. How may I help you?