The Dental Articulators Market is estimated to be valued at USD 173.5 billion in 2025 and is projected to reach USD 374.6 billion by 2035, registering a compound annual growth rate (CAGR) of 8.0% over the forecast period.
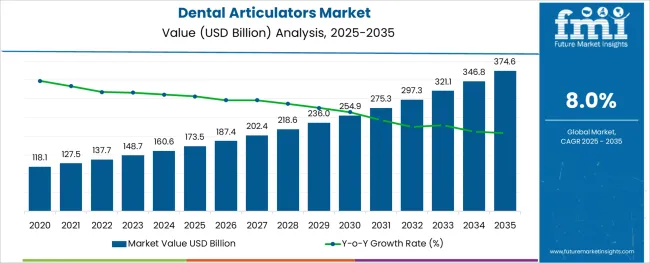
The dental articulators market is expanding steadily due to the rising demand for restorative dental procedures, growing adoption of digital dentistry, and increased awareness of prosthodontic accuracy among practitioners. Dental professionals are focusing on improved treatment planning and functional restoration, which has elevated the importance of articulators that simulate mandibular movement with precision.
As the prevalence of dental disorders and cosmetic dentistry needs rise globally, dental labs and clinics are investing in advanced articulators to enhance diagnostic and fabrication outcomes. The incorporation of CAD CAM technologies and emphasis on workflow efficiency are further boosting market penetration.
This momentum is expected to persist as the dental care ecosystem evolves with a preference for accurate bite replication, patient centric solutions, and long term prosthetic success.
The market is segmented by Product Type, Material Type, and End-User and region. By Product Type, the market is divided into Adjustable Articulators, Semi-adjustable Articulators, and Fully Adjustable Articulators. In terms of Material Type, the market is classified into Stainless Steel, Aluminum, and Brass. Based on End-User, the market is segmented into Hospitals, Specialty Clinics, and Other End-Users. Regionally, the market is classified into North America, Latin America, Western Europe, Eastern Europe, Balkan & Baltic Countries, Russia & Belarus, Central Asia, East Asia, South Asia & Pacific, and the Middle East & Africa.
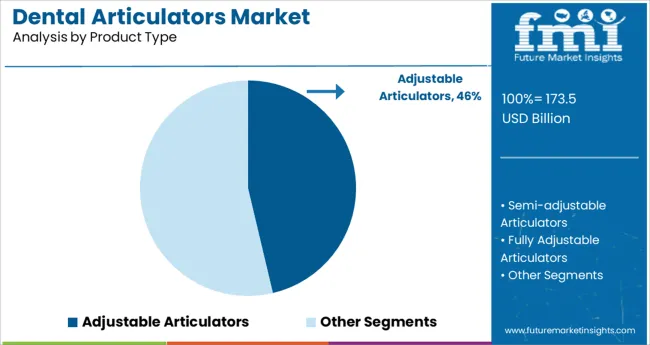
The adjustable articulators segment is projected to represent 46.30% of total market revenue by 2025, making it the leading product type. This dominance is attributed to the flexibility and clinical accuracy these articulators offer in replicating jaw movements and occlusal relationships.
Adjustable articulators are widely used in complex prosthodontic cases where precise articulation is necessary for optimal treatment outcomes. Their capability to mimic various mandibular positions allows dental technicians to fabricate restorations that ensure better fit and comfort.
Moreover, their adaptability makes them ideal for both fixed and removable prosthetics. As dental professionals prioritize precision and patient satisfaction, the use of adjustable articulators continues to grow, reinforcing their position as the preferred product type in the market.
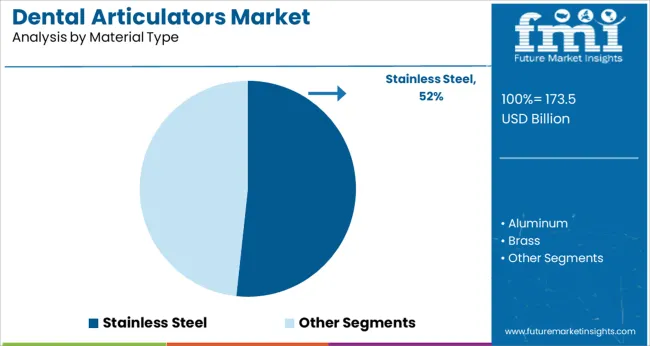
The stainless steel segment is anticipated to hold 51.70% of total market revenue by 2025 within the material category, establishing it as the most utilized material type. This is driven by stainless steel’s durability, corrosion resistance, and long operational life, making it highly suitable for repeated clinical and laboratory use.
Dental professionals value the structural strength and stability offered by stainless steel articulators, particularly in high volume prosthodontic workflows. Its resistance to wear and deformation under continuous use ensures reliable performance over time.
Additionally, stainless steel articulators support precise adjustments and are easy to sterilize, aligning with clinical hygiene standards. These advantages make stainless steel the material of choice across dental laboratories and academic institutions, securing its dominance in the material segment.
As per the Dental Articulators Market research by Future Market Insights - a market research and competitive intelligence provider, historically, from 2020 to 2024, the market value of the Dental Articulators market increased at 6.6% CAGR, wherein, countries such as the USA, The United Kingdom China, South Korea, and Japan held a significant share in the global market. The market is projected to grow at a CAGR of 8% over the coming 10 years.
The expansion is due to technological advancements in dental articulation techniques. Furthermore, as the incidence of oral health issues rises, the demand for dental articulators is expected to rise. The Dental Articulators market is being driven ahead by an increase in awareness about dental ailments, a growing need for dental care in the elderly and pediatric population, and an increase in dental expenditure, social programs, and insurance coverage.
Product upgrades have led to the development of superior files that decrease digital procedural errors. Leading companies such as Dentsply Sirona, Coltene, Henry Schein, and Envista Holdings also benefit from their Research and Development budget to develop cutting-edge new products that benefit market growth.
The expanding government activities in recent years have resulted in the development of dental health programs that have resulted in specialized community dental health.
Due to the increased awareness about oral hygiene, the growing number of people with tooth decay problems, and rising disposable income levels among consumers across different regions, the demand for dental articulators is projected to expand. The market is predicted to develop in response to the rising number of oral health diseases. In many nations, oral health disorders are a significant burden on human health, causing pain, anguish, disfigurement, and even death.
Oral health illness affected about 160.6 billion people worldwide in 2024, according to the World Health Organization. The market is expected to develop due to the spread of oral disorders.
Market growth is expected to be aided by research and development initiatives. The study was conducted to determine the clinical occlusion analysis vs virtual articular and semi-adjustable articulator occlusion analysis, according to an article published in Medicine and Pharmacy Report in 2024. In comparison to a virtual articulator, the semi-adjustable articulator performed better in dynamic and static occlusion studies.
The results of the research and development operations are likely to expand the use of articulators, supporting market growth.
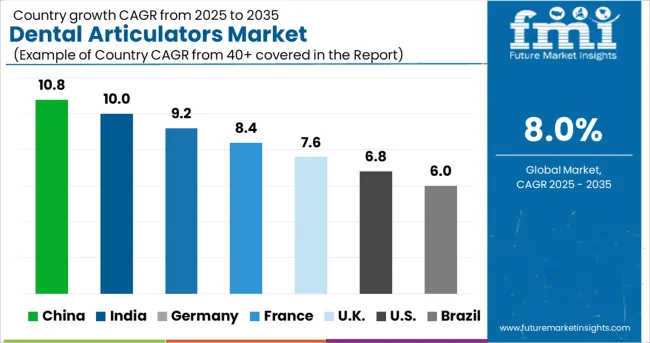
In 2024, North America dominated the market, accounting for more than 40% of the global market. The market in the region is projected to reach a valuation of USD 374.6 million by 2035, growing at a CAGR of 7.6% from 2025 to 2035. From 2025 to 2035, the market is expected to gross an absolute dollar opportunity of USD 60.9 million.
A huge number of patients in the region influences the demand for dental procedures and enhanced medical facilities. A greater attraction to maintaining oral health and improving oral hygiene among all age groups is also projected to drive market growth.
USA Dental Articulators Market Analysis
The dental articulators market in the USA is expected to expand at a CAGR of 7.5% from 2025 to 2035. The market in the country is expected to reach a valuation of USD 374.6 million by 2035. In 2024, the United States was the largest market for dental articulators. Due to the presence of key players in the region and improvement in reimbursement scenario, continual development of technology for enhanced efficiency, and increased awareness about overall dental care among all age groups, the United States will retain its dominant position in the market, during the projected period. This rise was also due to an increase in the uptake of advanced instruments in the dental industry in the United States.
United Kingdom Dental Articulators Market Analysis
The dental articulators market in the United Kingdom was valued at USD 118.1 million in 2020. The market in the country is estimated to reach a valuation of USD 173.5 million by the end of 2025. From 2025 to 2035, the market is expected to gross an absolute dollar opportunity of USD 6.5 million from 2025 to 2035.
Japan Dental Articulators Market Analysis
The Japanese dental articulators market was valued at USD 160.6 million in 2024. The market in the country is projected to reach USD 10.9 million by 2035. Growing at a CAGR of 9.5% from 2025 to 2035, the market in the country is expected to gross an absolute dollar opportunity of USD 6.4 million.
South Korea Dental Articulators Market Analysis
The South Korean dental articulators market is expected to reach USD 5.5 million by 2035. With an absolute dollar opportunity of USD 3 million from 2025 to 2035, the market is likely to witness a CAGR of 8%.
In 2024, nearly 40% of total sales occurred in semi-adjustable categories. Most dental offices use semi-adjustable models because they can complete most dental treatments. Semi-programmable articulators are commonly used because they are more easily found than alternative toolings, such as digital articulators and x-ray information, which are still poorly understood and comprehended. A semi-adjustable aspiring is best used for courses in regard to dentistry training as well as professional development.
The semi-adjustable articulator is likely to skyrocket due to advances in technology, specifically in regards to technology that instantly creates a decision to rapidly change lab jaw movements. The Denar Mark II Semi-adjustable articulator, for example, intends to improve patient procedures and decrease the chances of misdiagnoses.
With a market share of more than 35% in 2024, specialized clinics dominated the dental articulators market. This is due to an increase in the number of dental treatment operations performed in these dental clinics. The increased availability of dental clinics for primary care in developing economies, as well as qualified dental professionals, are expected to drive the segment's expansion.
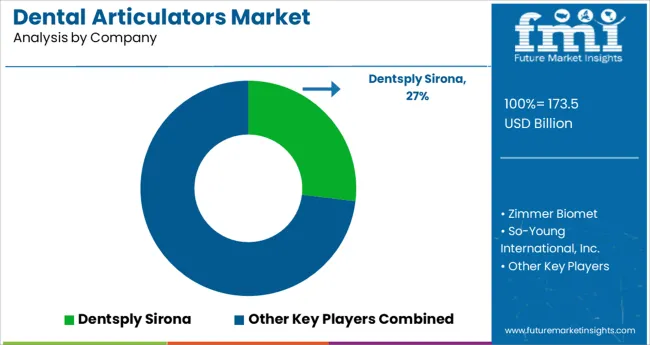
The key players operating in the dental articulators market include Dentsply Sirona, Zimmer Biomet, So-Young International, Inc., Amann Girrbach AG, and SAM.
Some of the recent developments of key Dental Articulators providers are as follows:
Similarly, recent developments related to companies offering Dental Articulators have been tracked by the team at Future Market Insights, which are available in the full report.
The global dental articulators market is estimated to be valued at USD 173.5 billion in 2025.
It is projected to reach USD 374.6 billion by 2035.
The market is expected to grow at a 8.0% CAGR between 2025 and 2035.
The key product types are adjustable articulators, semi-adjustable articulators and fully adjustable articulators.
stainless steel segment is expected to dominate with a 51.7% industry share in 2025.


Full Research Suite comprises of:
Market outlook & trends analysis
Interviews & case studies
Strategic recommendations
Vendor profiles & capabilities analysis
5-year forecasts
8 regions and 60+ country-level data splits
Market segment data splits
12 months of continuous data updates
DELIVERED AS:
PDF EXCEL ONLINE
Dental Implant and Prosthetic Market Size and Share Forecast Outlook 2025 to 2035
Dental Imaging Equipment Market Forecast and Outlook 2025 to 2035
Dental Wounds Treatment Market Size and Share Forecast Outlook 2025 to 2035
Dental Radiometer Market Size and Share Forecast Outlook 2025 to 2035
Dental Anaesthetic Market Size and Share Forecast Outlook 2025 to 2035
Dental Diamond Bur Market Size and Share Forecast Outlook 2025 to 2035
Dental Laboratory Market Size and Share Forecast Outlook 2025 to 2035
Dental Matrix Systems Market Size and Share Forecast Outlook 2025 to 2035
Dental Permanent Cements Market Size and Share Forecast Outlook 2025 to 2035
Dental Bleaching Agent Market Size and Share Forecast Outlook 2025 to 2035
Dental Care Products Market Size and Share Forecast Outlook 2025 to 2035
Dental Etching Liquid Market Size and Share Forecast Outlook 2025 to 2035
Dental Sutures Market Analysis - Size, Share, and Forecast Outlook 2025 to 2035
Dental Hygiene Devices Market Size and Share Forecast Outlook 2025 to 2035
Dental Implantology Software Market Analysis - Size, Growth, & Forecast Outlook 2025 to 2035
Dental Veneers Market Size and Share Forecast Outlook 2025 to 2035
Dental X-Ray Systems Market Analysis - Size, Share, and Forecast Outlook 2025 to 2035
Dental Suction Systems Market Size and Share Forecast Outlook 2025 to 2035
Dental Fluoride Varnish Market Size and Share Forecast Outlook 2025 to 2035
Dental Adhesives Market Size and Share Forecast Outlook 2025 to 2035

Thank you!
You will receive an email from our Business Development Manager. Please be sure to check your SPAM/JUNK folder too.
Chat With
MaRIA