Dental Matrix Systems Market Size and Forecast Snapshot

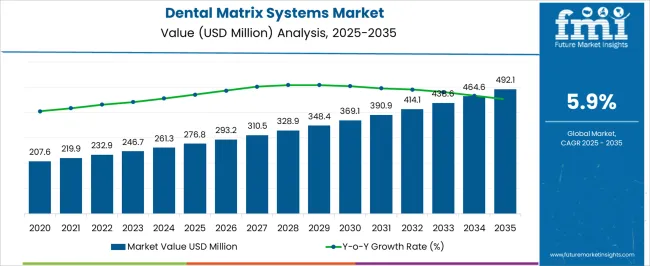
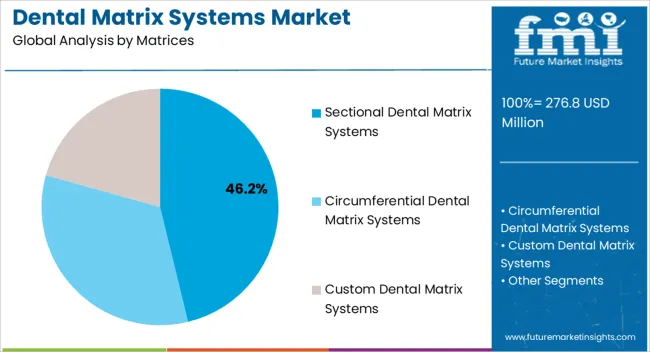
The global Dental Matrix Systems Market was valued at USD 232.5 Million in 2022 and is expected to reach USD 449.0 Million by 2033. The sectional dental matrix systems with around 57.7% in terms of value share, has topped the global market within the matrices category in 2022 and is expected to grow at a CAGR of close to 6.2% over the forecast period (2023 to 2033)

Market Outlook:

Data Points Market Insights
Market Value 2022 USD 232.5 Million
Market Value 2023 USD 245.4 Million
Market Value 2033 USD 449.0 Million
CAGR 2023 to 2033 6.2%
Market Share of Top 5 Countries 50.1%

Ergonomic matrices are designed with the comfort of dental professionals in mind. These products have smooth edges and ergonomic grips that reduce hand fatigue and discomfort during extended procedures. These matrices are versatile and compatible with a wide range of restorative procedures, including dental fillings, crowns, and veneers.

There is a global trend towards minimally invasive dentistry focused on preserving as much healthy tooth structure as possible while treating dental issues. This approach aims to minimize the removal of healthy tooth structure, reduce patient discomfort, and improve the long-term prognosis of dental treatments.

Dental matrix systems enable dentists to perform various dental restorative procedures with greater accuracy, efficiency, and success, thereby contributing to the market growth.

Adequate training and education for healthcare professionals on the use of dental matrix are essential for their effective and safe utilization. Manufacturers are investing in training programs, workshops, and educational initiatives to ensure proper adoption and maximize the benefits of these devices.

Dental Matrix Systems Sales (2015 to 2022) vs Forecast Outlook (2023 to 2033)

The global market for dental matrix systems was around 10.1% of the overall USD 2.2 Billion of the global restorative materials market in 2022.

Advances in dental matrix systems have improved their accuracy and ease of use. Sectional matrix systems have gained popularity due to their ability to provide excellent anatomical shaping and tight interproximal contacts in Class II composite restorations, contributing to market growth.

Patients who are pleased with their aesthetically acceptable restorations are more likely to refer others to the same dental clinic. This word-of-mouth promotion generates demand for dental matrices among dental professionals who want to match the aesthetic demands of their patients.

Dental matrix systems play a crucial role in enabling minimally invasive dentistry by allowing surgeons to minimize the removal of healthy tooth structure, reduce patient discomfort, and improve the long-term prognosis of dental treatments suture internally without the need for large incisions.

The growing preference for these procedures has boosted the demand for dental matrix systems.

Owed to the above factors, the global dental matrix systems market is projected to grow at CAGR of 6.2% in forecasted period.

Opportunities for Growth in the Global Dental Matrix Systems Industry

The rural population in some countries is often deprived of advanced medical techniques. There is an opportunity to educate this population pool and help them understand the necessity of oral hygiene and dental care.

Such approaches will create a chance for the market to grow even in those areas where the impact is low. This could be achieved by several approaches, one of which is communication through telehealth.

It would help support patients as well as address their needs and provide a chance to promote advanced products such as smart dental devices that are currently holding a better market position.

Cost-effective dental matrix products allow dental professionals to offer aesthetic restorations at a more affordable price. This accessibility attracts more patients seeking improved dental aesthetics, leading to an increased demand for dental matrix products.

The development of cost-effective and innovative dental matrices can be integrated into digital dentistry workflows, allowing for precise digital impressions and CAD/CAM fabrication.

This integration enhances the accuracy and efficiency of restorations, promoting superior aesthetic results. As healthcare infrastructure improves and economic conditions develop, the market for dental matrix systems in these regions is likely to expand.

Restraints Affecting the Demand for Dental Matrix Systems

Acquiring CAD/CAM equipment, such as intraoral scanners, design software, milling machines, and 3D printers, can be expensive. Smaller dental clinics or those on tight budgets may find it difficult to make such a large investment.

While digital dentistry has the potential to reduce material waste, the cost of CAD/CAM materials like blocks and milling discs can be higher than traditional restorative materials used with traditional dental matrices.

Dentists may select restorative materials and treatments based on dental matrix reimbursement rates.

Dentists may choose other materials if reimbursement for dental matrices is lower or does not match their actual costs, which affects demand for dental matrices. Uncertain reimbursement policies can create challenges for market growth.

Compliance with regulatory standards comes at a high cost to manufacturers. These costs can include clinical investigations, product testing, maintaining the quality management system, and ongoing compliance monitoring, potentially impacting market growth.

Country-wise Insights into Dental Matrix Systems Usage

Why is USA a Prominent Market for Dental Matrix Systems in North America Region?

The USA occupies 26.9% of market share in 2022 globally. In the United States, there is a high demand for minimally invasive dentistry. Increasing tendency toward minimally invasive dentistry, and dental matrix systems are critical instruments in this strategy.

Further, dentists are increasingly using treatments that retain better tooth structure during restorative procedures.

The United States boasts one of the world's major dentistry industries. There is a high demand for dental matrix systems to support restorative operations because to the large number of dental practices, clinics, and dental professionals. As a result, the United States has emerged as the leading market for dental matrix systems in North America.

What Makes Japan a Highly Lucrative Market for Dental Matrix Systems?

Japan is the second leading country within East Asia. The dental matrix systems market in Japan is set to grow at a high CAGR of 7.2% over the forecast period.

Japan is at the forefront of healthcare technological developments. The country places a high priority on research and development, which has resulted in the development of new dental matrix systems with sophisticated features. Japan is on the cutting edge of incorporating digital technologies into dentistry.

This involves the use of CAD/CAM systems, intraoral scanners, and 3D printing technologies, which are frequently combined with dental matrix systems to provide exact restorations.

What Makes the China a Large Market for Dental Matrix Systems?

In 2022, the China held a significant share in the East Asia dental matrix systems market and contributed around USD 15.8 Million.

The Chinese government has taken steps to improve healthcare services, particularly dental treatment. Subsidies or incentives for dental clinics to invest in new dental technologies, such as dental matrix systems, may be included in these efforts.

China has established dental product regulatory guidelines, including dental matrix systems. Dental producers must adhere to these quality standards in order to ensure the safety and efficacy of their products, providing dentists and patients confidence in their use.

Dental Matrix Systems Market by Product Type, Material, Application, End User, and Distribution Channel

Which Matrix is Predicted to Expand Rapidly Between 2023 and 2033?

By matrices, sectional dental matrix systems held 57.7% market share in world in 2022.

Sectional matrix systems are extremely adaptable and can be employed in a variety of restorative treatments, particularly Class II composite restorations.

They are appropriate for a wide range of tooth sizes and shapes, making them useful in a variety of therapeutic circumstances. Sectional matrices are simple to use and manipulate. Dentists save chairside time by quickly placing and adjusting the matrices for efficient restorations.

Which Material is Predicted to Expand Rapidly Between 2023 and 2033?

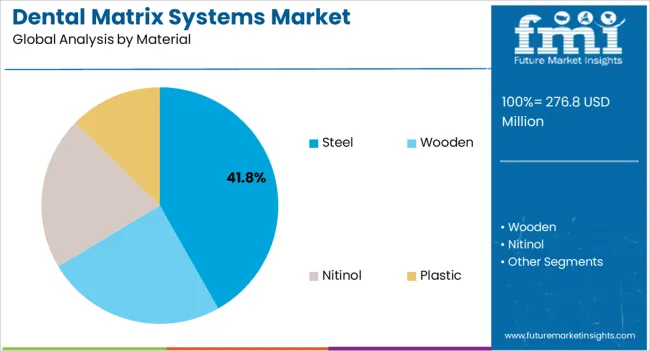
By material, steel held 46.5% market share in world in 2022. Steel dental matrices are flexible enough to adapt to different tooth shapes and sizes, allowing for versatility in their application. They can be shaped and adjusted to fit various clinical scenarios.

Steel dental matrices can be sterilized and reused multiple times, which adds to their cost-effectiveness. Proper sterilization procedures ensure that the dental matrix systems remains safe for use on different patients.

Which Application Utilizes Dental Matrix Systems the Most?

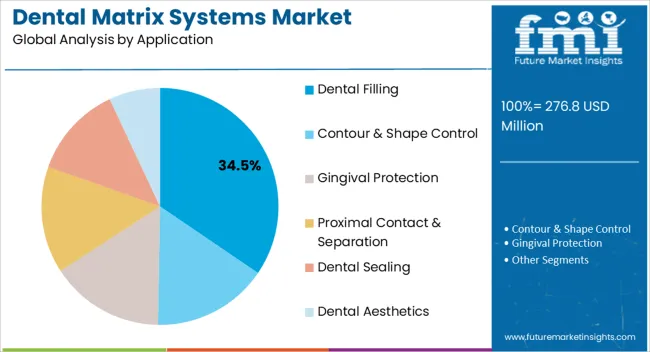
The market value of dental filling is USD 62.3 Million, representing a sizable 26.8% market share in 2022. Achieving proper marginal adaptation (fit) of the filling material to the tooth is crucial for preventing micro leakage and recurrent decay. The dental matrix systems ensures that the filling material is confined within the prepared cavity and does not extend beyond the tooth's margins.

The matrix system helps in controlling the flow and placement of the filling material, ensuring it is properly condensed and compacted to achieve maximum strength and longevity of the restoration.

Which Distribution Channel is Benefiting the Global Market?

The dental clinics have a considerable presence in the dental matrix systems market, accounting for 34.8% value share in 2022, and exhibiting a high CAGR of 5.2% over the forecast period. Dental clinics are prominent users of dental matrix systems.

These devices are commonly used in various surgical procedures performed within clinic settings, including dental fillings, gingival protection, dental sealing and dental aesthetic. As dental clinics strive to provide advanced medical care and meet patient needs, the demand for dental matrix systems is growing.
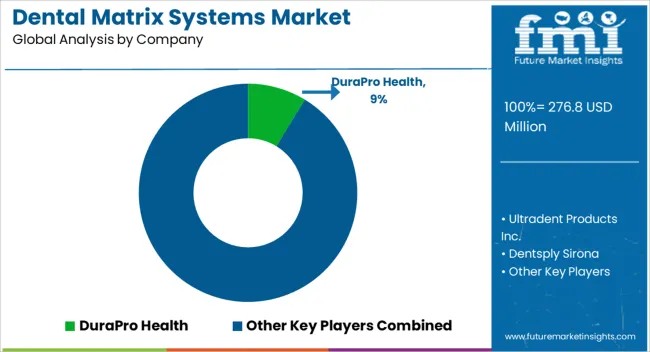
Competitive Landscape of the Dental Matrix Systems Industry

With several players manufacturing dental matrix systems, market has become highly competitive. To gain market share and edge over others, players are undertaking initiatives like acquisition of competitor firms and collaboration with healthcare institutes to develop innovative product lines

  • In June 2023, Premier Dental introduces the Two Striper® Pro Pack, which is tailored to address individual procedural needs. Each of the four Two Striper® Pro Packs has five of the most often utilized diamond shapes for each treatment.
  • In July 2020, Splatter Guard, an innovative new prophy angle from Young Innovations, lowers splatter by up to 15 times* when compared to typical prophy angles.

Similarly, recent developments related to the companies manufacturing the dental matrix systems have been tracked by the team at Future Market Insights, which are available in the full report.

Scope of the Global Dental Matrix Systems Market Report

Attribute Details
Forecast Period 2023 to 2033
Historical Data Available for 2015 to 2022
Market Analysis USD Million for Value, Units for Volume
Key Regions Covered North America; Latin America; Western Europe; Eastern Europe; South Asia & Pacific; East Asia; Central Asia; Russia & Belarus; Balkan & Baltic Countries and Middle East and Africa (MEA)
Key Countries Covered USA, Canada, Brazil, Mexico, Argentina, Peru, Chile, Columbia, China, Japan, South Korea, India, Indonesia, Philippines, Thailand, Malaysia, Vietnam, Australia & New Zealand, Germany, France, Spain, Italy, BENELUX, Nordic Countries, UK, Poland, Hungary, Romania, Czech Republic, GCC Countries, Türkiye, Northern Africa, South Africa, Israel and Kingdom of Saudi Arabia
Key Market Segments Covered Matrices, Material, Application, Distribution Channel and Region
Key Companies Profiled DuraPro Health; Ultradent Products Inc.; Dentsply Sirona; Safco Dental Supply LLC; Garrison Dental Solutions, LLC.; Premier Dental Co.; Young Innovations, Inc.; Medicom; Zest Dental Solutions; Pac-Dent, Inc.; Henry Schein Inc.; Clinician's Choice Dental Products Inc.
Report Coverage Market Forecast, Competition Intelligence, DROT Analysis, Market Dynamics and Challenges, Strategic Growth Initiatives
Pricing Available upon Request

Key Segments Covered in the Dental Matrix Systems Industry Research

By Matrices:

  • Sectional Dental Matrix Systems
    • Universal Rings
    • Matrix Bands
    • Anatomical Wedges
  • Circumferential Dental Matrix Systems
    • Wide Circumferential Dental Matrix
    • Narrow Circumferential Dental Matrix
  • Custom Dental Matrix Systems

By Material:

  • Steel
  • Wooden
  • Nitinol
  • Plastic

By Application:

  • Dental Filling
  • Contour & Shape Control
  • Gingival Protection
  • Proximal Contact & Separation
  • Dental Sealing
  • Dental Aesthetics

By Distribution Channel:

  • Hospitals
  • Dental Clinics
  • Group Dental Practices
  • Ambulatory Surgical Centres
  • Online Sales
    • Manufacturer's Website
    • Aggregator's Website

By Region:

  • North America
  • Latin America
  • East Asia
  • South Asia & Pacific
  • Western Europe
  • Eastern Europe
  • Central Asia
  • Russia & Belarus
  • Balkan & Baltic Countries
  • Middle East & Africa

Table of Content

  • 1. Executive Summary
  • 2. Market Overview
  • 3. Key Market Trends
  • 4. Value-Added Insights
  • 5. Market Background
  • 6. Global Market Demand (in Volume Units) Analysis 2015 to 2022 and Forecast, 2023 to 2033
  • 7. Global Market - Pricing Assessment
  • 8. Global Market Demand (in Value or Size in USD Million) Analysis 2015 to 2022 and Forecast, 2023 to 2033
  • 9. Global Market Analysis 2015 to 2022 and Forecast 2023 to 2033, By Matrices
    • 9.1. Sectional Dental Matrix Systems
      • 9.1.1. Universal Rings
      • 9.1.2. Matrix Bands
      • 9.1.3. Anatomical Wedges
    • 9.2. Circumferential Dental Matrix System
      • 9.2.1. Wide Circumferential Matrix
      • 9.2.2. Narrow Circumferential Matrix
    • 9.3. Custom Dental Matrix Systems
  • 10. Global Market Analysis 2015 to 2022 and Forecast 2023 to 2033, By Materials
    • 10.1. Steel
    • 10.2. Wooden
    • 10.3. Nitinol
    • 10.4. Plastic
  • 11. Global Market Analysis 2015 to 2022 and Forecast 2023 to 2033, By Application
    • 11.1. Dental Filling
    • 11.2. Contour & Shape Control
    • 11.3. Gingival Protection
    • 11.4. Proximal Contact & Separation
    • 11.5. Dental Sealing
    • 11.6. Dental Aesthetics
  • 12. Global Market Analysis 2015 to 2022 and Forecast 2023 to 2033, By Distribution Channel
    • 12.1. Hospitals
    • 12.2. Dental Clinics
    • 12.3. Group Dental Practices
    • 12.4. Ambulatory Surgical Centers
    • 12.5. Online Sales
      • 12.5.1. Manufacturers Websites
      • 12.5.2. Aggregator’s Websites
  • 13. Global Market Analysis 2015 to 2022 and Forecast 2023 to 2033, By Region
    • 13.1. North America
    • 13.2. Latin America
    • 13.3. East Asia
    • 13.4. South Asia & Pacific
    • 13.5. Western Europe
    • 13.6. Eastern Europe
    • 13.7. Central Asia
    • 13.8. Russia & Belarus
    • 13.9. Balkan & Baltic Countries
    • 13.10. Middle East & Africa
  • 14. North America Market Analysis 2015 to 2022 and Forecast 2023 to 2033
  • 15. Latin America Market Analysis 2015 to 2022 and Forecast 2023 to 2033
  • 16. Western Europe Market Analysis 2015 to 2022 and Forecast 2023 to 2033
  • 17. Eastern Europe Market Analysis 2015 to 2022 and Forecast 2023 to 2033
  • 18. East Asia Market Analysis 2015 to 2022 and Forecast 2023 to 2033
  • 19. South Asia & Pacific Market Analysis 2015 to 2022 and Forecast 2023 to 2033
  • 20. Central Asia Market Analysis 2015 to 2022 and Forecast 2023 to 2033
  • 21. Russia & Belarus Market Analysis 2015 to 2022 and Forecast 2023 to 2033
  • 22. Balkan & Baltic Countries Market Analysis 2015 to 2022 and Forecast 2023 to 2033
  • 23. Middle East & Africa Market Analysis 2015 to 2022 and Forecast 2023 to 2033
  • 24. Market Structure Analysis
  • 25. Competition Analysis
    • 25.1. DuraPro Health
    • 25.2. Ultradent Products Inc.
    • 25.3. Dentsply Sirona
    • 25.4. Safco Dental Supply LLC
    • 25.5. Garrison Dental Solutions, LLC.
    • 25.6. Premier Dental Co.
    • 25.7. Young Innovations, Inc
    • 25.8. Medicom
    • 25.9. Zest Dental Solutions
    • 25.10. Pac-Dent, Inc.
    • 25.11. Henry Schein Inc.
    • 25.12. Clinician's Choice Dental Products Inc.
    • 25.13. 3M Company
    • 25.14. GC America Inc.
    • 25.15. Bioclear Matrix Systems
    • 25.16. Water Pik, Inc.
    • 25.17. Kerr Corporation
    • 25.18. SuperEndo
    • 25.19. TDV Dental Ltda.
    • 25.20. Polydentia SA
    • 25.21. Medistock
    • 25.22. Directa AB
    • 25.23. ITENA
    • 25.24. Garrison Dental Solutions
    • 25.25. Dr. Walser Dental GmbH
    • 25.26. ROGINDENTAL LLC
    • 25.27. Huanghua Promisee Dental Co., Ltd
    • 25.28. Osakadent Co., Ltd.
    • 25.29. Dentech Corporation
    • 25.30. Filaydent
    • 25.31. Navadha Enterprises
  • 26. Assumptions and Acronyms Used
  • 27. Research Methodology

List of Tables

Table 01: Global Market Volume (Units) Analysis, By Matrices, 2015 to 2022

Table 02: Global Market Volume (Units) Analysis, By Matrices, 2023 to 2033

Table 03: Global Market Value (US$ Million) Analysis, By Matrices, 2015 to 2022

Table 04: Global Market Value (US$ Million) Analysis, By Matrices, 2023 to 2033

Table 05: Global Market Value (US$ Million) Analysis, By Material, 2015 to 2022

Table 06: Global Market Value (US$ Million) Analysis, By Material, 2023 to 2033

Table 07: Global Market Value (US$ Million) Analysis, By Application, 2015 to 2022

Table 08: Global Market Value (US$ Million) Analysis, By Application, 2023 to 2033

Table 09: Global Market Value (US$ Million) Analysis, By Distribution Channel, 2015 to 2022

Table 10: Global Market Value (US$ Million) Analysis, By Distribution Channel, 2023 to 2033

Table 11: Global Market Value (US$ Million) Analysis, By Region, 2015 to 2022

Table 12: Global Market Value (US$ Million) Analysis, By Region, 2023 to 2033

Table 13: North America Market Value (US$ Million) Analysis, By Matrices, 2015 to 2022

Table 14: North America Market Value (US$ Million) Analysis, By Matrices, 2023 to 2033

Table 15: North America Market Volume (Units) Analysis, By Matrices, 2015 to 2022

Table 16: North America Market Volume (Units) Analysis, By Matrices, 2023 to 2033

Table 17: North America Market Value (US$ Million) Analysis, By Material, 2015 to 2022

Table 18: North America Market Value (US$ Million) Analysis, By Material, 2023 to 2033

Table 19: North America Market Value (US$ Million) Analysis, By Application, 2015 to 2022

Table 20: North America Market Value (US$ Million) Analysis, By Application, 2023 to 2033

Table 21: North America Market Value (US$ Million) Analysis, By Distributional Channel, 2015 to 2022

Table 22: North America Market Value (US$ Million) Analysis, By Distributional Channel, 2023 to 2033

Table 23: North America Market Value (US$ Million) Analysis, By Country, 2015 to 2022

Table 24: North America Market Value (US$ Million) Analysis, By Country, 2023 to 2033

Table 25: Latin America Market Value (US$ Million) Analysis, By Matrices, 2015 to 2022

Table 26: Latin America Market Value (US$ Million) Analysis, By Matrices, 2023 to 2033

Table 27: Latin America Market Volume (Units) Analysis, By Matrices, 2015 to 2022

Table 28: Latin America Market Volume (Units) Analysis, By Matrices, 2023 to 2033

Table 29: Latin America Market Value (US$ Million) Analysis, By Material, 2015 to 2022

Table 30: Latin America Market Value (US$ Million) Analysis, By Material, 2023 to 2033

Table 31: Latin America Market Value (US$ Million) Analysis, By Application, 2015 to 2022

Table 32: Latin America Market Value (US$ Million) Analysis, By Application, 2023 to 2033

Table 33: Latin America Market Value (US$ Million) Analysis, By Distributional Channel, 2015 to 2022

Table 34: Latin America Market Value (US$ Million) Analysis, By Distributional Channel, 2023 to 2033

Table 35: Latin America Market Value (US$ Million) Analysis, By Country, 2015 to 2022

Table 36: Latin America Market Value (US$ Million) Analysis, By Country, 2023 to 2033

Table 37: Western Europe Market Value (US$ Million) Analysis, By Matrices, 2015 to 2022

Table 38: Western Europe Market Value (US$ Million) Analysis, By Matrices, 2023 to 2033

Table 39: Western Europe Market Volume (Units) Analysis, By Matrices, 2015 to 2022

Table 40: Western Europe Market Volume (Units) Analysis, By Matrices, 2023 to 2033

Table 41: Western Europe Market Value (US$ Million) Analysis, By Material, 2015 to 2022

Table 42: Western Europe Market Value (US$ Million) Analysis, By Material, 2023 to 2033

Table 43: Western Europe Market Value (US$ Million) Analysis, By Application, 2015 to 2022

Table 44: Western Europe Market Value (US$ Million) Analysis, By Application, 2023 to 2033

Table 45: Western Europe Market Value (US$ Million) Analysis, By Distributional Channel, 2015 to 2022

Table 46: Western Europe Market Value (US$ Million) Analysis, By Distributional Channel, 2023 to 2033

Table 47: Western Europe Market Value (US$ Million) Analysis, By Country, 2015 to 2022

Table 48: Western Europe Market Value (US$ Million) Analysis, By Country, 2023 to 2033

Table 49: Eastern Europe Market Value (US$ Million) Analysis, By Matrices, 2015 to 2022

Table 50: Eastern Europe Market Value (US$ Million) Analysis, By Matrices, 2023 to 2033

Table 51: Eastern Europe Market Volume (Units) Analysis, By Matrices, 2015 to 2022

Table 52: Eastern Europe Market Volume (Units) Analysis, By Matrices, 2023 to 2033

Table 53: Eastern Europe Market Value (US$ Million) Analysis, By Material, 2015 to 2022

Table 54: Eastern Europe Market Value (US$ Million) Analysis, By Material, 2023 to 2033

Table 55: Eastern Europe Market Value (US$ Million) Analysis, By Application, 2015 to 2022

Table 56: Eastern Europe Market Value (US$ Million) Analysis, By Application, 2023 to 2033

Table 57: Eastern Europe Market Value (US$ Million) Analysis, By Distributional Channel, 2015 to 2022

Table 58: Eastern Europe Market Value (US$ Million) Analysis, By Distributional Channel, 2023 to 2033

Table 59: Eastern Europe Market Value (US$ Million) Analysis, By Country, 2015 to 2022

Table 60: Eastern Europe Market Value (US$ Million) Analysis, By Country, 2023 to 2033

Table 61: East Asia Market Value (US$ Million) Analysis, By Matrices, 2015 to 2022

Table 62: East Asia Market Value (US$ Million) Analysis, By Matrices, 2023 to 2033

Table 63: East Asia Market Volume (Units) Analysis, By Matrices, 2015 to 2022

Table 64: East Asia Market Volume (Units) Analysis, By Matrices, 2023 to 2033

Table 65: East Asia Market Value (US$ Million) Analysis, By Material, 2015 to 2022

Table 66: East Asia Market Value (US$ Million) Analysis, By Material, 2023 to 2033

Table 67: East Asia Market Value (US$ Million) Analysis, By Application, 2015 to 2022

Table 68: East Asia Market Value (US$ Million) Analysis, By Application, 2023 to 2033

Table 69: East Asia Market Value (US$ Million) Analysis, By Distributional Channel, 2015 to 2022

Table 70: East Asia Market Value (US$ Million) Analysis, By Distributional Channel, 2023 to 2033

Table 71: East Asia Market Value (US$ Million) Analysis, By Country, 2015 to 2022

Table 72: East Asia Market Value (US$ Million) Analysis, By Country, 2023 to 2033

Table 73: South Asia & Pacific Market Value (US$ Million) Analysis, By Matrices, 2015 to 2022

Table 74: South Asia & Pacific Market Value (US$ Million) Analysis, By Matrices, 2023 to 2033

Table 75: South Asia & Pacific Market Volume (Units) Analysis, By Matrices, 2015 to 2022

Table 76: South Asia & Pacific Market Volume (Units) Analysis, By Matrices, 2023 to 2033

Table 77: South Asia & Pacific Market Value (US$ Million) Analysis, By Material, 2015 to 2022

Table 78: South Asia & Pacific Market Value (US$ Million) Analysis, By Material, 2023 to 2033

Table 79: South Asia & Pacific Market Value (US$ Million) Analysis, By Application, 2015 to 2022

Table 80: South Asia & Pacific Market Value (US$ Million) Analysis, By Application, 2023 to 2033

Table 81: South Asia & Pacific Market Value (US$ Million) Analysis, By Distributional Channel, 2015 to 2022

Table 82: South Asia & Pacific Market Value (US$ Million) Analysis, By Distributional Channel, 2023 to 2033

Table 83: South Asia & Pacific Market Value (US$ Million) Analysis, By Country, 2015 to 2022

Table 84: South Asia & Pacific Market Value (US$ Million) Analysis, By Country, 2023 to 2033

Table 85: Central Asia Market Value (US$ Million) Analysis, By Matrices, 2015 to 2022

Table 86: Central Asia Market Value (US$ Million) Analysis, By Matrices, 2023 to 2033

Table 87: Central Asia Market Volume (Units) Analysis, By Matrices, 2015 to 2022

Table 88: Central Asia Market Volume (Units) Analysis, By Matrices, 2023 to 2033

Table 89: Central Asia Market Value (US$ Million) Analysis, By Material, 2015 to 2022

Table 90: Central Asia Market Value (US$ Million) Analysis, By Material, 2023 to 2033

Table 91: Central Asia Market Value (US$ Million) Analysis, By Application, 2015 to 2022

Table 92: Central Asia Market Value (US$ Million) Analysis, By Application, 2023 to 2033

Table 93: Central Asia Market Value (US$ Million) Analysis, By Distributional Channel, 2015 to 2022

Table 94: Central Asia Market Value (US$ Million) Analysis, By Distributional Channel, 2023 to 2033

Table 95: Russia & Belarus Market Value (US$ Million) Analysis, By Matrices, 2015 to 2022

Table 96: Russia & Belarus Market Value (US$ Million) Analysis, By Matrices, 2023 to 2033

Table 97: Russia & Belarus Market Volume (Units) Analysis, By Matrices, 2015 to 2022

Table 98: Russia & Belarus Market Volume (Units) Analysis, By Matrices, 2023 to 2033

Table 99: Russia & Belarus Market Value (US$ Million) Analysis, By Material, 2015 to 2022

Table 100: Russia & Belarus Market Value (US$ Million) Analysis, By Material, 2023 to 2033

Table 101: Russia & Belarus Market Value (US$ Million) Analysis, By Application, 2015 to 2022

Table 102: Russia & Belarus Market Value (US$ Million) Analysis, By Application, 2023 to 2033

Table 103: Russia & Belarus Market Value (US$ Million) Analysis, By Distributional Channel, 2015 to 2022

Table 104: Russia & Belarus Market Value (US$ Million) Analysis, By Distributional Channel, 2023 to 2033

Table 105: Balkan & Baltic Countries Market Value (US$ Million) Analysis, By Matrices, 2015 to 2022

Table 106: Balkan & Baltic Countries Market Value (US$ Million) Analysis, By Matrices, 2023 to 2033

Table 107: Balkan & Baltic Countries Market Volume (Units) Analysis, By Matrices, 2015 to 2022

Table 108: Balkan & Baltic Countries Market Volume (Units) Analysis, By Matrices, 2023 to 2033

Table 109: Balkan & Baltic Countries Market Value (US$ Million) Analysis, By Material, 2015 to 2022

Table 110: Balkan & Baltic Countries Market Value (US$ Million) Analysis, By Material, 2023 to 2033

Table 111: Balkan & Baltic Countries Market Value (US$ Million) Analysis, By Application, 2015 to 2022

Table 112: Balkan & Baltic Countries Market Value (US$ Million) Analysis, By Application, 2023 to 2033

Table 113: Balkan & Baltic Countries Market Value (US$ Million) Analysis, By Distributional Channel, 2015 to 2022

Table 114: Balkan & Baltic Countries Market Value (US$ Million) Analysis, By Distributional Channel, 2023 to 2033

Table 115: Middle East & Africa Market Value (US$ Million) Analysis, By Matrices, 2015 to 2022

Table 116: Middle East & Africa Market Value (US$ Million) Analysis, By Matrices, 2023 to 2033

Table 117: Middle East & Africa Market Volume (Units) Analysis, By Matrices, 2015 to 2022

Table 118: Middle East & Africa Market Volume (Units) Analysis, By Matrices, 2023 to 2033

Table 119: Middle East & Africa Market Value (US$ Million) Analysis, By Material, 2015 to 2022

Table 120: Middle East & Africa Market Value (US$ Million) Analysis, By Material, 2023 to 2033

Table 121: Middle East & Africa Market Value (US$ Million) Analysis, By Application, 2015 to 2022

Table 122: Middle East & Africa Market Value (US$ Million) Analysis, By Application, 2023 to 2033

Table 123: Middle East & Africa Market Value (US$ Million) Analysis, By Distributional Channel, 2015 to 2022

Table 124: Middle East & Africa Market Value (US$ Million) Analysis, By Distributional Channel, 2023 to 2033

Table 125: Middle East & Africa Market Value (US$ Million) Analysis, By Country, 2015 to 2022

Table 126: Middle East & Africa Market Value (US$ Million) Analysis, By Country, 2023 to 2033

List of Figures

Figure 01: Global Market Split by Region, 2023 (E)

Figure 02: Global Market Split by Matrices, 2023 (E)

Figure 03: Global Market Split by Material, 2023 (E)

Figure 04: Global Market Split by Application, 2023 (E)

Figure 05: Global Market Split by Distribution Channel, 2023 (E)

Figure 06: Global Market Historical Volume (Units) Analysis, 2015 to 2022

Figure 07: Global Market and Future Volume (Units), 2023 to 2033 & Y-o-Y Growth Trend Analysis

Figure 08: Global Market Value (US$ Million) Analysis, 2015 to 2022

Figure 09: Global Market Value (US$ Million), 2023 to 2033 & Y-o-Y Growth Trend Analysis

Figure 10: Global Market Absolute $ Opportunity, 2023 to 2033

Figure 11: Global Market Share Analysis (%), By Matrices, 2023 & 2033

Figure 12: Global Market Y-o-Y Analysis (%), By Matrices, 2023 to 2033

Figure 13: Market Attractiveness Analysis by Matrices, 2023 to 2033

Figure 14: Global Market Share Analysis (%), By Material, 2023 & 2033

Figure 15: Global Market Y-o-Y Analysis (%), By Material, 2023 to 2033

Figure 16: Market Attractiveness Analysis by Material, 2023 to 2033

Figure 17: Global Market Share Analysis (%), By Application, 2023 & 2033

Figure 18: Global Market Y-o-Y Analysis (%), By Application, 2023 to 2033

Figure 19: Market Attractiveness Analysis by Application, 2023 to 2033

Figure 20: Global Market Share Analysis (%), By Distribution Channel, 2023 & 2033

Figure 21: Global Market Y-o-Y Analysis (%), By Distribution Channel, 2023 to 2033

Figure 22: Market Attractiveness Analysis by Distribution Channel, 2023 to 2033

Figure 23: Global Market Share Analysis (%), By Region, 2023 & 2033

Figure 24: Global Market Y-o-Y Analysis (%), By Region, 2023 to 2033

Figure 25: Market Attractiveness Analysis by Region, 2023 to 2033

Figure 26: North America Market Share Analysis (%), By Matrices, 2023 (E)

Figure 27: North America Market Share Analysis (%), By Material, 2023 (E)

Figure 28: North America Market Share Analysis (%), By Application, 2023 (E)

Figure 29: North America Market Share Analysis (%), By Distribution Channel, 2023 (E)

Figure 30: North America Market Share Analysis (%), By Country, 2023 (E)

Figure 31: North America Market Value (US$ Million) Analysis, 2015 to 2022

Figure 32: North America Market Value (US$ Million) Analysis, 2023 to 2033 & Y-o-Y Growth Trend Analysis

Figure 33: North America Market Share Analysis (%), By Matrices, 2023 (E)

Figure 34: North America Market Share Analysis (%), Material, 2023 (E)

Figure 35: North America Market Share Analysis (%), By Application, 2023 (E)

Figure 36: North America Market Share Analysis (%), Distributional Channel, 2023 (E)

Figure 37: North America Market Share Analysis (%), Country, 2023 (E)

Figure 38: USA. Market Share Analysis (%) by Matrices, 2022 & 2033

Figure 39: USA. Market Share Analysis (%) by Material, 2022 & 2033

Figure 40: USA. Market Share Analysis (%) by Application, 2022 & 2033

Figure 41: USA. Market Share Analysis (%) by Distributional Channel, 2022 & 2033

Figure 42: Canada Market Share Analysis (%) by Matrices, 2022 & 2033

Figure 43: Canada Market Share Analysis (%) by Material, 2022 & 2033

Figure 44: Canada Market Share Analysis (%) by Application, 2022 & 2033

Figure 45: Canada Market Share Analysis (%) by Distributional Channel, 2022 & 2033

Figure 46: Latin America Market Share Analysis (%), By Matrices, 2023 (E)

Figure 47: Latin America Market Share Analysis (%), By Material, 2023 (E)

Figure 48: Latin America Market Share Analysis (%), By Application, 2023 (E)

Figure 49: Latin America Market Share Analysis (%), By Distribution Channel, 2023 (E)

Figure 50: Latin America Market Share Analysis (%), By Country, 2023 (E)

Figure 51: Latin America Market Value (US$ Million) Analysis, 2015 to 2022

Figure 52: Latin America Market Value (US$ Million), 2023 to 2033 & Y-o-Y Growth Trend Analysis

Figure 53: Latin America Market Share Analysis (%), By Matrices, 2023 (E)

Figure 54: Latin America Market Share Analysis (%), Material, 2023 (E)

Figure 55: Latin America Market Share Analysis (%), By Application, 2023 (E)

Figure 56: Latin America Market Share Analysis (%), Distributional Channel, 2023 (E)

Figure 57: Latin America Market Share Analysis (%), Country, 2023 (E)

Figure 58: Brazil Market Share Analysis (%) by Matrices, 2022 & 2033

Figure 59: Brazil Market Share Analysis (%) by Material, 2022 & 2033

Figure 60: Brazil Market Share Analysis (%) by Application, 2022 & 2033

Figure 61: Brazil Market Share Analysis (%) by Distributional Channel, 2022 & 2033

Figure 62: Mexico Market Share Analysis (%) by Matrices, 2022 & 2033

Figure 63: Mexico Market Share Analysis (%) by Material, 2022 & 2033

Figure 64: Mexico Market Share Analysis (%) by Application, 2022 & 2033

Figure 65: Mexico Market Share Analysis (%) by Distributional Channel, 2022 & 2033

Figure 66: Argentina Market Share Analysis (%) by Matrices, 2022 & 2033

Figure 67: Argentina Market Share Analysis (%) by Material, 2022 & 2033

Figure 68: Argentina Market Share Analysis (%) by Application, 2022 & 2033

Figure 69: Argentina Market Share Analysis (%) by Distributional Channel, 2022 & 2033

Figure 70: Peru Market Share Analysis (%) by Matrices, 2022 & 2033

Figure 71: Peru Market Share Analysis (%) by Material, 2022 & 2033

Figure 72: Peru Market Share Analysis (%) by Application, 2022 & 2033

Figure 73: Peru Market Share Analysis (%) by Distributional Channel, 2022 & 2033

Figure 74: Chile Market Share Analysis (%) by Matrices, 2022 & 2033

Figure 75: Chile Market Share Analysis (%) by Material, 2022 & 2033

Figure 76: Chile Market Share Analysis (%) by Application, 2022 & 2033

Figure 77: Chile Market Share Analysis (%) by Distributional Channel, 2022 & 2033

Figure 78: Columbia Market Share Analysis (%) by Matrices, 2022 & 2033

Figure 79: Columbia Market Share Analysis (%) by Material, 2022 & 2033

Figure 80: Columbia Market Share Analysis (%) by Application, 2022 & 2033

Figure 81: Columbia Market Share Analysis (%) by Distributional Channel, 2022 & 2033

Figure 82: Western Europe Market (US$ Million) Analysis, 2018 to 2022

Figure 83: Western Europe Market Value (US$) & Y-o-Y Growth (%), 2023 to 2033

Figure 84: Western Europe Market Share Analysis (%), By Matrices, 2023 (E)

Figure 85: Western Europe Market Share Analysis (%), By Material, 2023 (E)

Figure 86: Western Europe Market Share Analysis (%), By Application, 2023 (E)

Figure 87: Western Europe Market Share Analysis (%), By Distribution Channel, 2023 (E)

Figure 88: Western Europe Market Share Analysis (%), By Country, 2023 (E)

Figure 89: Western Europe Market Share Analysis (%), By Matrices, 2023 (E)

Figure 90: Western Europe Market Share Analysis (%), Material, 2023 (E)

Figure 91: Western Europe Market Share Analysis (%), By Application, 2023 (E)

Figure 92: Western Europe Market Share Analysis (%), Distributional Channel, 2023 (E)

Figure 93: Western Europe Market Share Analysis (%), Country, 2023 (E)

Figure 94: Germany Market Share Analysis (%) by Matrices, 2022 & 2033

Figure 95: Germany Market Share Analysis (%) by Material, 2022 & 2033

Figure 96: Germany Market Share Analysis (%) by Application, 2022 & 2033

Figure 97: Germany Market Share Analysis (%) by Distributional Channel, 2022 & 2033

Figure 98: France Market Share Analysis (%) by Matrices, 2022 & 2033

Figure 99: France Market Share Analysis (%) by Material, 2022 & 2033

Figure 100: France Market Share Analysis (%) by Application, 2022 & 2033

Figure 101: France Market Share Analysis (%) by Distributional Channel, 2022 & 2033

Figure 102: Spain Market Share Analysis (%) by Matrices, 2022 & 2033

Figure 103: Spain Market Share Analysis (%) by Material, 2022 & 2033

Figure 104: Spain Market Share Analysis (%) by Application, 2022 & 2033

Figure 105: Spain Market Share Analysis (%) by Distributional Channel, 2022 & 2033

Figure 106: Italy Market Share Analysis (%) by Matrices, 2022 & 2033

Figure 107: Italy Market Share Analysis (%) by Material, 2022 & 2033

Figure 108: Italy Market Share Analysis (%) by Application, 2022 & 2033

Figure 109: Italy Market Share Analysis (%) by Distributional Channel, 2022 & 2033

Figure 110: BENELUX Market Share Analysis (%) by Matrices, 2022 & 2033

Figure 111: BENELUX Market Share Analysis (%) by Material, 2022 & 2033

Figure 112: BENELUX Market Share Analysis (%) by Application, 2022 & 2033

Figure 113: BENELUX Market Share Analysis (%) by Distributional Channel, 2022 & 2033

Figure 114: Nordic Countries Market Share Analysis (%) by Matrices, 2022 & 2033

Figure 115: Nordic Countries Market Share Analysis (%) by Material, 2022 & 2033

Figure 116: Nordic Countries Market Share Analysis (%) by Application, 2022 & 2033

Figure 117: Nordic Countries Market Share Analysis (%) by Distributional Channel, 2022 & 2033

Figure 118: UK Market Share Analysis (%) by Matrices, 2022 & 2033

Figure 119: UK Market Share Analysis (%) by Material, 2022 & 2033

Figure 120: UK Market Share Analysis (%) by Application, 2022 & 2033

Figure 121: UK Market Share Analysis (%) by Distributional Channel, 2022 & 2033

Figure 122: Eastern Europe Market (US$ Million) Analysis, 2018 to 2022

Figure 123: Eastern Europe Market Value (US$) & Y-o-Y Growth (%), 2023 to 2033

Figure 124: Eastern Europe Market Share Analysis (%), By Matrices, 2023 (E)

Figure 125: Eastern Europe Market Share Analysis (%), By Material, 2023 (E)

Figure 126: Eastern Europe Market Share Analysis (%), By Application, 2023 (E)

Figure 127: Eastern Europe Market Share Analysis (%), By Distribution Channel, 2023 (E)

Figure 128: Eastern Europe Market Share Analysis (%), By Country, 2023 (E)

Figure 129: Eastern Europe Market Share Analysis (%), By Matrices, 2023 (E)

Figure 130: Eastern Europe Market Share Analysis (%), Material, 2023 (E)

Figure 131: Eastern Europe Market Share Analysis (%), By Application, 2023 (E)

Figure 132: Eastern Europe Market Share Analysis (%), Distributional Channel, 2023 (E)

Figure 133: Eastern Europe Market Share Analysis (%), Country, 2023 (E)

Figure 134: Poland Market Share Analysis (%) by Matrices, 2022 & 2033

Figure 135: Poland Market Share Analysis (%) by Material, 2022 & 2033

Figure 136: Poland Market Share Analysis (%) by Application, 2022 & 2033

Figure 137: Poland Market Share Analysis (%) by Distributional Channel, 2022 & 2033

Figure 138: Hungary Market Share Analysis (%) by Matrices, 2022 & 2033

Figure 139: Hungary Market Share Analysis (%) by Material, 2022 & 2033

Figure 140: Hungary Market Share Analysis (%) by Application, 2022 & 2033

Figure 141: Hungary Market Share Analysis (%) by Distributional Channel, 2022 & 2033

Figure 142: Romania Market Share Analysis (%) by Matrices, 2022 & 2033

Figure 143: Romania Market Share Analysis (%) by Material, 2022 & 2033

Figure 144: Romania Market Share Analysis (%) by Application, 2022 & 2033

Figure 145: Romania Market Share Analysis (%) by Distributional Channel, 2022 & 2033

Figure 146: Czech Republic Market Share Analysis (%) by Matrices, 2022 & 2033

Figure 147: Czech Republic Market Share Analysis (%) by Material, 2022 & 2033

Figure 148: Czech Republic Market Share Analysis (%) by Application, 2022 & 2033

Figure 149: Czech Republic Market Share Analysis (%) by Distributional Channel, 2022 & 2033

Figure 150: East Asia Market Share Analysis (%), By Matrices, 2023 (E)

Figure 151: East Asia Market Share Analysis (%), By Material, 2023 (E)

Figure 152: East Asia Market Share Analysis (%), By Application, 2023 (E)

Figure 153: East Asia Market Share Analysis (%), By Distribution Channel, 2023 (E)

Figure 154: East Asia Market Share Analysis (%), By Country, 2023 (E)

Figure 155: East Asia Market Value (US$ Million) Analysis, 2015 to 2022

Figure 156: East Asia Market Value (US$ Million), 2023 to 2033 & Y-o-Y Growth Trend Analysis

Figure 157: East Asia Market Share Analysis (%), By Matrices, 2023 (E)

Figure 158: East Asia Market Share Analysis (%), Material, 2023 (E)

Figure 159: East Asia Market Share Analysis (%), By Application, 2023 (E)

Figure 160: East Asia Market Share Analysis (%), Distributional Channel, 2023 (E)

Figure 161: East Asia Market Share Analysis (%), Country, 2023 (E)

Figure 162: China Market Share Analysis (%) by Matrices, 2022 & 2033

Figure 163: China Market Share Analysis (%) by Material, 2022 & 2033

Figure 164: China Market Share Analysis (%) by Application, 2022 & 2033

Figure 165: China Market Share Analysis (%) by Distributional Channel, 2022 & 2033

Figure 166: Japan Market Share Analysis (%) by Matrices, 2022 & 2033

Figure 167: Japan Market Share Analysis (%) by Material, 2022 & 2033

Figure 168: Japan Market Share Analysis (%) by Application, 2022 & 2033

Figure 169: Japan Market Share Analysis (%) by Distributional Channel, 2022 & 2033

Figure 170: South Korea Market Share Analysis (%) by Matrices, 2022 & 2033

Figure 171: South Korea Market Share Analysis (%) by Material, 2022 & 2033

Figure 172: South Korea Market Share Analysis (%) by Application, 2022 & 2033

Figure 173: South Korea Market Share Analysis (%) by Distributional Channel, 2022 & 2033

Figure 174: South Asia & Pacific Market Share Analysis (%), By Matrices, 2023 (E)

Figure 175: South Asia & Pacific Market Share Analysis (%), By Material, 2023 (E)

Figure 176: South Asia & Pacific Market Share Analysis (%), By Application, 2023 (E)

Figure 177: South Asia & Pacific Market Share Analysis (%), By Distribution Channel, 2023 (E)

Figure 178: South Asia & Pacific Market Share Analysis (%), By Country, 2023 (E)

Figure 179: South Asia & Pacific Market Value (US$ Million) Analysis, 2015 to 2022

Figure 180: South Asia & Pacific Market Value (US$ Million), 2023 to 2033 & Y-o-Y Growth Trend Analysis

Figure 181: South Asia & Pacific Market Share Analysis (%), By Matrices, 2023 (E)

Figure 182: South Asia & Pacific Market Share Analysis (%), Material, 2023 (E)

Figure 183: South Asia & Pacific Market Share Analysis (%), By Application, 2023 (E)

Figure 184: South Asia & Pacific Market Share Analysis (%), Distributional Channel, 2023 (E)

Figure 185: South Asia & Pacific Market Share Analysis (%), Country, 2023 (E)

Figure 186: India Market Share Analysis (%) by Matrices, 2022 & 2033

Figure 187: India Market Share Analysis (%) by Material, 2022 & 2033

Figure 188: India Market Share Analysis (%) by Application, 2022 & 2033

Figure 189: India Market Share Analysis (%) by Distributional Channel, 2022 & 2033

Figure 190: Indonesia Market Share Analysis (%) by Matrices, 2022 & 2033

Figure 191: Indonesia Market Share Analysis (%) by Material, 2022 & 2033

Figure 192: Indonesia Market Share Analysis (%) by Application, 2022 & 2033

Figure 193: Indonesia Market Share Analysis (%) by Distributional Channel, 2022 & 2033

Figure 194: Philippines Market Share Analysis (%) by Matrices, 2022 & 2033

Figure 195: Philippines Market Share Analysis (%) by Material, 2022 & 2033

Figure 196: Philippines Market Share Analysis (%) by Application, 2022 & 2033

Figure 197: Philippines Market Share Analysis (%) by Distributional Channel, 2022 & 2033

Figure 198: Thailand Market Share Analysis (%) by Matrices, 2022 & 2033

Figure 199: Thailand Market Share Analysis (%) by Material, 2022 & 2033

Figure 200: Thailand Market Share Analysis (%) by Application, 2022 & 2033

Figure 201: Thailand Market Share Analysis (%) by Distributional Channel, 2022 & 2033

Figure 202: Malaysia Market Share Analysis (%) by Matrices, 2022 & 2033

Figure 203: Malaysia Market Share Analysis (%) by Material, 2022 & 2033

Figure 204: Malaysia Market Share Analysis (%) by Application, 2022 & 2033

Figure 205: Malaysia Market Share Analysis (%) by Distributional Channel, 2022 & 2033

Figure 206: Vietnam Market Share Analysis (%) by Matrices, 2022 & 2033

Figure 207: Vietnam Market Share Analysis (%) by Material, 2022 & 2033

Figure 208: Vietnam Market Share Analysis (%) by Application, 2022 & 2033

Figure 209: Vietnam Market Share Analysis (%) by Distributional Channel, 2022 & 2033

Figure 210: Australia & New Zealand Market Share Analysis (%) by Matrices, 2022 & 2033

Figure 211: Australia & New Zealand Market Share Analysis (%) by Material, 2022 & 2033

Figure 212: Australia & New Zealand Market Share Analysis (%) by Application, 2022 & 2033

Figure 213: Australia & New Zealand Market Share Analysis (%) by Distributional Channel, 2022 & 2033

Figure 214: Central Asia Market (US$ Million) Analysis, 2018 to 2022

Figure 215: Central Asia Market Value (US$) & Y-o-Y Growth (%), 2023 to 2033

Figure 216: Central Asia Market Share Analysis (%), By Matrices, 2023 (E)

Figure 217: Central Asia Market Share Analysis (%), By Material, 2023 (E)

Figure 218: Central Asia Market Share Analysis (%), By Application, 2023 (E)

Figure 219: Central Asia Market Share Analysis (%), By Distribution Channel, 2023 (E)

Figure 220: Central Asia Market Share Analysis (%), By Matrices, 2023 (E)

Figure 221: Central Asia Market Share Analysis (%), Material, 2023 (E)

Figure 222: Central Asia Market Share Analysis (%), By Application, 2023 (E)

Figure 223: Central Asia Market Share Analysis (%), Distributional Channel, 2023 (E)

Figure 224: Russia & Belarus Market (US$ Million) Analysis, 2018 to 2022

Figure 225: Russia & Belarus Market Value (US$) & Y-o-Y Growth (%), 2023 to 2033

Figure 226: Russia & Belarus Market Share Analysis (%), By Matrices, 2023 (E)

Figure 227: Russia & Belarus Market Share Analysis (%), By Material, 2023 (E)

Figure 228: Russia & Belarus Market Share Analysis (%), By Application, 2023 (E)

Figure 229: Russia & Belarus Market Share Analysis (%), By Distribution Channel, 2023 (E)

Figure 230: Russia & Belarus Market Share Analysis (%), By Matrices, 2023 (E)

Figure 231: Russia & Belarus Market Share Analysis (%), Material, 2023 (E)

Figure 232: Russia & Belarus Market Share Analysis (%), By Application, 2023 (E)

Figure 233: Russia & Belarus Market Share Analysis (%), Distributional Channel, 2023 (E)

Figure 234: Balkan & Baltic Countries Market (US$ Million) Analysis, 2018 to 2022

Figure 235: Balkan & Baltic Countries Market Value (US$) & Y-o-Y Growth (%), 2023 to 2033

Figure 236: Balkan & Baltic Countries Market Share Analysis (%), By Matrices, 2023 (E)

Figure 237: Balkan & Baltic Countries Market Share Analysis (%), By Material, 2023 (E)

Figure 238: Balkan & Baltic Countries Market Share Analysis (%), By Application, 2023 (E)

Figure 239: Balkan & Baltic Countries Market Share Analysis (%), By Distribution Channel, 2023 (E)

Figure 240: Balkan & Baltic Countries Market Share Analysis (%), By Matrices, 2023 (E)

Figure 241: Balkan & Baltic Countries Market Share Analysis (%), Material, 2023 (E)

Figure 242: Balkan & Baltic Countries Market Share Analysis (%), By Application, 2023 (E)

Figure 243: Balkan & Baltic Countries Market Share Analysis (%), Distributional Channel, 2023 (E)

Figure 244: Middle East & Africa Market (US$ Million) Analysis, 2018 to 2022

Figure 245: Middle East & Africa Market Value (US$) & Y-o-Y Growth (%), 2023 to 2033

Figure 246: Middle East & Africa Market Share Analysis (%), By Matrices, 2023 (E)

Figure 247: Middle East & Africa Market Share Analysis (%), By Material, 2023 (E)

Figure 248: Middle East & Africa Market Share Analysis (%), By Application, 2023 (E)

Figure 249: Middle East & Africa Market Share Analysis (%), By Distribution Channel, 2023 (E)

Figure 250: Middle East & Africa Market Share Analysis (%), By Country, 2023 (E)

Figure 251: Middle East & Africa Market Share Analysis (%), By Matrices, 2023 (E)

Figure 252: Middle East & Africa Market Share Analysis (%), Material, 2023 (E)

Figure 253: Middle East & Africa Market Share Analysis (%), By Application, 2023 (E)

Figure 254: Middle East & Africa Market Share Analysis (%), Distributional Channel, 2023 (E)

Figure 255: Middle East & Africa Market Share Analysis (%), Country, 2023 (E)

Figure 256: GCC Countries Market Share Analysis (%) by Matrices, 2022 & 2033

Figure 257: GCC Countries Market Share Analysis (%) by Material, 2022 & 2033

Figure 258: GCC Countries Market Share Analysis (%) by Application, 2022 & 2033

Figure 259: GCC Countries Market Share Analysis (%) by Distributional Channel, 2022 & 2033

Figure 260: Türkiye Market Share Analysis (%) by Matrices, 2022 & 2033

Figure 261: Türkiye Market Share Analysis (%) by Material, 2022 & 2033

Figure 262: Türkiye Market Share Analysis (%) by Application, 2022 & 2033

Figure 263: Türkiye Market Share Analysis (%) by Distributional Channel, 2022 & 2033

Figure 264: Northern Africa Market Share Analysis (%) by Matrices, 2022 & 2033

Figure 265: Northern Africa Market Share Analysis (%) by Material, 2022 & 2033

Figure 266: Northern Africa Market Share Analysis (%) by Application, 2022 & 2033

Figure 267: Northern Africa Market Share Analysis (%) by Distributional Channel, 2022 & 2033

Figure 268: South Africa Market Share Analysis (%) by Matrices, 2022 & 2033

Figure 269: South Africa Market Share Analysis (%) by Material, 2022 & 2033

Figure 270: South Africa Market Share Analysis (%) by Application, 2022 & 2033

Figure 271: South Africa Market Share Analysis (%) by Distributional Channel, 2022 & 2033

Figure 272: Israel Market Share Analysis (%) by Matrices, 2022 & 2033

Figure 273: Israel Market Share Analysis (%) by Material, 2022 & 2033

Figure 274: Israel Market Share Analysis (%) by Application, 2022 & 2033

Figure 275: Israel Market Share Analysis (%) by Distributional Channel, 2022 & 2033

Figure 276: Kingdom of Saudi Arabia Market Share Analysis (%) by Matrices, 2022 & 2033

Figure 277: Kingdom of Saudi Arabia Market Share Analysis (%) by Material, 2022 & 2033

Figure 278: Kingdom of Saudi Arabia Market Share Analysis (%) by Application, 2022 & 2033

Figure 279: Kingdom of Saudi Arabia Market Share Analysis (%) by Distributional Channel, 2022 & 2033

Frequently Asked Questions

Which industry is the key consumer of dental matrix systems?

The primary consumer for dental matrix systems is the dental industry.

How much can the dental matrix systems market grow by 2033 in North America?

North America is poised to stay attractive, projecting a USD 100 million by 2033.

What is the current market valuation of the dental matrix systems market?

The market is estimated to secure a valuation of USD 232.5 million in 2023.

How big will the dental matrix systems market be by 2033?

The market is estimated to reach USD 449.0 million by 2033.

Which end-use industry holds lucrative opportunities in the dental matrix systems market?

The dental clinics and hospitals sector holds high revenue potential in the dental matrix systems market.

Explore Similar Insights

Future Market Insights

Dental Matrix Systems Market