Reports

- Global Locations -

Headquarters

Future Market Insights, Inc.

Christiana Corporate, 200
Continental Drive, Suite 401,
Newark, Delaware - 19713,
United States

T: +1-845-579-5705

Americas

Future Market Insights, Inc.

616 Corporate Way, Suite 2-9018,
Valley Cottage, NY 10989, United States

T: +1-347-918-3531

MEA

Future Market Insights

1602-6 Jumeirah Bay X2 Tower, Plot No: JLT-PH2-X2A,
Jumeirah Lakes Towers, Dubai,
United Arab Emirates

Europe

Future Market Insights

3rd Floor, 207 Regent Street,
W1B 3HH London
United Kingdom

T: + 44 (0) 20 8123 9659
D: +44 (0) 20 3287 4268

Asia Pacific

Future Market Insights

IndiaLand Global Tech Park, Unit UG-1, Behind Grand HighStreet, Phase 1, Hinjawadi, MH, Pune – 411057, India

Dental Chairs Market Outlook (2022-2032)

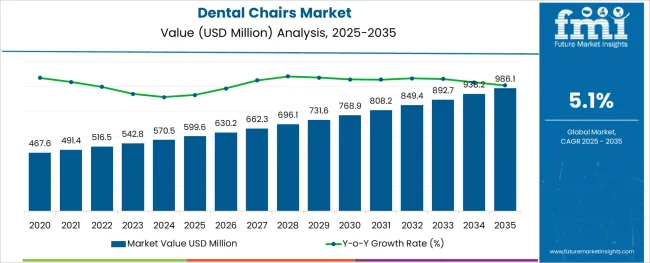
[250 Pages Report] The global market for Dental Chairs, which was anticipated to be worth US$ 516.5 Million in 2022, is expected to rise to US$ 851 Million by 2032, at a CAGR of 5.1% throughout the analyzed period. The increased number of dental procedures, especially surgeries related to oral aesthetics, is one of the key forces driving the dental equipment market, including dental chairs.

Attributes Details
Global Dental Chair Market Size (2021A) US$ 491.7 Million
Global Dental Chair Market Forecast Value (2032F) US$ 851 Million
Global Dental Chair Market Growth Rate (2022 to 2032) 5.1% CAGR
USA Dental Chair Market Share 34%
Top 2 Dental Chairs Manufacturers’ Market Share 40%
Key Companies Profiled
  • Austin Dental Equipment Company (A-Dec, Inc.)
  • Midmar
  • Craftsmaster Contour Equipment, Inc.
  • XO CARE A/S
  • Sirona
  • Henry Schein, Inc.
  • Danaher Corporation
  • PLANMECA OY
  • Patterson Dental Supply, Inc.
  • Straumann

Don't pay for what you don't need

Customize your report by selecting specific countries or regions and save 30%!

Dental Chairs Consumption Analysis (2017-2021) Vs. Market Outlook (2022-2032)

As per the latest industry analysis by Future Market Insights, a market research and competitive intelligence provider, global Dental Chairs consumption over the past half-decade increased at a CAGR of around 4.9%. The Dental Chair Market was valued at roughly US$ 405 Mn in 2017, and it is expected to grow at a rate of around 5.1% from 2022 to 2032.

The use of Dentist Chairs has grown in popularity with the advancement in technology. The contemporary dental chairs have unrivaled features that allow both the doctor and the patient to operate and relax comfortably during the procedure. Dual-position touchpad controls on both sides of the top backrest have recently been added for convenient access. The dual touchpad controllers include the choice of a unit-mounted touchpad, wireless foot control, and a remote wireless touchpad. As more sophisticated features become available, the dental chairs demand is projected to grow.

Periodontal disease, often known as gum disease, is a prevalent dental issue in the elderly. According to the United Nations, there were 703 Mn people aged 65 and more in 2019, with the number expected to quadruple to 1.5 Bn by 2050. The growing senior population is predicted to boost demand for dental chairs for periodontal and gum disease diagnosis and treatment.

What is driving the Global Market for Dental Chairs?

The dental equipment market size is expected to expand at a swift pace. Furthermore, expanding healthcare infrastructure is expected to contribute to market development during the projection period. Because of the COVID-19 epidemic, several dental procedures had to be rescheduled, thus lowering the businesses' revenue.

The increased need for patient comfort during treatments is driving the product demand, consequently triggering the growth of the dental chair market. As a consequence, significant developments in dental chairs are being made in order to provide patients with the most comfort possible during operations. Dental Chairs, as well as the placement of the light, may now be customized to match the requirements of both the patient and the surgeon.

The increase in the incidence of oral issues is expected to assist company development in the forthcoming years. Oral health issues are among the most frequent noncommunicable illnesses, impacting a sizable proportion of the global population. The greater acceptance of poor food habits, poor brushing practices, smoking, and fluoride exposure may all contribute to the rising incidence of these illnesses. Furthermore, many people across the globe, especially in developing nations, have untreated oral health concerns. The epidemiology and usefulness of oral treatment are of national relevance in several nations.

Besides, in the years to come the demand for portable dental chairs is expected to surge. Sales of portable dental chairs is being driven by the surge in requirement for flexibility in work procedures. Alongside, the growing number of elongated dental procedures has led to the surge in demand for dental assistant chairs and dental stools.

Sabyasachi Ghosh
Sabyasachi Ghosh

Principal Consultant

Talk to Analyst

Find your sweet spots for generating winning opportunities in this market.

What are the Key Challenges Faced by Dental Chair Manufacturers?

COVID-19 patients and emergency services were the only ones who could access healthcare services and staff, influencing elective medical operations. Dentistry was one of the healthcare activities affected due to its elective nature, and certain dental procedures were suspended. Public organizations such as the American Dental Association (ADA), Centers for Disease Control and Prevention (CDC), and the British Dental Association, among others, developed guidelines.

These guidelines and recommendations are concentrated on only dealing with emergency surgeries and postponing non-emergent medical treatments, which impeded the acceptance of dental Chairs and the growth of the sector in the early phases of the pandemic.

According to research studies, there has been a considerable decrease in patient volume in dental offices throughout the globe. Due to enforced constraints and limitations, dentistry faced an unprecedented problem in offering elective dental care. In the United States, the majority of states restricted visits to dental clinics by deferring elective operations and only offering access to emergency care.
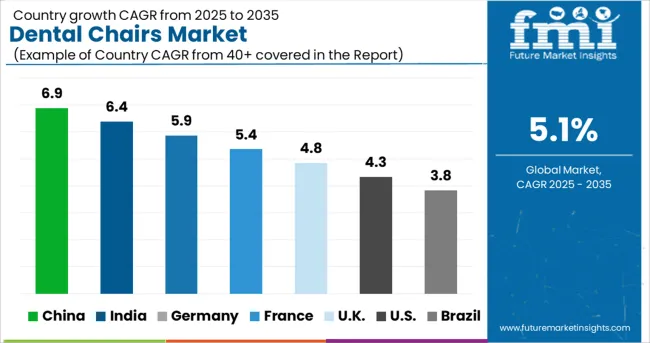
Country Wise Analysis

Which Region Dominated Dental Chairs Market?

North America dominated the dental chairs market with a revenue share of more than 35.0% in 2021, owing to increased demand for dental chairs due to the strong consumer knowledge about the efficacy of the therapeutic application with dedicated dental chairs. Furthermore, growth in the number of dental practitioners and clinics is predicted to boost the business in the U.S. Increased partnerships and collaborations among key market players are further expected to drive industry development.

The market in Asia Pacific is expected to rise at a rapid pace during the projected period, owing to growing awareness of oral health and an increase in the number of cosmetic procedures. During the projected period, the adoption of technology such as CAD/CAM for dental restoration techniques is likely to promote market development.

Get the data you need at a Fraction of the cost

Personalize your report by choosing insights you need
and save 40%!

Category Wise Analysis

Which Dental Chairs Type is the Getting Utmost Traction?

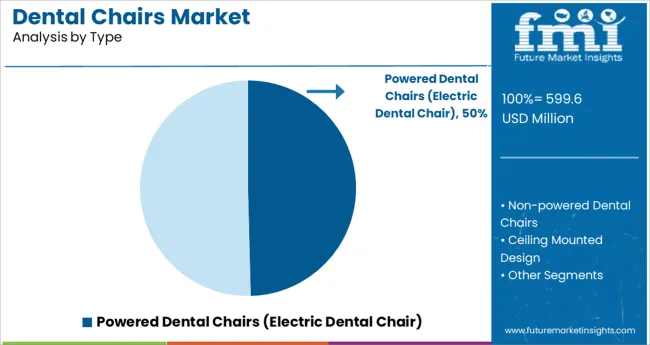
The ceiling-mounted design accounted for almost 35% of total dental chair market, in 2021. It can be attributed to its ability to reduce neck strain caused by prolonged durations of looking down on patients. Its features, such as dental cuspidors, dental handpieces, and a dental chair light, make them an appropriate option. Such advantages and benefits are projected to boost the segment's growth.

Due to the benefits of dental chair-mounted design, such as increased mobility and ease of maintenance, the category is expected to develop significantly throughout the projected period. These chairs are comfortable and make work simpler and more efficient, therefore its popularity is expected to grow. Besides, the demand for powered dental chairs is also on rise.

Which Application of Dental Chairs Market Generates the Most Revenue?

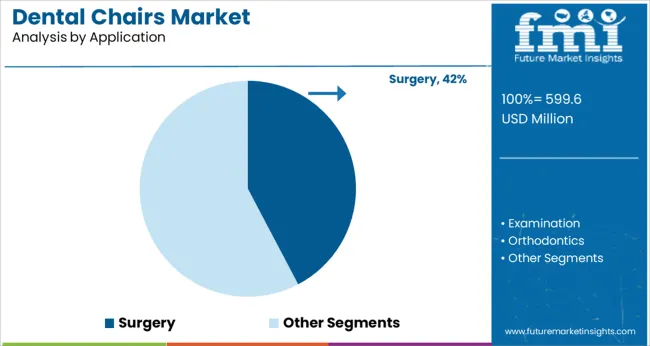
The demand for dental chairs for examination and treatment is expected to surge in the forthcoming years. Due to the improved oral hygiene awareness, the examination application earned the largest value share of more than 25% in 2021. According to the Academy of Implant Dentistry, by the year 2025, more than 30 Mn Americans will be missing all of their teeth in at least one jaw. Many individuals suffer from poor oral health. Dental disorders are growing more widespread, needing more diagnosis and treatment, which increases demand for dental Chairs, accelerating the segment's growth.

Besides, dental chair demand through cosmetic procedures is also gaining significant traction. The high need for cosmetic dental surgery, along with increased aesthetic awareness, is likely to drive demand for cosmetic dental procedures, propelling the market ahead.
Competition Landscape

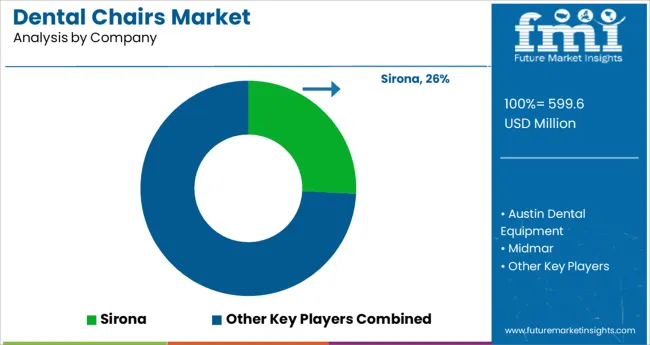
The global dental chairs market is fragmented and tremendously competitive for major competitors. To retain their positions, key market actors are emphasizing the quality of their products while releasing new things more often.

Existing technology advancements, product development and launches, and public awareness campaigns all contribute to a more competitive climate. Some of the most well-known players in the global dental Chairs industry are as follows: Austin Dental Equipment Company (A-Dec, Inc.), Midmark, Craftsmaster Contour Equipment, Inc., XO CARE A/S, and Sirona are among the companies involved.

  • In June 2019, A-dec, announced the launch of the A-dec 500 dental chair brand. The company's customer base is expected to increase as a result of the launch.

Key Segments Covered in Dental Chairs Industry Survey

Dental Chairs Market by Type:

  • Powered Dental Chairs (Electric Dental Chair)
  • Non-powered Dental Chairs
  • Ceiling Mounted Design
  • Mobile Dental Chair
  • Dental Chair-Mounted Design

Dental Chairs Market by Application:

  • Examination
  • Surgery
  • Orthodontics
  • Other Applications

Dental Chairs Market by Region:

  • North America
  • Europe
  • Asia Pacific
  • Middle East & Africa
  • South America

Frequently Asked Questions

How much is the current worth of the Dental Chairs market?

Currently, the global Dental Chairs market is valued at US$ 491.7 Mn.

At what CAGR is demand for Dental Chairs expected to rise?

Dental Chairs consumption value is expected to increase at a CAGR of around 5.1% during the period of 2022-2032.

How has the Dental Chairs market performed over the past half-decade?

In terms of consumption value, Dental Chairs increased at a CAGR of around 4.9% during 2017-2021.

How are key players strategizing in the market for Dental Chairs?

Key Dental Chairs suppliers can be mainly seen involved in innovation and R&D along with production capacity expansion.

Who are the prominent manufacturers of Dental Chairs?

Top dental chair companies are Austin Dental Equipment Company (A-Dec, Inc.), Midmar, Craftsmaster Contour Equipment, Inc., XO CARE A/S, and Sirona.

What is the scenario for the demand of Dental Chairs in US?

U.S. is estimated to hold around 20% share of the global Dental Chairs market.

What is the scenario for demand of Dental Chairs in the UK?

Sales of dental chairs in UK is expected to grow at a CAGR of 7% during 2022 - 2032.

Table of Content

1. Executive Summary

    1.1. Global Market Outlook

    1.2. Demand-side Trends

    1.3. Supply-side Trends

    1.4. Technology Roadmap Analysis

    1.5. Analysis and Recommendations

2. Market Overview

    2.1. Market Coverage / Taxonomy

    2.2. Market Definition / Scope / Limitations

3. Market Background

    3.1. Market Dynamics

        3.1.1. Drivers

        3.1.2. Restraints

        3.1.3. Opportunity 

        3.1.4. Trends

    3.2. Scenario Forecast

        3.2.1. Demand in Optimistic Scenario

        3.2.2. Demand in Likely Scenario

        3.2.3. Demand in Conservative Scenario

    3.3. Opportunity Map Analysis

    3.4. Investment Feasibility Matrix

    3.5. PESTLE and Porter’s Analysis

    3.6. Regulatory Landscape

        3.6.1. By Key Regions

        3.6.2. By Key Countries

4. Global Market Analysis 2017-2021 and Forecast, 2022-2032

    4.1. Historical Market Size Value (US$ Mn) Analysis, 2017-2021

    4.2. Current and Future Market Size Value (US$ Mn) Projections, 2022-2032

        4.2.1. Y-o-Y Growth Trend Analysis

        4.2.2. Absolute $ Opportunity Analysis

5. Global Market Analysis 2017-2021 and Forecast 2022-2032, By Type

    5.1. Introduction / Key Findings

    5.2. Historical Market Size Value (US$ Mn) Analysis By Type, 2017-2021

    5.3. Current and Future Market Size Value (US$ Mn) Analysis and Forecast By Type, 2022-2032

        5.3.1. Powered Dental Chairs

        5.3.2. Non-Powered Dental Chairs

            5.3.2.1. Ceiling Mounted Design

            5.3.2.2. Mobile Dental Chair

            5.3.2.3. Dental Chair Mounted Design

    5.4. Y-o-Y Growth Trend Analysis By Type, 2017-2021

    5.5. Absolute $ Opportunity Analysis By Type, 2022-2032

6. Global Market Analysis 2017-2021 and Forecast 2022-2032, By Application

    6.1. Introduction / Key Findings

    6.2. Historical Market Size Value (US$ Mn) Analysis By Application, 2017-2021

    6.3. Current and Future Market Size Value (US$ Mn) Analysis and Forecast By Application, 2022-2032

        6.3.1. Examination

        6.3.2. Surgery

        6.3.3. Orthodontics

        6.3.4. Other Applications

    6.4. Y-o-Y Growth Trend Analysis By Application, 2017-2021

    6.5. Absolute $ Opportunity Analysis By Application, 2022-2032

7. Global Market Analysis 2017-2021 and Forecast 2022-2032, By Region

    7.1. Introduction

    7.2. Historical Market Size Value (US$ Mn) Analysis By Region, 2017-2021

    7.3. Current Market Size Value (US$ Mn) Analysis and Forecast By Region, 2022-2032

        7.3.1. North America

        7.3.2. Latin America

        7.3.3. Europe

        7.3.4. Asia Pacific

        7.3.5. MEA

    7.4. Market Attractiveness Analysis By Region

8. North America Market Analysis 2017-2021 and Forecast 2022-2032, By Country

    8.1. Historical Market Size Value (US$ Mn) Trend Analysis By Market Taxonomy, 2017-2021

    8.2. Market Size Value (US$ Mn) Forecast By Market Taxonomy, 2022-2032

        8.2.1. By Country

            8.2.1.1. U.S.

            8.2.1.2. Canada

        8.2.2. By Type

        8.2.3. By Application

    8.3. Market Attractiveness Analysis

        8.3.1. By Country

        8.3.2. By Type

        8.3.3. By Application

    8.4. Key Takeaways

9. Latin America Market Analysis 2017-2021 and Forecast 2022-2032, By Country

    9.1. Historical Market Size Value (US$ Mn) Trend Analysis By Market Taxonomy, 2017-2021

    9.2. Market Size Value (US$ Mn) Forecast By Market Taxonomy, 2022-2032

        9.2.1. By Country

            9.2.1.1. Brazil

            9.2.1.2. Mexico

            9.2.1.3. Rest of Latin America

        9.2.2. By Type

        9.2.3. By Application

    9.3. Market Attractiveness Analysis

        9.3.1. By Country

        9.3.2. By Type

        9.3.3. By Application

    9.4. Key Takeaways

10. Europe Market Analysis 2017-2021 and Forecast 2022-2032, By Country

    10.1. Historical Market Size Value (US$ Mn) Trend Analysis By Market Taxonomy, 2017-2021

    10.2. Market Size Value (US$ Mn) Forecast By Market Taxonomy, 2022-2032

        10.2.1. By Country

            10.2.1.1. Germany

            10.2.1.2. Italy

            10.2.1.3. France

            10.2.1.4. U.K.

            10.2.1.5. Spain

            10.2.1.6. Russia

            10.2.1.7. BENELUX

            10.2.1.8. Rest of Europe

        10.2.2. By Type

        10.2.3. By Application

    10.3. Market Attractiveness Analysis

        10.3.1. By Country

        10.3.2. By Type

        10.3.3. By Application

    10.4. Key Takeaways

11. Asia Pacific Market Analysis 2017-2021 and Forecast 2022-2032, By Country

    11.1. Historical Market Size Value (US$ Mn) Trend Analysis By Market Taxonomy, 2017-2021

    11.2. Market Size Value (US$ Mn) Forecast By Market Taxonomy, 2022-2032

        11.2.1. By Country

            11.2.1.1. China

            11.2.1.2. Japan

            11.2.1.3. South Korea

            11.2.1.4. India

            11.2.1.5. Rest of Asia Pacific

        11.2.2. By Type

        11.2.3. By Application

    11.3. Market Attractiveness Analysis

        11.3.1. By Country

        11.3.2. By Type

        11.3.3. By Application

    11.4. Key Takeaways

12. MEA Market Analysis 2017-2021 and Forecast 2022-2032, By Country

    12.1. Historical Market Size Value (US$ Mn) Trend Analysis By Market Taxonomy, 2017-2021

    12.2. Market Size Value (US$ Mn) Forecast By Market Taxonomy, 2022-2032

        12.2.1. By Country

            12.2.1.1. GCC

            12.2.1.2. Rest of MEA

        12.2.2. By Type

        12.2.3. By Application

    12.3. Market Attractiveness Analysis

        12.3.1. By Country

        12.3.2. By Type

        12.3.3. By Application

    12.4. Key Takeaways

13. Key Countries Market Analysis

    13.1. U.S.

        13.1.1. Pricing Analysis

        13.1.2. Market Share Analysis, 2021

            13.1.2.1. By Type

            13.1.2.2. By Application

    13.2. Canada

        13.2.1. Pricing Analysis

        13.2.2. Market Share Analysis, 2021

            13.2.2.1. By Type

            13.2.2.2. By Application

    13.3. Brazil

        13.3.1. Pricing Analysis

        13.3.2. Market Share Analysis, 2021

            13.3.2.1. By Type

            13.3.2.2. By Application

    13.4. Mexico

        13.4.1. Pricing Analysis

        13.4.2. Market Share Analysis, 2021

            13.4.2.1. By Type

            13.4.2.2. By Application

    13.5. Argentina

        13.5.1. Pricing Analysis

        13.5.2. Market Share Analysis, 2021

            13.5.2.1. By Type

            13.5.2.2. By Application

    13.6. Germany

        13.6.1. Pricing Analysis

        13.6.2. Market Share Analysis, 2021

            13.6.2.1. By Type

            13.6.2.2. By Application

    13.7. Italy

        13.7.1. Pricing Analysis

        13.7.2. Market Share Analysis, 2021

            13.7.2.1. By Type

            13.7.2.2. By Application

    13.8. France

        13.8.1. Pricing Analysis

        13.8.2. Market Share Analysis, 2021

            13.8.2.1. By Type

            13.8.2.2. By Application

    13.9. U.K.

        13.9.1. Pricing Analysis

        13.9.2. Market Share Analysis, 2021

            13.9.2.1. By Type

            13.9.2.2. By Application

    13.10. Spain

        13.10.1. Pricing Analysis

        13.10.2. Market Share Analysis, 2021

            13.10.2.1. By Type

            13.10.2.2. By Application

    13.11. Russia

        13.11.1. Pricing Analysis

        13.11.2. Market Share Analysis, 2021

            13.11.2.1. By Type

            13.11.2.2. By Application

    13.12. BENELUX

        13.12.1. Pricing Analysis

        13.12.2. Market Share Analysis, 2021

            13.12.2.1. By Type

            13.12.2.2. By Application

    13.13. China

        13.13.1. Pricing Analysis

        13.13.2. Market Share Analysis, 2021

            13.13.2.1. By Type

            13.13.2.2. By Application

    13.14. Japan

        13.14.1. Pricing Analysis

        13.14.2. Market Share Analysis, 2021

            13.14.2.1. By Type

            13.14.2.2. By Application

    13.15. South Korea

        13.15.1. Pricing Analysis

        13.15.2. Market Share Analysis, 2021

            13.15.2.1. By Type

            13.15.2.2. By Application

    13.16. India

        13.16.1. Pricing Analysis

        13.16.2. Market Share Analysis, 2021

            13.16.2.1. By Type

            13.16.2.2. By Application

    13.17. GCC Countries

        13.17.1. Pricing Analysis

        13.17.2. Market Share Analysis, 2021

            13.17.2.1. By Type

            13.17.2.2. By Application

14. Market Structure Analysis

    14.1. Competition Dashboard

    14.2. Competition Benchmarking

    14.3. Market Share Analysis of Top Players

        14.3.1. By Regional

        14.3.2. By Type

        14.3.3. By Application

15. Competition Analysis

    15.1. Competition Deep Dive

        15.1.1. Austin Dental Equipment

            15.1.1.1. Overview

            15.1.1.2. Product Portfolio

            15.1.1.3. Profitability by Market Segment

            15.1.1.4. Sales Footprint

            15.1.1.5. Strategy Overview

                15.1.1.5.1. Marketing Strategy

                15.1.1.5.2. Product Strategy

        15.1.2. Midmar

            15.1.2.1. Overview

            15.1.2.2. Product Portfolio

            15.1.2.3. Profitability by Market Segment

            15.1.2.4. Sales Footprint

            15.1.2.5. Strategy Overview

                15.1.2.5.1. Marketing Strategy

                15.1.2.5.2. Product Strategy

        15.1.3. Craftmaster Contour Equipment, Inc.

            15.1.3.1. Overview

            15.1.3.2. Product Portfolio

            15.1.3.3. Profitability by Market Segment

            15.1.3.4. Sales Footprint

            15.1.3.5. Strategy Overview

                15.1.3.5.1. Marketing Strategy

                15.1.3.5.2. Product Strategy

        15.1.4. XO CARE A/S

            15.1.4.1. Overview

            15.1.4.2. Product Portfolio

            15.1.4.3. Profitability by Market Segment

            15.1.4.4. Sales Footprint

            15.1.4.5. Strategy Overview

                15.1.4.5.1. Marketing Strategy

                15.1.4.5.2. Product Strategy

        15.1.5. Sirona

            15.1.5.1. Overview

            15.1.5.2. Product Portfolio

            15.1.5.3. Profitability by Market Segment

            15.1.5.4. Sales Footprint

            15.1.5.5. Strategy Overview

                15.1.5.5.1. Marketing Strategy

                15.1.5.5.2. Product Strategy

        15.1.6. Henry Schein, Inc.

            15.1.6.1. Overview

            15.1.6.2. Product Portfolio

            15.1.6.3. Profitability by Market Segment

            15.1.6.4. Sales Footprint

            15.1.6.5. Strategy Overview

                15.1.6.5.1. Marketing Strategy

                15.1.6.5.2. Product Strategy

        15.1.7. Danaher Corporation

            15.1.7.1. Overview

            15.1.7.2. Product Portfolio

            15.1.7.3. Profitability by Market Segment

            15.1.7.4. Sales Footprint

            15.1.7.5. Strategy Overview

                15.1.7.5.1. Marketing Strategy

                15.1.7.5.2. Product Strategy

        15.1.8. PLANMECA OY

            15.1.8.1. Overview

            15.1.8.2. Product Portfolio

            15.1.8.3. Profitability by Market Segment

            15.1.8.4. Sales Footprint

            15.1.8.5. Strategy Overview

                15.1.8.5.1. Marketing Strategy

                15.1.8.5.2. Product Strategy

        15.1.9. Patterson Dental Supply, Inc.

            15.1.9.1. Overview

            15.1.9.2. Product Portfolio

            15.1.9.3. Profitability by Market Segment

            15.1.9.4. Sales Footprint

            15.1.9.5. Strategy Overview

                15.1.9.5.1. Marketing Strategy

                15.1.9.5.2. Product Strategy

        15.1.10. Starumann

            15.1.10.1. Overview

            15.1.10.2. Product Portfolio

            15.1.10.3. Profitability by Market Segment

            15.1.10.4. Sales Footprint

            15.1.10.5. Strategy Overview

                15.1.10.5.1. Marketing Strategy

                15.1.10.5.2. Product Strategy

16. Assumptions & Acronyms Used

17. Research Methodology

Don't pay for what you don't need

Customize your report by selecting specific countries or regions and save 30%!

List of Tables

Table 1: Global Market Value (US$ Mn) Forecast by Region, 2017-2032

Table 2: Global Market Value (US$ Mn) Forecast by Type, 2017-2032

Table 3: Global Market Value (US$ Mn) Forecast by Application, 2017-2032

Table 4: North America Market Value (US$ Mn) Forecast by Country, 2017-2032

Table 5: North America Market Value (US$ Mn) Forecast by Type, 2017-2032

Table 6: North America Market Value (US$ Mn) Forecast by Application, 2017-2032

Table 7: Latin America Market Value (US$ Mn) Forecast by Country, 2017-2032

Table 8: Latin America Market Value (US$ Mn) Forecast by Type, 2017-2032

Table 9: Latin America Market Value (US$ Mn) Forecast by Application, 2017-2032

Table 10: Europe Market Value (US$ Mn) Forecast by Country, 2017-2032

Table 11: Europe Market Value (US$ Mn) Forecast by Type, 2017-2032

Table 12: Europe Market Value (US$ Mn) Forecast by Application, 2017-2032

Table 13: Asia Pacific Market Value (US$ Mn) Forecast by Country, 2017-2032

Table 14: Asia Pacific Market Value (US$ Mn) Forecast by Type, 2017-2032

Table 15: Asia Pacific Market Value (US$ Mn) Forecast by Application, 2017-2032

Table 16: MEA Market Value (US$ Mn) Forecast by Country, 2017-2032

Table 17: MEA Market Value (US$ Mn) Forecast by Type, 2017-2032

Table 18: MEA Market Value (US$ Mn) Forecast by Application, 2017-2032
Sabyasachi Ghosh
Sabyasachi Ghosh

Principal Consultant

Talk to Analyst

Find your sweet spots for generating winning opportunities in this market.

List of Charts

Figure 1: Global Market Value (US$ Mn) by Type, 2022-2032

Figure 2: Global Market Value (US$ Mn) by Application, 2022-2032

Figure 3: Global Market Value (US$ Mn) by Region, 2022-2032

Figure 4: Global Market Value (US$ Mn) Analysis by Region, 2017-2032

Figure 5: Global Market Value Share (%) and BPS Analysis by Region, 2022-2032

Figure 6: Global Market Y-o-Y Growth (%) Projections by Region, 2022-2032

Figure 7: Global Market Value (US$ Mn) Analysis by Type, 2017-2032

Figure 8: Global Market Value Share (%) and BPS Analysis by Type, 2022-2032

Figure 9: Global Market Y-o-Y Growth (%) Projections by Type, 2022-2032

Figure 10: Global Market Value (US$ Mn) Analysis by Application, 2017-2032

Figure 11: Global Market Value Share (%) and BPS Analysis by Application, 2022-2032

Figure 12: Global Market Y-o-Y Growth (%) Projections by Application, 2022-2032

Figure 13: Global Market Attractiveness by Type, 2022-2032

Figure 14: Global Market Attractiveness by Application, 2022-2032

Figure 15: Global Market Attractiveness by Region, 2022-2032

Figure 16: North America Market Value (US$ Mn) by Type, 2022-2032

Figure 17: North America Market Value (US$ Mn) by Application, 2022-2032

Figure 18: North America Market Value (US$ Mn) by Country, 2022-2032

Figure 19: North America Market Value (US$ Mn) Analysis by Country, 2017-2032

Figure 20: North America Market Value Share (%) and BPS Analysis by Country, 2022-2032

Figure 21: North America Market Y-o-Y Growth (%) Projections by Country, 2022-2032

Figure 22: North America Market Value (US$ Mn) Analysis by Type, 2017-2032

Figure 23: North America Market Value Share (%) and BPS Analysis by Type, 2022-2032

Figure 24: North America Market Y-o-Y Growth (%) Projections by Type, 2022-2032

Figure 25: North America Market Value (US$ Mn) Analysis by Application, 2017-2032

Figure 26: North America Market Value Share (%) and BPS Analysis by Application, 2022-2032

Figure 27: North America Market Y-o-Y Growth (%) Projections by Application, 2022-2032

Figure 28: North America Market Attractiveness by Type, 2022-2032

Figure 29: North America Market Attractiveness by Application, 2022-2032

Figure 30: North America Market Attractiveness by Country, 2022-2032

Figure 31: Latin America Market Value (US$ Mn) by Type, 2022-2032

Figure 32: Latin America Market Value (US$ Mn) by Application, 2022-2032

Figure 33: Latin America Market Value (US$ Mn) by Country, 2022-2032

Figure 34: Latin America Market Value (US$ Mn) Analysis by Country, 2017-2032

Figure 35: Latin America Market Value Share (%) and BPS Analysis by Country, 2022-2032

Figure 36: Latin America Market Y-o-Y Growth (%) Projections by Country, 2022-2032

Figure 37: Latin America Market Value (US$ Mn) Analysis by Type, 2017-2032

Figure 38: Latin America Market Value Share (%) and BPS Analysis by Type, 2022-2032

Figure 39: Latin America Market Y-o-Y Growth (%) Projections by Type, 2022-2032

Figure 40: Latin America Market Value (US$ Mn) Analysis by Application, 2017-2032

Figure 41: Latin America Market Value Share (%) and BPS Analysis by Application, 2022-2032

Figure 42: Latin America Market Y-o-Y Growth (%) Projections by Application, 2022-2032

Figure 43: Latin America Market Attractiveness by Type, 2022-2032

Figure 44: Latin America Market Attractiveness by Application, 2022-2032

Figure 45: Latin America Market Attractiveness by Country, 2022-2032

Figure 46: Europe Market Value (US$ Mn) by Type, 2022-2032

Figure 47: Europe Market Value (US$ Mn) by Application, 2022-2032

Figure 48: Europe Market Value (US$ Mn) by Country, 2022-2032

Figure 49: Europe Market Value (US$ Mn) Analysis by Country, 2017-2032

Figure 50: Europe Market Value Share (%) and BPS Analysis by Country, 2022-2032

Figure 51: Europe Market Y-o-Y Growth (%) Projections by Country, 2022-2032

Figure 52: Europe Market Value (US$ Mn) Analysis by Type, 2017-2032

Figure 53: Europe Market Value Share (%) and BPS Analysis by Type, 2022-2032

Figure 54: Europe Market Y-o-Y Growth (%) Projections by Type, 2022-2032

Figure 55: Europe Market Value (US$ Mn) Analysis by Application, 2017-2032

Figure 56: Europe Market Value Share (%) and BPS Analysis by Application, 2022-2032

Figure 57: Europe Market Y-o-Y Growth (%) Projections by Application, 2022-2032

Figure 58: Europe Market Attractiveness by Type, 2022-2032

Figure 59: Europe Market Attractiveness by Application, 2022-2032

Figure 60: Europe Market Attractiveness by Country, 2022-2032

Figure 61: Asia Pacific Market Value (US$ Mn) by Type, 2022-2032

Figure 62: Asia Pacific Market Value (US$ Mn) by Application, 2022-2032

Figure 63: Asia Pacific Market Value (US$ Mn) by Country, 2022-2032

Figure 64: Asia Pacific Market Value (US$ Mn) Analysis by Country, 2017-2032

Figure 65: Asia Pacific Market Value Share (%) and BPS Analysis by Country, 2022-2032

Figure 66: Asia Pacific Market Y-o-Y Growth (%) Projections by Country, 2022-2032

Figure 67: Asia Pacific Market Value (US$ Mn) Analysis by Type, 2017-2032

Figure 68: Asia Pacific Market Value Share (%) and BPS Analysis by Type, 2022-2032

Figure 69: Asia Pacific Market Y-o-Y Growth (%) Projections by Type, 2022-2032

Figure 70: Asia Pacific Market Value (US$ Mn) Analysis by Application, 2017-2032

Figure 71: Asia Pacific Market Value Share (%) and BPS Analysis by Application, 2022-2032

Figure 72: Asia Pacific Market Y-o-Y Growth (%) Projections by Application, 2022-2032

Figure 73: Asia Pacific Market Attractiveness by Type, 2022-2032

Figure 74: Asia Pacific Market Attractiveness by Application, 2022-2032

Figure 75: Asia Pacific Market Attractiveness by Country, 2022-2032

Figure 76: MEA Market Value (US$ Mn) by Type, 2022-2032

Figure 77: MEA Market Value (US$ Mn) by Application, 2022-2032

Figure 78: MEA Market Value (US$ Mn) by Country, 2022-2032

Figure 79: MEA Market Value (US$ Mn) Analysis by Country, 2017-2032

Figure 80: MEA Market Value Share (%) and BPS Analysis by Country, 2022-2032

Figure 81: MEA Market Y-o-Y Growth (%) Projections by Country, 2022-2032

Figure 82: MEA Market Value (US$ Mn) Analysis by Type, 2017-2032

Figure 83: MEA Market Value Share (%) and BPS Analysis by Type, 2022-2032

Figure 84: MEA Market Y-o-Y Growth (%) Projections by Type, 2022-2032

Figure 85: MEA Market Value (US$ Mn) Analysis by Application, 2017-2032

Figure 86: MEA Market Value Share (%) and BPS Analysis by Application, 2022-2032

Figure 87: MEA Market Y-o-Y Growth (%) Projections by Application, 2022-2032

Figure 88: MEA Market Attractiveness by Type, 2022-2032

Figure 89: MEA Market Attractiveness by Application, 2022-2032

Figure 90: MEA Market Attractiveness by Country, 2022-2032

Recommendations

Healthcare

Dental Imaging Equipment Market

Published : February 2024

Healthcare

Dental Lasers Market

Published : January 2023

Healthcare

Dental Services Market

Published : October 2022

Healthcare

Electric Dental Handpiece Market

Published : July 2022

Explore Healthcare Insights

View Reports