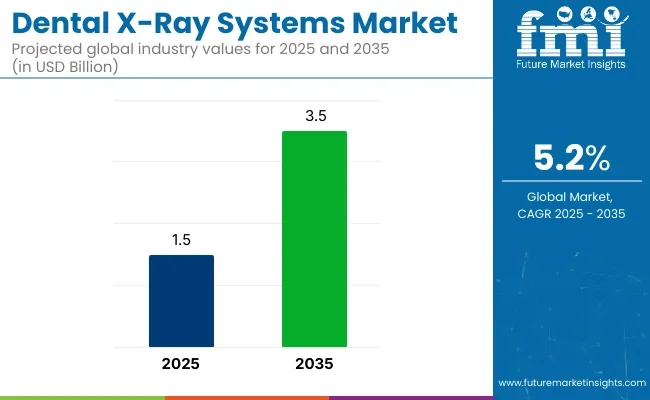
The dental X-ray systems market is projected to be valued at USD 1.5 billion in 2025 and is anticipated to grow to USD 3.5 billion by 2035, registering a compound annual growth rate (CAGR) of 5.2% over the forecast period. Dental X-ray systems are essential for diagnosing dental conditions, planning treatments, and monitoring patient progress. With increasing awareness of oral health and the growing demand for advanced diagnostic tools, the market for dental X-ray systems is expected to grow significantly in the coming years.
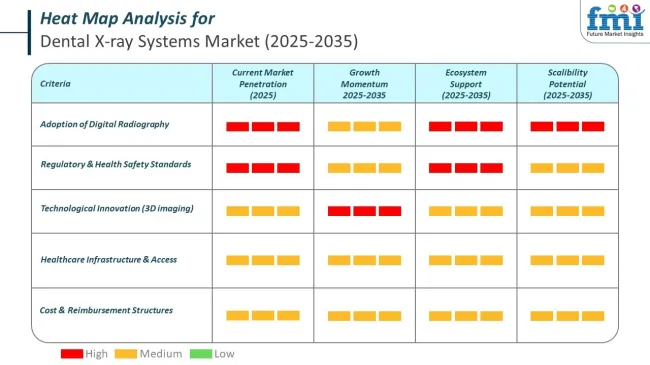
One of the key drivers of this market’s growth is the rise in dental care awareness and the increasing number of people seeking preventive dental services. Regular dental check-ups and early detection of oral diseases, such as cavities, gum disease, and oral cancer, are contributing to the growing demand for dental X-ray systems. Additionally, technological advancements in dental imaging, such as digital X-rays and 3D imaging systems, are enhancing diagnostic accuracy, reducing patient exposure to radiation, and improving the overall patient experience.

Global Dental X-ray Systems Industry Outlook
| Attributes | Key Insights |
|---|---|
| Estimated Size, 2025 | USD 1.5 billion |
| Projected Size, 2035 | USD 3.5 billion |
| Value-based CAGR (2025 to 2035) | 5.2% |
Recent developments in the market highlight the transition from traditional film-based X-rays to digital X-ray systems, which offer faster image acquisition, better image quality, and greater ease of use. These advancements are leading to the widespread adoption of digital dental X-ray systems by dental professionals worldwide.
On May 2, 2024, Dentsply Sirona reported a first-quarter profit of USD 18 million, compared to a loss of USD 19 million a year earlier. However, sales for the quarter dropped by 2.6% to USD 953 million, missing analyst estimates. The company lowered its 2024 revenue forecast to USD 3.91 billion-USD 3.97 billion due to foreign-exchange headwinds. Despite growth in orthodontic and implant units, connected technology and essential dental units experienced sales declines.
As the dental X-ray systems market continues to expand, the increasing emphasis on preventive care, the adoption of digital technologies, and the rising demand for more precise diagnostic tools will drive the market’s growth in the next decade.
Governments have set clear rules to ensure dental X-ray systems are safe, reliable, and effective. These regulations cover device approval, radiation control, and equipment performance. They also include requirements for registration, safety checks, and proper installation. Such standards help protect patients and support the proper use of imaging systems in dental care.

The convergence of dental X-ray systems with intraoral scanners, CAD/CAM platforms, and 3D printing technologies is redefining diagnostic accuracy and treatment planning in restorative and prosthetic dentistry.
A comparative analysis of fluctuations in compound annual growth rate (CAGR) for the dental x-ray systems market between 2024 and 2025 on a six-month basis is shown below. By this examination, major variations in the performance of these markets are brought to light, and also trends of revenue generation are captured hence offering stakeholders useful ideas on how to carry on with the market’s growth path in any other given year. January through June covers the first part of the year called half1 (H1), while half2 (H2) represents July to December.
The table below compares the compound annual growth rate (CAGR) for the global dental x-ray systems market from 2024 to 2025 during the first half of the year. This overview highlights key changes and trends in revenue growth, offering valuable insights into market dynamics. H1 covers January to June, while H2 spans July to December. In the first half (H1) of the decade from 2024 to 2034, the business is predicted to surge at a CAGR of 5.9%, followed by a slightly lower growth rate of 5.6% in the second half (H2) of the same decade.
| Particular | Value CAGR |
|---|---|
| H1 (2024 to 2034) | 5.9% |
| H2 (2024 to 2034) | 5.6% |
| H1 (2025 to 2035) | 5.2% |
| H2 (2025 to 2035) | 4.7% |
Moving into the subsequent period, from H1 2025 to H2 2035, the CAGR is projected to decrease slightly to 5.2% in the first half and projected to lower at 4.7% in the second half. In the first half (H1) the market witnessed a decrease of 70 BPS while in the second half (H2), the market witnessed a decrease of 90 BPS.
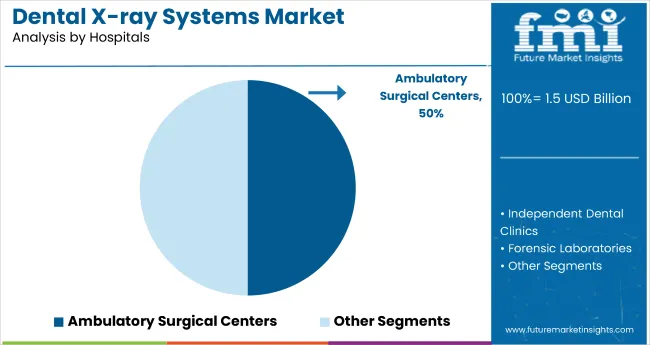
The global dental X-ray systems market is projected to grow through 2035, fueled by imaging advancements and increasing dental care access. In 2025, panoramic X-ray systems are projected to account for 42.0%, while independent dental clinics are expected to hold 47.0% of their respective segments. Key players include Dentsply Sirona, Planmeca, and Carestream Dental.
The panoramic X-ray systems segment is projected to account for 42.0% of the product type market share in 2025. These systems offer comprehensive, two-dimensional imaging of the entire mouth in a single scan, supporting diagnoses for orthodontics, implant planning, and TMJ disorders.
Planmeca and Dentsply Sirona are innovating with digital panoramic systems featuring low-dose radiation, real-time image rendering, and AI integration. Their ability to deliver fast, high-resolution images with minimal patient discomfort has led to increased use in both general and specialty practices. As dental diagnostics prioritize early detection and workflow efficiency, panoramic X-rays offer an optimal balance between coverage, cost, and operational ease.

The independent dental clinics segment is expected to capture 47.0% of the end user segment market share in 2025. These clinics prioritize affordability, ease of use, and compact imaging solutions to serve high patient volumes. Digital X-ray adoption is accelerating as solo practitioners seek faster image acquisition, lower radiation exposure, and seamless EHR integration.
Brands like Carestream Dental and Vatech cater to this segment with modular, space-efficient systems designed for plug-and-play installation. Clinics also value portability and intuitive software that streamlines diagnosis and case documentation. As patient expectations for high-tech dental care increase, independent clinics remain a major driver of equipment modernization in the dental X-ray systems market.
Increasing demand for preventive dental care is another significant factor that is driving the sales of the dental X-ray systems. An increase in oral health awareness is leading more people to demand regular check-ups and preventive screenings for early diagnosis of oral diseases. The transition from cure to prevention is hence propelling the uptake of advanced dental imaging technologies, including X-ray systems.
The rise in the demand for preventive dental care will require early detection of oral problems, such as cavities, gum diseases, and other dental irregularities that may be diagnosed with the aid of instruments, such as diagnostic dental X-rays.
Such X-ray systems allow the dentist to notice the troubles and give treatment before they could do serious damage, preventing the painful extractions of teeth that would require not only the cost incurred in surgeries but also perform a treatment. This shift towards prevention is being felt most strongly in the developed countries but is gradually reaching out to emerging markets, invigorating the rising demand for advanced dental imaging systems.
The rising focus on dental preventive care & increasing per-patient footfall is encouraging dental facilities towards increasing installed base of Dental X-ray Systems. Going forward, demand for weak doses of radiation, technology that reduces manual intervention and software providing three-dimensional rendering of teeth to obtain images will be highest in markets where the demand for diagnostic screening is the highest.
Emerging as a trend in this market is the growing demand for portable and handheld devices. The systems offer added convenience and flexibility by enabling imaging on-site in different clinical and field settings. This growing demand is fueled, in general, by the need for effective, patient-centered care.
Portable and handheld dental X-ray systems enable dental imaging to be performed in a way formerly considered impossible. The reduced size and ease of use allow dentists to take their services into remote areas where access is limited for those in need.
In city clinics, these devices also cut down on patient waiting times by streamlining the imaging process. With technology having improved battery life and image quality, these devices are proving more reliable and hence gaining greater popularity.
Manufacturers are focusing on developing lightweight and high-resolution models in order to meet this growing demand and, therefore, drive further innovations in the market. The shift towards portable and handheld dental X-ray systems will definitely change the market landscape.
Meeting the expectations of both patients and provide, these devices have become a necessity in modern dental practices. Anticipating continuous growth in this trend will gradually drive technological advancement; unfold new opportunities in the orthopedics market advisably.
Growth in healthcare infrastructure across developing countries is increasing rapidly; so is oral care attention. Increased awareness regarding dental hygiene, combined with a cradle of affordable treatment options, will surely favor market growth.
Emerging markets present opportunities for manufacturers of dental X-ray systems that remain untapped. An increase in the middle class with rising health expenditures has led to an increase in demands for advanced dental imaging systems.
Local governments are also investing in healthcare initiatives, including new dental clinics in rural and semi-urban areas. An effective approach for manufacturers would be to offer innovative, yet affordable solutions suited to these markets, therefore establishing firm local roots. Joint partnerships with local distributors and training programs will also greatly enhance penetration inside these markets.
The growing focus on improving healthcare in regions such as South Africa, Southeast Asia, and so forth constitutes an opportunity for growth in the market. It offers access to an unobtrusive opportunity for a very large proportion of this market to build strong footing through better buyer engagement.
It is projected that the high cost of dental X-ray equipment will restrict market growth. Because oral and maxillofacial operations are expensive, persons with middle- and low-income levels cannot afford them. Additionally, numerous sessions are required for prosthetic treatments to be successful, which raises the overall cost of the process and will restrain the market.
Because charging is a constant problem with dental X-ray machines, battery life may deplete more quickly than anticipated, which is projected to limit market growth. Additionally, the data input technique will be slower or more difficult than using a personal computer (PC), further hampering operational efficiency. These limitations together affect the market on a global scale and will hinder market expansion over the projected years.
Another cost-related challenge arises from the software and hardware upgrades required for maintaining these systems. Many modern digital X-ray machines demand integration with dental management systems, which adds to the overall expenditure. Smaller clinics with limited budgets find these recurring costs a deterrent to adoption.
Additionally, the cost of training staff to operate sophisticated X-ray systems and ensuring compliance with safety standards contributes to the financial burden. For handheld X-ray systems specifically, battery replacements and maintenance increase operational costs, which can outweigh their convenience.
These financial barriers collectively affect the adoption of dental X-ray systems, particularly in underserved markets, restricting global market growth.
The Tier 1 companies in the dental X-Ray systems market account for 54.7% of the total market share. The market leaders are large global players, have a tremendous amount of technology and capital, and invest huge amounts in R&D. They manufacture various kinds of dental X-ray systems that include avant-garde digital systems and 3D imaging systems, the basis of modern dental diagnostics.
The firms are famed for their strong brand presence, established distribution networks, and capacity to scale production to cater to worldwide demand. The major players in Tier 1 include Dentsply Sirona, Planmeca Oy, Carestream Health, Vatech Co. Ltd., and Danaher Corporation.
The Tier 2 companies obtain a combined market share of 19.5%. These companies are fierce competitors in some of the niche commercial markets. Compared with Tier 1 companies, they often command a lesser global market presence.
They have benefitted from increased levels of sophistication and agility in their adaptation to global marketplace demands, rapidly capturing their share of the evolving needs of specific markets or patient demographics. Tier 2 companies include FONA, Prexion Corporation, Owandy Radiology, LED Medical Diagnostics, Inc., and Air Techniques, Inc.
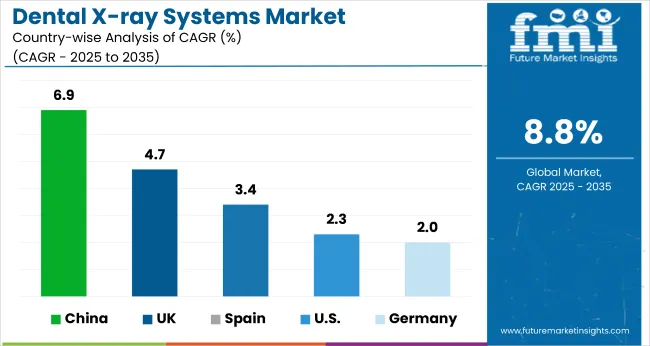
The section below covers the industry analysis for the dental x-ray systems market for different countries. Industry demand analysis on key countries in several regions of the globe, including North America, Latin America, East Asia, South Asia & Pacific, Western Europe, Eastern Europe and Middle East and Africa is provided. The United States is anticipated to remain at the forefront in North America, with a CAGR of 2.3% through 2035. In South Asia & Pacific, India is projected to witness the highest CAGR in the market of 7.4% by 2035.
| Countries | Value CAGR (2025 to 2035) |
|---|---|
| United States | 2.3% |
| Germany | 2.0% |
| UK | 4.7% |
| Spain | 3.4% |
| China | 6.9% |
| India | 7.4% |

The United States dominates the global market with high share in 2024. The United States is expected to exhibit a CAGR of 2.3% throughout the forecast period (2025 to 2035).
An increase in demand for cosmetic dentistry parallels the phenomenal growth of the dental X-ray systems market in the USA Advanced diagnostic imaging is critical to the success of aesthetic treatments related to teeth-whitening, veneers, and implants.
The rising cosmetics has resulted in a growing need for imaging technologies, specifically 3D imaging systems, to aid in treatment design and outcomes. Besides, dental clinics and private practices have increased investment in high-end systems to explore this lucrative area of the market, further driving the adoption of advanced dental X-ray systems. Marketing initiatives promoting cosmetic improvements call attention to quality diagnostics, increasing knowledge and driving consumer demand.
The focus of the USA market on cosmetic dentistry establishes a niche in this product segment to remain a significant source bolstering growth for dental X-ray systems while combining advanced imaging along with aesthetic treatments ensuring development in this specific domain, thus reiterating its supremacy in United States markets.
In 2024, the Germany held a dominant revenue in the Western Europe market and is expected to grow with a CAGR of 2.0%.
The increasing digitization of dental practices, along with the push for better environmental sustainability, drives the demand within the dental X-ray systems market in Germany. The strong regulatory framework within the country fosters deployment of advanced and green imaging solutions.
The transition from traditional film dental x-ray systems to digital x-ray systems grants many critical advantages, such as high image quality, reduced radiation, and easier integration into a digital workflow system. The shift towards eco-friendly alternatives is also driven by government promotion of green technologies whereby they encourage dentists to pursue newer technologies. Continuous education ensures that German dentists are well-equipped to use these technologies.
Germany's emphasis on transition towards digitalization and eco-friendliness establishes it as the second largest market for advanced dental X-ray systems further opening avenues for innovation and utility.
China occupies a leading value share in East Asia market in 2024 and is expected to grow with a CAGR of 6.9% during the forecasted period.
China’s dental X-ray system market is on the rise with increased available access to dental care in urban and rural areas. The country's healthcare reforms and greater financial support for public and private dental offices take center stage.
Urbanization and disposable incomes will cause a heavy rise in demand for more high-quality dental service in to originate sophisticated imaging systems in major cities. Meanwhile, other government healthcare programs will facilitate dental service accessibility in the rural areas, driving demand for handheld and portable dental X-ray systems. Manufacturers are focusing on providing affordable alternatives suited to mid-sized and rural clinics.
With investment in dental infrastructure and a balanced focus on urban and rural sectors, China is one of the rapidly growing markets for dental X-ray systems; innovations are fast contemplating diverse needs.
The Industry outlook of dental X-ray systems is experiencing rapid advancements as key players prioritize innovation to meet evolving industry demands. Companies are focusing on developing cutting-edge imaging technologies that enhance diagnostic precision and streamline dental workflows.
This includes introducing advanced CBCT (cone beam computed tomography) systems with multifunctional capabilities, integrating AI-based software for improved image analysis and orthodontic simulations, and launching mobile and ergonomic scanning solutions to optimize clinical efficiency.
Recent Industry Developments in Dental X-ray Systems Industry:
| Report Attributes | Details |
|---|---|
| Current Total Market Size (2025) | USD 1.5 billion |
| Projected Market Size (2035) | USD 3.5 billion |
| CAGR (2025 to 2035) | 5.2% |
| Base Year for Estimation | 2024 |
| Historical Period | 2020 to 2024 |
| Projections Period | 2025 to 2035 |
| Quantitative Units | USD billion for value |
| Product Types Analyzed (Segment 1) | Cephalometric Projection Systems, Portable Intraoral X-Ray Systems, Panoramic X-Ray Systems, Floor-Mounted Intraoral X-Ray Systems |
| End Users Covered (Segment 2) | Hospitals, Ambulatory Surgical Centers, Independent Dental Clinics, Forensic Laboratories |
| Regions Covered | North America; Latin America; Europe; Asia-Pacific; Middle East & Africa |
| Countries Covered | United States, Germany, France, United Kingdom, China, India, Japan, South Korea, Brazil |
| Key Players Influencing the Market | FONA, PLANMECA OY, Prexion Corporation, Owandy Radiology, Vatech Co. Ltd., Yoshida Dental Mfg., Dentsply Sirona, LED Medical Diagnostics, Cefla S.C., Air Techniques, Danaher Corporation |
| Additional Attributes | Dollar sales by product and end user, rise of digital panoramic imaging, growth in independent dental clinics, innovations in 3D imaging and software tools, regional adoption trends |
In terms of service, the industry is divided into cephalometric projections systems, portable intraoral x-ray systems, panoramic x-ray systems, intraoral x-ray systems mounted on the floor.
In terms of end user, the industry is segregated into hospitals, ambulatory surgical centers, independent dental clinics, and forensic laboratories
Key countries of North America, Latin America, East Asia, South Asia & Pacific, Western Europe, Eastern Europe, and Middle East and Africa (MEA) have been covered in the report.
The global dental x-ray systems sales is projected to witness CAGR of 5.2% between 2025 and 2035.
The global sales of dental x-ray systems stood at USD 1.4 billion in 2024.
The global dental x-ray systems industry outlook is anticipated to reach USD 3.5 billion by 2035 end.
China is expected to show a CAGR of 6.9% in the assessment period.
The key players operating in the global dental x-ray systems include FONA, PLANMECA OY, Prexion Corporation, Owandy Radiology, Vatech Co. Ltd., The Yoshida Dental Mfg. Co. Ltd., Dentsply Sirona, LED Medical Diagnostics Inc., Cefla S.C., Air Techniques, Inc., and Danaher Corporation


Full Research Suite comprises of:
Market outlook & trends analysis
Interviews & case studies
Strategic recommendations
Vendor profiles & capabilities analysis
5-year forecasts
8 regions and 60+ country-level data splits
Market segment data splits
12 months of continuous data updates
DELIVERED AS:
PDF EXCEL ONLINE
Handheld Dental X-Ray Systems Market Analysis - Size, Share, and Forecast 2025 to 2035
Dental Wounds Treatment Market Size and Share Forecast Outlook 2025 to 2035
Dental Radiometer Market Size and Share Forecast Outlook 2025 to 2035
Dental Anaesthetic Market Size and Share Forecast Outlook 2025 to 2035
Dental Diamond Bur Market Size and Share Forecast Outlook 2025 to 2035
Dental Laboratory Market Size and Share Forecast Outlook 2025 to 2035
Dental Permanent Cements Market Size and Share Forecast Outlook 2025 to 2035
Dental Bleaching Agent Market Size and Share Forecast Outlook 2025 to 2035
Dental Care Products Market Size and Share Forecast Outlook 2025 to 2035
Dental Etching Liquid Market Size and Share Forecast Outlook 2025 to 2035
Dental Sutures Market Analysis - Size, Share, and Forecast Outlook 2025 to 2035
Dental Hygiene Devices Market Size and Share Forecast Outlook 2025 to 2035
Dental Implantology Software Market Analysis - Size, Growth, & Forecast Outlook 2025 to 2035
Dental Veneers Market Size and Share Forecast Outlook 2025 to 2035
Dental Articulators Market Size and Share Forecast Outlook 2025 to 2035
Dental Fluoride Varnish Market Size and Share Forecast Outlook 2025 to 2035
Dental Adhesives Market Size and Share Forecast Outlook 2025 to 2035
Dental Flap Surgery Market Size and Share Forecast Outlook 2025 to 2035
Dental Chairs Market Size and Share Forecast Outlook 2025 to 2035
Dental Units Market Size and Share Forecast Outlook 2025 to 2035

Thank you!
You will receive an email from our Business Development Manager. Please be sure to check your SPAM/JUNK folder too.
Chat With
MaRIA