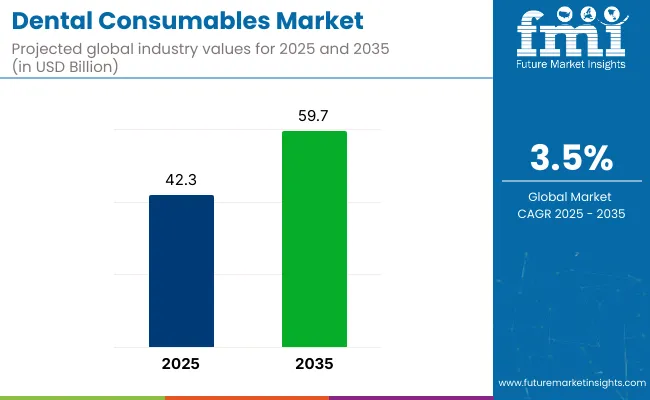
The global Dental Consumables Market is estimated to be valued at USD 42.3 billion in 2025 and is projected to reach USD 59.7 billion by 2035, registering a compound annual growth rate of 3.5% over the forecast period.
| Attribute | Values |
|---|---|
| Estimated Industry Size (2025E) | USD 42.3 billion |
| Projected Industry Value (2035F) | USD 59.7 billion |
| CAGR (2025 to 2035) | 3.5% |
The dental consumables market is undergoing sustained transformation, shaped by rising demand for restorative and cosmetic dentistry, an aging global population, and increasing awareness of oral health's link to overall wellness.
Technological innovations like 3D printing and digital impressions are modernizing dental procedures, enabling faster, more precise outcomes. Additionally, improving access to dental care in emerging markets, supported by expanding healthcare infrastructure and higher discretionary incomes, is fueling broader adoption.
While cost and reimbursement constraints remain challenges in certain regions, the market's growth trajectory remains strong due to the convergence of innovation, demographic shifts, and heightened preventive care focus. This momentum is creating new opportunities across prosthetics, orthodontics, and periodontal segments, paving the way for long-term industry expansion.
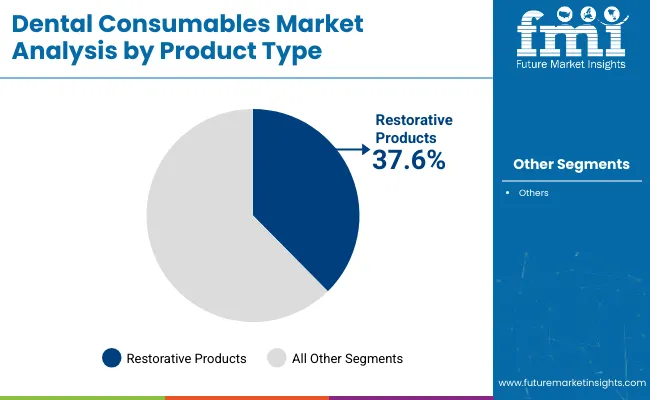
Restorative Products segment to dominate the dental consumables market, holding approximately 37.6% of the revenue share in 2025. This leadership has been attributed to the growing emphasis on functional and aesthetic restoration of teeth, particularly among aging populations and individuals with lifestyle-related dental deterioration. Procedures involving crowns, bridges, and fillings have been increasingly sought due to their effectiveness in tooth structure restoration.
A surge in cosmetic dental treatments has also driven demand for high-quality composite and ceramic-based materials, which are primarily categorized under restorative products. Moreover, technological integration in material sciences has enabled the development of bio-compatible and longer-lasting restorations, which has further improved adoption among dental professionals.
Rising awareness of oral health’s link to systemic wellness has prompted earlier dental interventions, boosting product consumption. This segment’s continued growth has also been encouraged by the increasing number of licensed practitioners and global expansion of private dental care facilities.
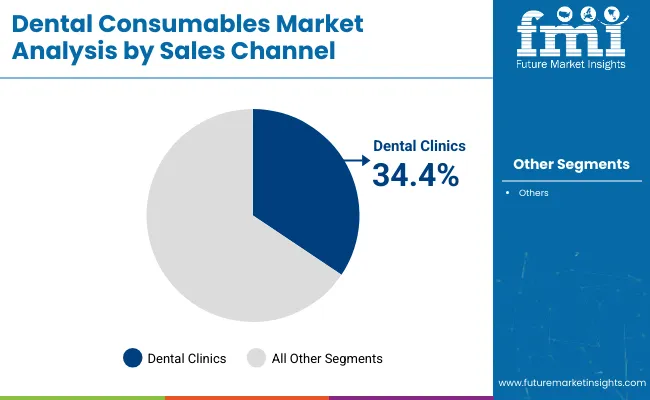
Dental Clinics are projected to account for 34.4% of the overall market revenue by 2025, making them the most dominant sales channel for dental consumables. This dominance has been primarily driven by their accessibility, specialized services, and a strong patient preference for personalized care. A decentralized care model, typically offered by clinics, allows for greater flexibility in treatment scheduling and localized trust-building among communities.
The segment’s growth has also been supported by the rise in private dental practices, particularly in urban and semi-urban regions, where awareness and disposable incomes are steadily increasing. Dental clinics are frequently equipped with modern diagnostic and procedural technologies, enhancing treatment precision and patient experience.
Additionally, product turnover is relatively higher in clinics due to the frequency of patient visits and procedural variety. Consequently, dental consumables are consumed in larger volumes, reinforcing the segment’s lead position in the global sales channel landscape.
The dental consumables landscape around the world is growing steadily. This growth is happening because more people want cosmetic and restorative dental work. Additionally, the use of new digital techniques and less invasive procedures is increasing.
The main groups getting benefits from all this are those who make dental products, dental clinics, and countries where healthcare is becoming more available. As regulations get tougher and technology advances, there will be a focus on creating new biocompatible materials and using AI for better diagnostics. These changes will help make dental care more efficient and lead to better outcomes for patients.
Adopt Digital and AI-Based Dentistry
Invest in digital diagnostics, 3D printing, and computerized workflows to improve treatment accuracy, decrease procedure time, and enhance patient satisfaction. R&D in intelligent dental materials and automation should be given top priority by companies to remain competitive in a rapidly tech-enabled sector.
Grow in High-Growth Emerging Markets
Align industry strategy with the emerging demand for cost-effective and quality dental care in Asia-Pacific, Latin America, and the Middle East. Build localized manufacturing centers, regional clinic partnerships, and focused pricing structures to seize growth in these fast-emerging regions.
Strengthen Supply Chain Resilience and Sustainability
Diversify supply strategies and invest in sustainable, biocompatible materials to manage raw material shortages and meet changing regulations. Create strategic alliances with environmentally friendly suppliers and dental associations to establish a robust, future-proof supply chain while strengthening brand reputation.
| Risk | Probability & Impact |
|---|---|
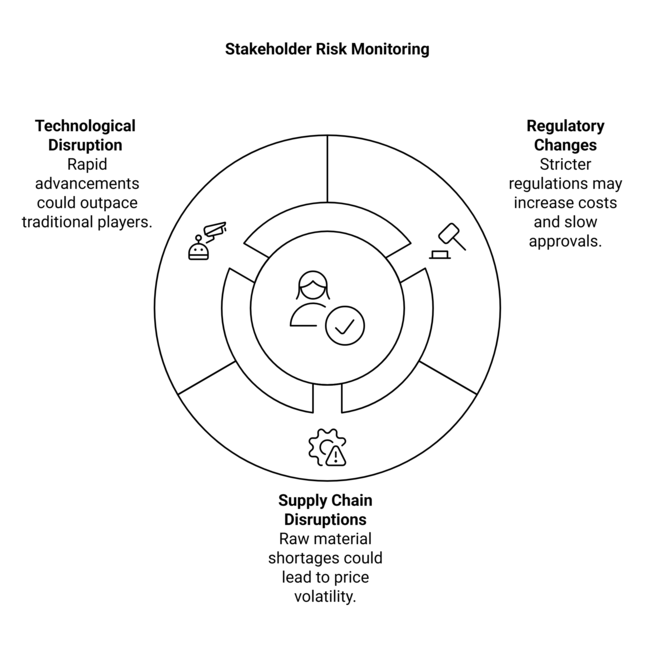
| Regulatory Changes & Compliance Burdens - Stricter regulations on biocompatibility and sustainability may increase costs and slow product approvals. | High Probability, High Impact |
| Supply Chain Disruptions - Raw material shortages, especially for zirconia and polymer-based composites, could lead to price volatility and delays. | Medium Probability, High Impact |
| Technological Disruption & Competition - Rapid advancements in AI, robotics, and digital dentistry could outpace traditional players that fail to innovate. | High Probability, Medium Impact |
| Priority | Immediate Action |
|---|---|
| Digital & AI Integration | Accelerate AI-powered diagnostics and 3D printing adoption. |
| Supply Chain Stability | Diversify supplier base and secure alternative sources for key raw materials. |
| Emerging Industry Expansion | Establish regional partnerships and evaluate pricing models for high-growth sector. |
To stay ahead, companies must changing dental consumables sector, the business needs to give top priority to digitalization, enhance supply chain resilience, and grow in high-growth emerging sectors.
Immediate steps should be to speed up AI and 3D printing adoption, acquiring alternative raw materials sources to safeguard against supply disruptions, and partnering strategically with regions to capture developing demand in Asia-Pacific and Latin America. This intelligence indicates a move towards tech-enabled efficiency and regulatory flexibility, necessitating an active R&D investment strategy and a new go-to-sector strategy.
Regional Variance:
High Variance:
Convergent and Divergent Perspectives on ROI:
Consensus:
Regional Variance:
Shared Challenges:
Regional Differences:
Manufacturers:
Distributors:
End-Users (Dental Clinics & Labs):
Alignment:
Divergence:
North America:
Western Europe:
Asia-Pacific:
High Consensus:
Key Variances:
Strategic Insight:
| Country/Region | Regulatory Impact & Mandatory Certifications |
|---|---|
| United States (USA) | The FDA (Food and Drug Administration) regulates dental materials under Class I, II, and III medical devices, requiring 510(k) clearance or Premarket Approval (PMA) for new dental products. |
| European Union (EU) | The Medical Device Regulation (MDR 2017/745) enforces stringent biocompatibility and safety requirements, increasing compliance costs for manufacturers. The CE Marking is mandatory for all dental consumables before they can be sold in the EU. |
| United Kingdom (UK) | Post-Brexit, the UK has adopted its own UKCA (UK Conformity Assessed) certification, replacing the EU’s CE Mark for medical devices, including dental consumables. |
| China | The National Medical Products Administration (NMPA) requires approval for all dental materials, with a focus on toxicity and long-term durability testing. Recent policies encourage domestic manufacturing over imports, affecting international brands. |
| Japan | Regulated by the Pharmaceuticals and Medical Devices Agency (PMDA) under the Ministry of Health, Labour and Welfare (MHLW), requiring Shonin (Approval) or Ninsho (Certification) depending on the product class. |
| South Korea | The Ministry of Food and Drug Safety (MFDS) mandates product registration and clinical evaluations for dental consumables. KFDA (Korea Food and Drug Administration) certification is required. |
| India | The Central Drugs Standard Control Organization (CDSCO) classifies dental products under the Drugs and Cosmetics Act, requiring Import Licenses (Form MD-14/15) for foreign brands. |
| Brazil | The ANVISA regulates all dental consumables as medical devices, requiring RDC 185/2001 compliance for registration. ISO 13485 certification is highly recommended for international manufacturers entering the Brazilian segment. |
| Australia | The Therapeutic Goods Administration (TGA) mandates all dental consumables to be listed in the Australian Register of Therapeutic Goods (ARTG) before commercialization. |
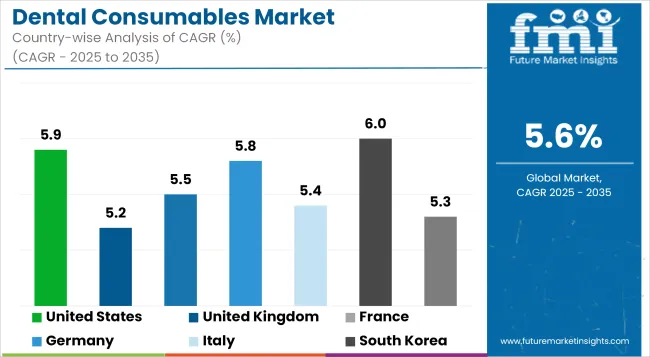
The USA dental consumables landscape is predicted to grow at a CAGR of 5.9% during the 2025 to 2035 period, slightly over the global average due to swift digital adoption and growing demands for dentistry in the elderly population. Regulatory compliance is a segment entry barrier, as the American Dental Association (ADA) and Food and Drug Administration (FDA) have stringent quality and safety standards.
Key reasons for growth in the segments include increasing demand for CAD/CAM-based restorations, AI-powered diagnostics, and high demand for clear aligners. More patients are covered under medicare advantage dental plans, and procedure volumes continue to increase. Challenges such as supply chain instability, high treatment costs, and a shortage of qualified dental workers must be addressed. Increased investment in training and automation will be essential.
Dental consumables in the UK are expected to grow at 5.2% CAGR, as the rising cosmetic dentistry trend in the region is coupled with UK. Changes to regulations after Brexit have also made things complicated, as the UK has now adopted UKCA certification, meaning products must be approved separately from the EU.
Due to limited NHS funding for dental services, the majority of British dental care is either paid for out-of-pocket or through private insurance. There is a growing demand for digital dentistry solutions like intraoral scanners, CAD/CAM restorations, and AI-powered diagnostics. Sustainability in dental materials is a key area in which mercury-free fillings and biodegradable dental products are emerging as popular trends.
Public healthcare support and a high level of dental insurance coverage under France’s universal healthcare system. The French dental consumables market is anticipated to grow at a CAGR of 5.5% in 2025. The government launched 100% Sante, which guarantees full reimbursement of important dental procedures, thereby increasing patient volumes and the demand for affordable health restorations and orthodontic options.
Many sustainability initiatives are already happening with eco-friendly packaging and recyclable dental materials. Technology adoption, such as 3D printing and AI-assisted diagnostics, is increasing but at a slower rate compared to Germany and the USA However, it struggles with slow regulatory approvals, expensive labor, and limits on advertising dental services.
Germany’s dental consumables segment is expected to grow at 5.8% CAGR owing to its developed healthcare infrastructure, better insurance penetration, and rigorous regulatory system. It is a center for dental technology and R&D and has some of the best dental manufacturers who produce high-quality implants, CAD/CAM materials, and digital dentistry innovations.
Their presence has resulted in a consolidation of suppliers in the industry, as it has proven difficult for some of the smaller manufacturers to comply with the EU MDR regulations. Germany operates is a leader against these trends, rapidly transitioning to AI-assisted diagnostics, digital impressions, and chairside restorations-enhancing efficiency and patient outcomes across the board. There are challenges in the form of labor shortages and rising operational expenses for dental clinics.
The dental consumables sector in Italy is expected to grow at a CAGR of 5.4%, driven by the growing demand for cosmetic dentistry, the aging population, and rising private expenditure on dental care. There is a high number of private dental clinics in the country, and aesthetic treatments such as veneers, teeth whitening, and aligners have gained popularity. The adoption of digital dentistry is on the rise, but cost-conscious clinics continue to rely on traditional workflows.
The demand for zirconia and ceramic restorations, which are driven by the tooth's aesthetic preference, is robust in the sector. But Italy faces several hurdles which including an aging body of dental professionals. Regardless of these pain points, Italy is an important European segment for dental consumables, especially for high-quality restorative and cosmetic treatments.
The dental consumable sector is growing in South Korea at a CAGR of 6.0% due to the focus on advanced dental technology, government reimbursement programs, and the growth of the cosmetic dentistry segment. Clinics extensively utilize AI-assisted diagnostics, 3D printing, and CAD/CAM systems, which makes the country a leader in adopting digital dentistry.
Dental tourism is a big part of the growth, attracting a flow of patients from China, Japan, and Southeast Asia for affordable, high-quality implants and orthodontics. On a wider scale, reimbursement hurdles and pricing pressures on domestic manufacturers are major challenges. The dental sector in South Korea is highly competitive, with many local brands expanding into the global industry.
The Japanese dental consumables sector is estimated to grow at a CAGR of 5.3% over the forecasted period of 2025 to 2035, mainly concerning the growing geriatric population in the country. The elderly population is more than 28% of the total population, so the need for dental implants, prosthetics, and periodontal treatment is increasing. Preventive dentistry is actively promoted by the Japanese government, which subsidizes routine check-ups, fluoride treatments, and periodontal care.
This incentive has led to increasing interest in less invasive treatment options, sealants, and other advanced dental hygiene products. Nevertheless, the price of restorative and cosmetic dental treatment continues to prevent the segment from expanding, causing many patients to travel to neighboring countries such as South Korea and China to pay less.
The dental consumables landscape in China is forecast to grow at a CAGR of 6.2% from 2025 to 2035, primarily driven by the rise in disposable incomes, urbanization, and awareness of oral health. Dental aesthetics are booming in urban centers such as Beijing, Shanghai, and Guangzhou, where patients demand clear aligners, teeth whitening products, and ceramic restorations. Cosmetic dentistry has gained a lot of traction from social media and more aesthetically conscious younger consumers.
Still, local competition is fierce, and local manufacturers dominate the segment due to their ability to offer lower-cost options. While premium international brands continue to dominate the sector for high-end implants and orthodontic solutions, local brands are steadily gaining ground and posing a challenge to foreign companies.
The Australian & New Zealand dental consumables landscape is estimated to grow at a CAGR of 5.6% through 2025 to 2035, due to increased government initiatives, high penetration of private insurance, and rising awareness among patients about oral health. In both Australia and New Zealand, public dental services are covered under the CDBS and public dental programs, respectively, and these schemes guarantee a volume of public dental service to meet demand for basic dental consumables.
Dental treatment prices in both countries are still high, motivating many patients to choose between mid-range or alternative solutions instead of premium materials. The influence of private dental insurance is notable on industry growth, as it covers a considerable share of treatment procedures and purchasing behavior toward higher-end dental consumables.
India’s dental consumables sector has one of the highest global growth rates, with an expected CAGR of 6.5% for the period between 2025 and 2035. Increasing disposable incomes, urbanization, and a rising focus on oral health combined with the growing phenomenon of dental tourism are driving the segment. Dental tourism is a big driver, as international patients look for low-cost but high-quality treatments, such as dental implants, root canals, and cosmetic work.
Delhi, Mumbai, Chennai, and Bangalore are fast becoming hotbeds for low-cost dental treatments, attracting the Middle East, Africa, and First World citizens. In India, the majority of dental treatments are self-funded, unlike in Western sectors where health insurance covers them leading to significant price sensitivity in consumer behavior.
The dental consumables market is witnessing intensified competition characterized by continuous innovation, product diversification, and strategic partnerships. Key players are focusing on expanding their global footprints through mergers, acquisitions, and collaborations with regional distributors to strengthen supply chain networks.
The development of advanced biomaterials, digital dental solutions, and patient-centric products has become a critical differentiator in gaining market share. Emphasis is being placed on sustainability, with manufacturers introducing eco-friendly and biocompatible consumables to align with regulatory expectations and consumer demand.
Additionally, R&D investments are being prioritized to improve product performance and procedural outcomes. Market participants are also leveraging digital marketing channels and e-commerce platforms to enhance customer engagement and streamline product delivery.
Key Development
In 2025, COLTENE Group unveiled six new dental innovations at IDS 2025. These include HySolate Liquid Dam for gingiva protection, Kenda ShapeGuard polishing system, MicroMega One Glider & RECI Glider for endodontics, Roeko Gelatamp forte & white for hemostasis, and BRILLIANT Lumina for hydrogen peroxide-free tooth whitening. These products emphasize enhanced clinical outcomes, workflow efficiency, sustainability, and support COLTENE's "Endodontics to Restoration" approach.
In 2024, Private equity firm Behrman Capital acquired Vista Apex, a dental manufacturer specializing in consumable products. This acquisition aims to expand Vista Apex's product portfolio and operations, including through future mergers and acquisitions, to become a leading "total tooth" care provider.
Dental consumables are materials used by dentists during multiple dental treatments, such as restorations, implants, orthodontic procedures, and preventive dental treatments. These materials enhance the efficiency, accuracy, and convenience of treatments.
Restorative materials, implants, crowns, bridges, dental adhesives, anesthetics, impression trays, and orthodontic devices are deemed essential products. They are all needed for everyday activities in the majority of dental clinics.
Technology is revolutionizing dentistry with the addition of digital workflows, CAD/CAM systems, 3D printing, and AI tools. These technologies improve the accuracy, customization, and speed of dental procedures, enhancing the efficiency of procedures as well as patient results.
Rising global attention on oral care, coupled with the aging of the population and the growth in dental tourism, is fueling the demand for premium dental supplies. Furthermore, new developments in dental procedures and increasing popularity in cosmetic dentistry are also pushing this trend.
The employment of superior consumables enhances treatment results, lessens discomfort, and provides improved overall dental health. Patients enjoy more efficient treatments, quicker recovery times, and longer-lasting outcomes as a result of improved materials and procedures.


Full Research Suite comprises of:
Market outlook & trends analysis
Interviews & case studies
Strategic recommendations
Vendor profiles & capabilities analysis
5-year forecasts
8 regions and 60+ country-level data splits
Market segment data splits
12 months of continuous data updates
DELIVERED AS:
PDF EXCEL ONLINE
Dental Radiometer Market Size and Share Forecast Outlook 2025 to 2035
Dental Anaesthetic Market Size and Share Forecast Outlook 2025 to 2035
Dental Diamond Bur Market Size and Share Forecast Outlook 2025 to 2035
Dental Laboratory Market Size and Share Forecast Outlook 2025 to 2035
Dental Matrix Systems Market Size and Share Forecast Outlook 2025 to 2035
Dental Permanent Cements Market Size and Share Forecast Outlook 2025 to 2035
Dental Bleaching Agent Market Size and Share Forecast Outlook 2025 to 2035
Dental Care Products Market Size and Share Forecast Outlook 2025 to 2035
Dental Etching Liquid Market Size and Share Forecast Outlook 2025 to 2035
Dental Sutures Market Analysis - Size, Share, and Forecast Outlook 2025 to 2035
Dental Hygiene Devices Market Size and Share Forecast Outlook 2025 to 2035
Dental Implantology Software Market Analysis - Size, Growth, & Forecast Outlook 2025 to 2035
Dental Veneers Market Size and Share Forecast Outlook 2025 to 2035
Dental X-Ray Systems Market Analysis - Size, Share, and Forecast Outlook 2025 to 2035
Dental Suction Systems Market Size and Share Forecast Outlook 2025 to 2035
Dental Articulators Market Size and Share Forecast Outlook 2025 to 2035
Dental Fluoride Varnish Market Size and Share Forecast Outlook 2025 to 2035
Dental Adhesives Market Size and Share Forecast Outlook 2025 to 2035
Dental Flap Surgery Market Size and Share Forecast Outlook 2025 to 2035
Dental Chairs Market Size and Share Forecast Outlook 2025 to 2035

Thank you!
You will receive an email from our Business Development Manager. Please be sure to check your SPAM/JUNK folder too.
Chat With
MaRIA