The Dental Diamond Bur Market is estimated to be valued at USD 183.5 million in 2025 and is projected to reach USD 414.8 million by 2035, registering a compound annual growth rate (CAGR) of 8.4% over the forecast period.
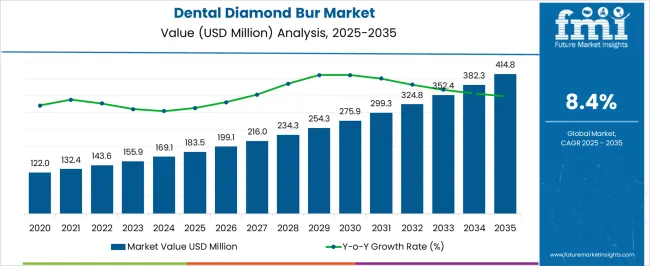
| Metric | Value |
|---|---|
| Dental Diamond Bur Market Estimated Value in (2025 E) | USD 183.5 million |
| Dental Diamond Bur Market Forecast Value in (2035 F) | USD 414.8 million |
| Forecast CAGR (2025 to 2035) | 8.4% |
The dental diamond bur market is witnessing consistent expansion, supported by the rising prevalence of dental disorders, increased adoption of minimally invasive procedures, and advancements in restorative and cosmetic dentistry. The demand for precision-driven tools has strengthened the role of diamond burs, particularly in procedures requiring enhanced cutting efficiency and durability.
Hospitals and dental clinics are increasingly investing in technologically advanced instruments to improve procedural outcomes and patient comfort. Current growth is further driven by the availability of burs in varied shapes and grit sizes, enabling customization for diverse dental applications.
Continuous R&D efforts aimed at improving cutting precision, longevity, and ergonomic design are also shaping competitive differentiation in the market. With rising oral health awareness and government-supported dental care programs, future growth will be reinforced by higher patient volumes and improved access to advanced treatment tools globally.
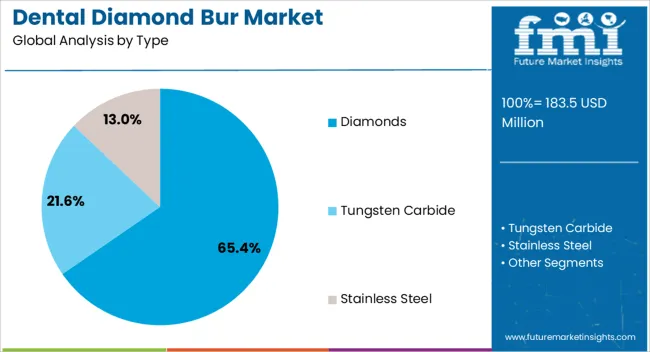
The diamonds segment dominates the type category, holding approximately 65.4% share of the dental diamond bur market. This leadership is attributed to the superior cutting efficiency, durability, and precision offered by diamond-coated burs compared to alternatives.
The segment’s adoption is reinforced by its ability to minimize chair time and enhance the overall accuracy of procedures, including crown preparation and cavity shaping. Its cost-effectiveness in long-term use further supports preference among practitioners.
Advancements in manufacturing processes have improved consistency in grit distribution, enhancing cutting performance and extending operational life. With continuous preference for reliable, high-performance instruments in clinical settings, the diamonds segment is expected to maintain its stronghold.
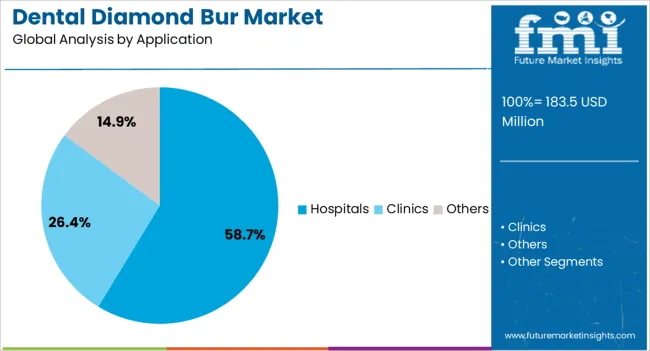
The hospitals segment leads the application category with approximately 58.7% share, reflecting the growing preference for advanced dental procedures performed in institutional care settings. Hospitals offer comprehensive treatment facilities with advanced infrastructure, making them the primary choice for complex and specialized dental interventions.
Increased patient inflow due to insurance coverage and government programs has further supported demand in this segment. Adoption is strengthened by hospitals’ ability to invest in bulk procurement of advanced tools and maintain high compliance with sterilization standards.
With rising patient awareness and growing access to hospital-based dental care, this segment is expected to sustain its dominance.
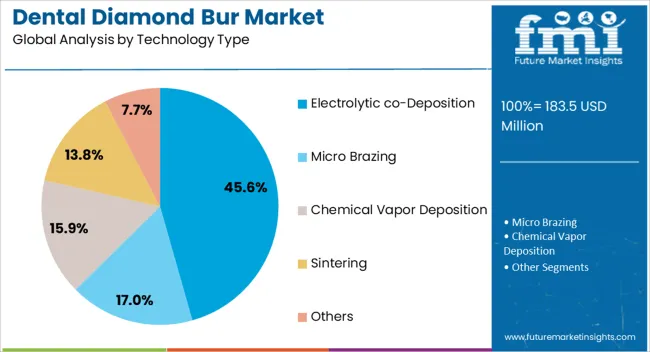
The electrolytic co-deposition segment dominates the technology type category, accounting for approximately 45.6% share. This segment’s prominence is supported by its ability to produce burs with uniform diamond distribution, resulting in enhanced cutting performance and prolonged tool life.
Electrolytic methods allow for better adhesion of diamond particles, ensuring improved durability under high-speed operations. The segment’s growth is also reinforced by its compatibility with mass production, enabling cost efficiency for manufacturers.
As precision-driven restorative dentistry continues to expand, electrolytic co-deposition technology is expected to remain the preferred manufacturing method, consolidating its leading position.
This section provides a comprehensive analysis of the industry over the last five years, highlighting the expected growth patterns for the market. A strong historical CAGR of 11.0% indicates a slowdown in the market. The industry is predicted to develop at an 8.5% CAGR until 2035.
| Historical CAGR | 11.0% |
|---|---|
| Forecast CAGR | 8.5% |
Reducing dental expenses can be challenging, especially during financial difficulties. This economic aspect might lead to a decline in the market for dental diamond burs. The demand for diamond burs could decrease due to changes in treatment preferences, increased use of substitute materials, and adjustments to oral hygiene procedures. Factors like heightened competition and advancements in alternative technologies may also impact the dental diamond bur market.
Rising Demand for Cosmetic Dentistry
The demand for precise and versatile diamond burs is rising owing to the increased emphasis on aesthetic dental procedures. High-quality diamond burs are more important than ever due to the developing need for minimally invasive cosmetic procedures. The endodontic diamond burs are crucial in achieving the desired precision and accuracy for cosmetic dental procedures. Additionally, the most recent developments in dental technology influence the design and use of diamond burs, allowing dentists to do minimally invasive procedures that produce the best outcomes with the least amount of discomfort to their patients.
Development of Digital Dentistry Integration
The dental industry is rapidly advancing and going digital with the integration of diamond burs into digital dental workflows. This integration includes CAD/CAM systems, allowing seamless and efficient treatment planning. One of the most significant advantages of this digitalization is the automation of diamond bur selection, which is now based on digital impressions and treatment protocols. This advancement is anticipated to revolutionize the market by driving growth and expanding the industry's capabilities. With the digitalization of the dentistry industry, dental professionals can now provide more precise and accurate treatments, ultimately leading to better patient outcomes.
Snowballing Demand for Personalized Dental Burs
The need for dental implants that may be customized to each patient's unique needs is rising as dental treatment becomes more individualized. This demand for customized dental burs has driven the development of advanced 3D bio-printing technology, which allows for highly individualized diamond burs. These customizable burs have become increasingly prevalent in the global dental industry due to their ability to provide a more precise and efficient dental experience for patients. By leveraging the latest technological advancements, dental professionals can offer patients a more personalized experience that meets their unique needs and preferences.
| Attributes | Details |
|---|---|
| Top Type | Diamonds |
| CAGR (2025 to 2035) | 8.3% |
The demand for diamond dental tops is expected to rule the market, growing at a CAGR of 8.3% through 2035. There are several reasons for this inclination for diamond tops for dental burs:
| Attributes | Details |
|---|---|
| Top Application | Hospitals |
| CAGR from 2025 to 2035 | 8.1% |
The wide application of dental diamond burs in hospitals drives the segment’s growth. The segment is expected to grow at a CAGR of 8.1% through 2035. This superiority can be described as follows:
This section examines the major markets for dental diamond burs, such as the United States, China, Japan, South Korea, and the United Kingdom. The section explores the aspects influencing the demand for dental diamond burs in these countries.
| Country | CAGR from 2025 to 2035 |
|---|---|
| United States | 8.7% |
| Japan | 9.9% |
| United Kingdom | 9.6% |
| South Korea | 10.5% |
| China | 8.9% |
In the United States, the demand for dental diamond burs is anticipated to expand at a CAGR of 8.7%, reaching a valuation of USD 414.8 million by 2035. The following factors fuel this rapid growth:
Japan is experiencing a surge in demand for dental diamond burs, which is expected to rise at a CAGR of 9.9% through 2035. The market is expected to reach a valuation of USD 42.1 million by 2035. Some of the primary drivers include:
China is witnessing an increase in demand for dental diamond burs, estimating USD 59.5 million, with a predicted CAGR of 8.9% through 2035. Among the main trends are:
The market for dental diamond burs is expanding in the United Kingdom with an estimated CAGR of 9.6% and a market valuation of USD 15.4 million through 2035. Here are a few of the major trends:
The demand for dental diamond burs in South Korea is anticipated to increase at a promising CAGR of 10.5%, acquiring a valuation of USD 24.7 million by 2035. Several of the key trends are as follows:
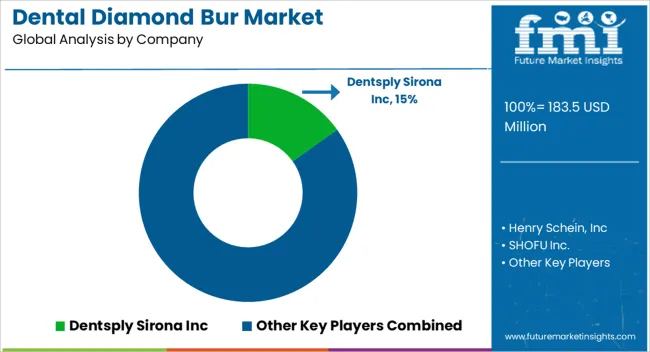
Corporations are actively expanding their presence in international markets, contributing to the globalization of the dental diamond bur industry. These companies are driving advancements in materials, design, and manufacturing processes, which are influencing the overall technological landscape. They are expanding their product portfolios to include diverse diamond burs tailored to different dental procedures and specialties.
Moreover, enterprises like Dentsply Sirona Inc. and Prima Dental Group are aligning with the digital dentistry trend by integrating diamond burs with digital workflows and technologies to enhance precision and efficiency. They also adhere to stringent quality and safety standards, ensuring their products comply with domestic and international regulations. To familiarize dental professionals with the benefits of diamond burs and their optimal usage, companies invest in educational programs and materials.
Collaborations between dental bur manufacturers, dental professionals, and research institutions foster innovation and address specific clinical needs. Additionally, market players are placing emphasis on eco-friendly manufacturing processes and materials, contributing to sustainability initiatives within the dental industry.
Companies such as SHOFU Inc. and Bresseler USA are tailoring their products to meet different regions' cultural and clinical preferences to ensure relevance and acceptance in diverse markets. They are also implementing competitive pricing strategies and effective marketing approaches to gain market share and strengthen the overall industry outlook.
Recent Developments
The global dental diamond bur market is estimated to be valued at USD 183.5 million in 2025.
The market size for the dental diamond bur market is projected to reach USD 414.8 million by 2035.
The dental diamond bur market is expected to grow at a 8.4% CAGR between 2025 and 2035.
The key product types in dental diamond bur market are diamonds, tungsten carbide and stainless steel.
In terms of application, hospitals segment to command 58.7% share in the dental diamond bur market in 2025.


Our Research Products

The "Full Research Suite" delivers actionable market intel, deep dives on markets or technologies, so clients act faster, cut risk, and unlock growth.

The Leaderboard benchmarks and ranks top vendors, classifying them as Established Leaders, Leading Challengers, or Disruptors & Challengers.

Locates where complements amplify value and substitutes erode it, forecasting net impact by horizon

We deliver granular, decision-grade intel: market sizing, 5-year forecasts, pricing, adoption, usage, revenue, and operational KPIs—plus competitor tracking, regulation, and value chains—across 60 countries broadly.

Spot the shifts before they hit your P&L. We track inflection points, adoption curves, pricing moves, and ecosystem plays to show where demand is heading, why it is changing, and what to do next across high-growth markets and disruptive tech

Real-time reads of user behavior. We track shifting priorities, perceptions of today’s and next-gen services, and provider experience, then pace how fast tech moves from trial to adoption, blending buyer, consumer, and channel inputs with social signals (#WhySwitch, #UX).

Partner with our analyst team to build a custom report designed around your business priorities. From analysing market trends to assessing competitors or crafting bespoke datasets, we tailor insights to your needs.
Supplier Intelligence
Discovery & Profiling
Capacity & Footprint
Performance & Risk
Compliance & Governance
Commercial Readiness
Who Supplies Whom
Scorecards & Shortlists
Playbooks & Docs
Category Intelligence
Definition & Scope
Demand & Use Cases
Cost Drivers
Market Structure
Supply Chain Map
Trade & Policy
Operating Norms
Deliverables
Buyer Intelligence
Account Basics
Spend & Scope
Procurement Model
Vendor Requirements
Terms & Policies
Entry Strategy
Pain Points & Triggers
Outputs
Pricing Analysis
Benchmarks
Trends
Should-Cost
Indexation
Landed Cost
Commercial Terms
Deliverables
Brand Analysis
Positioning & Value Prop
Share & Presence
Customer Evidence
Go-to-Market
Digital & Reputation
Compliance & Trust
KPIs & Gaps
Outputs
Full Research Suite comprises of:
Market outlook & trends analysis
Interviews & case studies
Strategic recommendations
Vendor profiles & capabilities analysis
5-year forecasts
8 regions and 60+ country-level data splits
Market segment data splits
12 months of continuous data updates
DELIVERED AS:
PDF EXCEL ONLINE
Dental Burs Market Growth - Trends & Forecast 2024 to 2034
Dental Repair Membranes for Implant Procedures Market Size and Share Forecast Outlook 2025 to 2035
Dental Cavity Filling Materials Market Size and Share Forecast Outlook 2025 to 2035
Burn-off Oven Market Forecast Outlook 2025 to 2035
Diamond and CBN Micron Powder Market Size and Share Forecast Outlook 2025 to 2035
Dental Implant and Prosthetic Market Size and Share Forecast Outlook 2025 to 2035
Dental Imaging Equipment Market Forecast and Outlook 2025 to 2035
Dental Wounds Treatment Market Size and Share Forecast Outlook 2025 to 2035
Dental Radiometer Market Size and Share Forecast Outlook 2025 to 2035
Dental Anaesthetic Market Size and Share Forecast Outlook 2025 to 2035
Diamond Tool Grinding Machine Market Size and Share Forecast Outlook 2025 to 2035
Burn-Wet Gas Abatement System Market Size and Share Forecast Outlook 2025 to 2035
Buried Leak Detector Market Size and Share Forecast Outlook 2025 to 2035
Dental Laboratory Market Size and Share Forecast Outlook 2025 to 2035
Burner Washers for Waste Gas Treatment Market Size and Share Forecast Outlook 2025 to 2035
Diamond Wall Saw Market Size and Share Forecast Outlook 2025 to 2035
Dental Matrix Systems Market Size and Share Forecast Outlook 2025 to 2035
Dental Permanent Cements Market Size and Share Forecast Outlook 2025 to 2035
Dental Bleaching Agent Market Size and Share Forecast Outlook 2025 to 2035
Dental Care Products Market Size and Share Forecast Outlook 2025 to 2035

Thank you!
You will receive an email from our Business Development Manager. Please be sure to check your SPAM/JUNK folder too.
Chat With
MaRIA