The burn-off oven market is experiencing consistent growth driven by increasing demand from industrial cleaning, coating removal, and equipment maintenance sectors. The market is benefiting from advancements in temperature control systems, energy efficiency technologies, and safety-enhanced designs that improve operational precision and reduce downtime.
Rising adoption across automotive, aerospace, and metal fabrication industries is supporting expansion, as manufacturers seek cost-effective and environmentally compliant solutions for residue and coating removal. Current market performance is influenced by stricter emission regulations and a growing emphasis on process sustainability, encouraging the shift toward electric and high-capacity ovens.
The future outlook remains positive, supported by modernization of industrial infrastructure, replacement of outdated thermal cleaning systems, and growing investments in automated temperature monitoring These developments are expected to enhance productivity, minimize operational hazards, and ensure compliance with industrial safety standards, collectively sustaining steady revenue growth and wider adoption of advanced burn-off ovens globally.
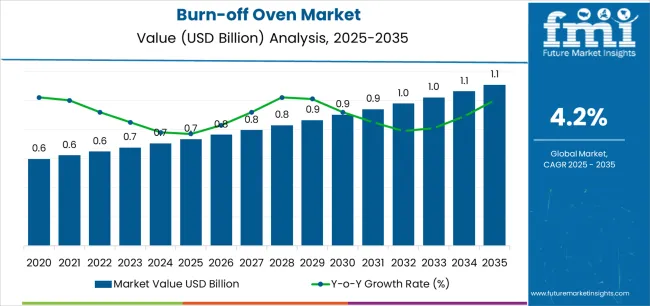
| Metric | Value |
|---|---|
| Burn-off Oven Market Estimated Value in (2025 E) | USD 0.7 billion |
| Burn-off Oven Market Forecast Value in (2035 F) | USD 1.1 billion |
| Forecast CAGR (2025 to 2035) | 4.2% |
The market is segmented by Oven Type, Capacity, Application, and End-Use and region. By Oven Type, the market is divided into Electric Burn Off Oven and Gas Fired Burn Off Oven. In terms of Capacity, the market is classified into 1000 to 2000 Kg, 500 to 1000 Kg, 2000 to 3000 Kg, and 3000 Kg. Based on Application, the market is segmented into Paint & Coating Stripping, Plastic Stripping, Auto-Parts & Engine Rebuilding, and Chemical Cleaning. By End-Use, the market is divided into Paint & Coating, Plastics, Fibers, Electric Motors, and Oil and Gas. Regionally, the market is classified into North America, Latin America, Western Europe, Eastern Europe, Balkan & Baltic Countries, Russia & Belarus, Central Asia, East Asia, South Asia & Pacific, and the Middle East & Africa.
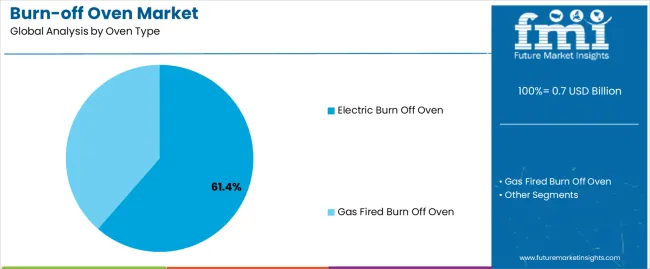
The electric burn off oven segment, accounting for 61.40% of the oven type category, has emerged as the dominant segment due to its operational efficiency, precision, and reduced environmental footprint. The segment’s strong performance is attributed to lower energy costs, improved temperature uniformity, and enhanced control features that ensure optimal cleaning results.
Demand has been reinforced by regulatory requirements favoring low-emission systems and by industries prioritizing sustainable solutions over fuel-based alternatives. Installation of electric units has become increasingly common across manufacturing and maintenance facilities seeking safer and cleaner operations.
Continuous technological advancements, such as integrated sensors and smart monitoring, are enhancing reliability and reducing maintenance needs These developments are expected to strengthen the market share of electric burn off ovens and support long-term adoption across diverse industrial applications.
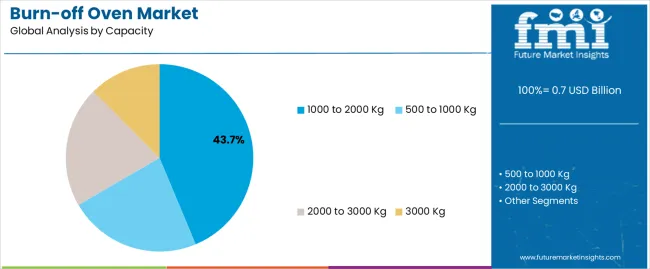
The 1000 to 2000 Kg capacity segment, representing 43.70% of the capacity category, has maintained leadership due to its suitability for medium to large-scale industrial operations requiring efficient residue and coating removal. This capacity range offers a balance between throughput, energy efficiency, and operational flexibility, making it ideal for industries handling multiple components or heavy equipment cleaning.
Manufacturers favor this range for its ability to support consistent processing cycles without compromising on temperature control or energy performance. Increasing investments in facility upgrades and the need for scalable thermal cleaning equipment have further driven adoption.
As industries continue to emphasize cost optimization and productivity enhancement, this capacity segment is expected to retain its prominence and contribute significantly to overall market growth.
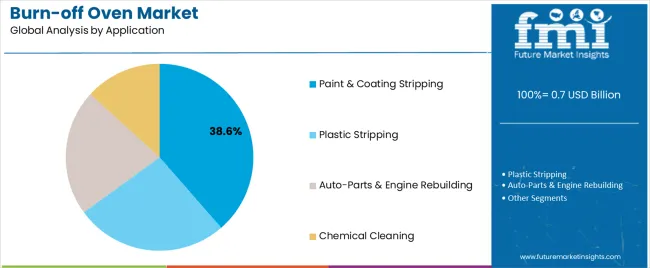
The paint and coating stripping segment, holding 38.60% of the application category, has remained dominant due to the widespread use of burn-off ovens for removing paint, powder coatings, and varnish from metal components. Industrial users prefer these systems for their effectiveness in restoring parts for reuse and reducing manual labor requirements.
Demand has been supported by expanding automotive refurbishment, aerospace maintenance, and industrial coating services. The ability of burn-off ovens to deliver uniform stripping without damaging substrates has improved process consistency and cost-efficiency.
Additionally, compliance with environmental and occupational safety standards has reinforced their acceptance in regulated industries Continued innovation in temperature automation and emission control systems is expected to enhance process reliability, supporting sustained growth of the paint and coating stripping segment in the years ahead.
Burn-off Oven Market to Expand Nearly 1.1X through 2035
The global burn-off oven market is predicted to expand around 1.1x through 2035. This is due to the escalating recognition from key players, especially from paints and coatings manufacturers.
The accumulation of coatings on racks, fixtures, hooks, and other parts not only jeopardizes grounding and transfer efficiency in coating lines but also poses concerns regarding overspray. To tackle these problems, several industrial players have adopted burn-off ovens for their efficiency in cleaning methods and environmental friendliness.
Global sales of burn-off ovens are expected to rise due to rapid expansion of the automotive and paint & coating industries. In the automotive industry, carbon removal ovens are set to be used for auto parts and engine rebuilding applications. By 2035, the total market revenue is expected to reach USD 1,062.1 million.
East Asia to Offer Vast Opportunities for Burn-off Oven Manufacturers
East Asia is expected to generate around 28.9% of the global burn-off oven market share in 2035. This is attributed to the following factors:
Robust Manufacturing Sector: East Asia is home to a robust manufacturing sector. It houses several industries, including automotive, paint & coating, and heavy machinery. As these industries continue to expand, there is an increasing demand for efficient and reliable cleaning solutions to maintain production quality and efficiency. Controlled pyrolysis burn-off ovens are well-positioned to meet this demand and cater to the needs of manufacturing facilities in the region.
Stringent Environmental Regulations: Environmental regulations in East Asia are becoming increasingly stringent. These are driving industries to adopt cleaner and more sustainable manufacturing practices. Burn-off ovens offer an eco-friendly cleaning alternative by eliminating the need for harsh chemicals and minimizing hazardous waste generation. As companies prioritize environmental compliance, demand for cleaner technologies like burn-off ovens is expected to rise, presenting significant opportunities for manufacturers in the region.
Economic Growth and Infrastructure Development: Rapid industrialization and modernization taking place in East Asia are fueling expansion of manufacturing facilities and production capacities. As companies invest in upgrading and expanding their operations, there is a growing need for advanced equipment and technologies. This presents a favorable market landscape for manufacturers looking to tap into the region's burgeoning industrial sector and establish a foothold in East Asia.
Gas Fired Burn-Off Ovens to Steal the Show
Gas-fueled burn-off ovens are expected to dominate the global burn-off oven market, with a volume share of about 53.3% in 2025. Propane and natural gas are considered ideal fuel sources for operating burn-off ovens.
The aforementioned fuels help the burners operate more cost-effectively than the ones utilizing electricity. This familiarity and proven track record make them a trusted choice for industries looking for effective cleaning and stripping solutions.
Electric burn-off ovens, on the other hand, are anticipated to witness a higher demand, rising at 6.2% CAGR during the forecast period. One of the primary advantages of electric burn-off ovens is their environmental friendliness.
Unlike gas-fueled degreasing ovens, which produce emissions during combustion, electric ovens operate without burning fossil fuels. This results in zero emissions of harmful pollutants such as carbon monoxide, nitrogen oxides, and particulate matter.
Global sales of burn-off ovens grew at a CAGR of 3.5% between 2020 and 2025. Total market revenue reached about USD 0.7 million in 2025. In the forecast period, the worldwide burn-off oven industry is set to thrive at a CAGR of 4.2%.
| Historical CAGR (2020 to 2025) | 3.5% |
|---|---|
| Forecast CAGR (2025 to 2035) | 4.2% |
The global burn-off oven market witnessed slow growth between 2020 and 2025. This was due to declining industrial output globally because of COVID-19. Also, the recovery of key industries post-pandemic had been slow, thereby reflecting the low demand for burn-off ovens.
Environmental Compliance Drives Adoption of Burn-off Ovens
Government agencies worldwide have started to implement stringent regulations for industries aimed at reducing emissions and curbing the disposal of hazardous materials & waste. They are doing so in response to concerns over environmental degradation. This regulatory landscape has compelled industries to seek cleaner and more efficient ways of cleaning parts and equipment, leading to the increasing adoption of burn-off ovens.
Burn-off ovens offer a sustainable path to traditional cleaning methods that use harsh chemicals and produce harmful emissions. By utilizing high temperatures to thermally degrade coatings and contaminants, burn-off ovens minimize the generation of hazardous waste.
They help industries comply with strict environmental standards. These ovens are also known to reduce the emission of volatile organic compounds (VOCs) and other pollutants. The aforementioned benefits are set to make them an environmentally responsible choice for cleaning operations.
Reduced Dependency on Harmful Cleaning Chemicals
In industrial operations, ensuring the safety of workers is of utmost importance. Burn-off ovens serve as a vital tool in achieving this goal.
By eliminating the need for hazardous chemicals used in traditional cleaning methods, burn-off ovens significantly reduce the risk of exposure to toxic fumes or harmful substances. These ovens also contribute to a safer work environment by reducing the potential for chemical spills or leaks, which can pose serious risks to both personnel and the surrounding environment.
The elimination of manual cleaning processes further enhances safety by minimizing the risk of injuries. Manual processes often involve repetitive tasks and exposure to sharp objects or hot surfaces.
High Energy Consumption of Burn-off Ovens
Burn-off ovens provide a superior cleaning solution compared to the traditional methods. However, substantial energy consumption associated with operating these ovens poses a significant challenge, especially in regions where energy costs are elevated.
The need for intensive heat generation to achieve optimal cleaning temperatures can lead to considerable operating expenses for companies. This is likely to impact their operational efficiency and financial viability.
Burn-off ovens offer undeniable benefits in terms of cleaning effectiveness. However, the issue of energy consumption remains a critical consideration for companies evaluating their adoption.
Operation of heat-treating ovens requires substantial heat generation to reach the temperatures necessary for effectively removing coatings and contaminants from parts. This high energy demand can result in elevated operating costs for companies, impacting overall profitability.
Requirement of Large Floor Space to Accommodate Burn-off Ovens
The installation of burn-off ovens presents a significant challenge for companies due to the substantial floor space they require. These ovens typically demand a considerable footprint, which can strain facilities with limited available areas.
The spatial requirements of burn-off ovens encompass not only the physical dimensions of the oven itself but also the necessary clearance space for safe operation. This is set to lead to easy maintenance access and compliance with regulatory standards.
For companies operating in densely populated industrial environments, finding adequate space for installing burn-off ovens can be a difficult task. Need to accommodate other essential equipment is expected to further complicate the spatial planning process.
Spatial constraints imposed by burn-off ovens can impact facility layout and workflow efficiency. Poorly planned installations may lead to congestion, hindered material flow, and reduced productivity. Hence, companies must carefully evaluate their available space.
The table below highlights revenues of key countries in the burn-off oven market. China, Japan, and the United States are expected to remain the top three consumers of burn-off ovens, with expected valuations of USD 1.1 million, USD 145.5 million, and USD 108.34 million, respectively, in 2035.
| Countries | Burn-off Oven Market Revenue (2035) |
|---|---|
| China | USD 1.1 million |
| Japan | USD 145.5 million |
| United States | USD 108.34 million |
| Germany | USD 93.47 million |
The table below shows the estimated growth rates of the leading countries. China, India, and Japan are set to record high CAGRs of 5.6%, 5.3%, and 3.2% respectively, through 2035.
| Countries | Projected Burn-off Oven Market CAGR (2025 to 2035) |
|---|---|
| China | 5.6% |
| India | 5.3% |
| Japan | 3.2% |
| United States | 2.8% |
The section below shows the gas-fired burn-off oven segment dominating based on oven type. It is forecast to thrive at 4.2% CAGR between 2025 and 2035.
| Top Segment (Product Type) | Gas Fired Burn-off Oven |
|---|---|
| Predicted CAGR (2025 to 2035) | 4.2% |
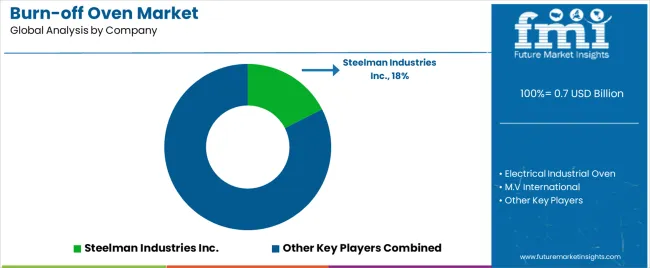
The burn-off oven market is mainly a consolidated industry. Tier 1 manufacturers account for 25% to 30% of the share at the global level. Steelman Industries Inc., Electrical Industrial Oven, M.V International, Thermal Cleaning System, Pollution Control Products, and Linhai Jinhai Coating Equipment Co. are the leading manufacturers and suppliers of burn-off ovens listed in the report.
Renowned burn-off oven manufacturers are constantly investing in research & development activities to create and introduce more efficient products. The industrial-burn off oven market is at the nascent stage. Key participants possessing strong research & development and technical capabilities are expected to offer innovative products.
Leading Companies in the Burn-off Oven Market
Armature Coil Equipment (ACE) offers burn-off ovens equipped with premium process control features and unique technology. The company’s products are extensively utilized across a wide range of industries due to their cost-effectiveness and high efficiency.
Pollution Control Products Co. provides industrial furnace and burn-off oven models to cater to stripping and cleaning needs of industries. Its product range contains DryCleaner Furnaces, InertGas Ovens, Controlled Pyrolysis Ovens, and RateControlled Ovens.
| Attribute | Details |
|---|---|
| Estimated Burn-off Oven Market Size (2025) | USD 703.9 million |
| Projected Burn-off Oven Market Size (2035) | USD 1,062.1 million |
| Anticipated Growth Rate (2025 to 2035) | 4.2% CAGR |
| Historical Data | 2020 to 2025 |
| Forecast Period | 2025 to 2035 |
| Quantitative Units | Value (USD million) and Volume (Units) |
| Report Coverage | Revenue Forecast, Volume Forecast, Company Ranking, Competitive Landscape, Growth Factors, Trends, and Pricing Analysis |
| Market Segments Covered |
Oven Type, Capacity, Application, End-use, Region |
| Regions Covered |
North America; Latin America; Western Europe; Eastern Europe; East Asia; South Asia & Pacific; Middle East & Africa |
| Key Countries Covered |
United States, Canada, Mexico, Brazil, Germany, Italy, France, United Kingdom, Spain, BENELUX, NORDICS, Poland, Hungary, Balkan and Baltics, Russia, India, Association of Southeast Asian Nations, Australia and New Zealand, China, Japan, South Korea, Kingdom of Saudi Arabia, Other GCC Countries, Türkiye, Other African Union, South Africa |
| Key Companies Profiled |
Steelman Industries Inc.; Electrical Industrial Oven; M.V International; Thermal Cleaning System; Pollution Control Products; Jackson Oven Supply; Ecoco Cleaning & Recycling; Eco Burn Off Ovens; Kalyani Enterprise; Environmental XPRT; EPTEX Coating; Armature Coil Equipment; BM Longworth; Simuwu |
The global burn-off oven market is estimated to be valued at USD 0.7 billion in 2025.
The market size for the burn-off oven market is projected to reach USD 1.1 billion by 2035.
The burn-off oven market is expected to grow at a 4.2% CAGR between 2025 and 2035.
The key product types in burn-off oven market are electric burn off oven and gas fired burn off oven.
In terms of capacity, 1000 to 2000 kg segment to command 43.7% share in the burn-off oven market in 2025.


Full Research Suite comprises of:
Market outlook & trends analysis
Interviews & case studies
Strategic recommendations
Vendor profiles & capabilities analysis
5-year forecasts
8 regions and 60+ country-level data splits
Market segment data splits
12 months of continuous data updates
DELIVERED AS:
PDF EXCEL ONLINE
Oven Bag Market Forecast and Outlook 2025 to 2035
Competitive Landscape of Oven Bag Providers
Oven Market Analysis – Growth, Demand & Forecast 2024-2034
Woven Bag Market Forecast and Outlook 2025 to 2035
Woven Medical Tape Market Size and Share Forecast Outlook 2025 to 2035
Endovenous Laser Therapy Market Size and Share Forecast Outlook 2025 to 2035
Hypoventilation Management Market - Growth & Treatment Innovations 2025 to 2035
Nonwoven Fabrics Market Size and Share Forecast Outlook 2025 to 2035
Nonwoven Filter Media Market Size and Share Forecast Outlook 2025 to 2035
Nonwoven Furniture Construction Sheeting Market Size and Share Forecast Outlook 2025 to 2035
Nonwoven Packaging Market Size and Share Forecast Outlook 2025 to 2035
Nonwoven Floor Covers Market Size and Share Forecast Outlook 2025 to 2035
Nonwoven Weed Control Fabric Market Size and Share Forecast Outlook 2025 to 2035
Nonwoven Crop Cover Market Size and Share Forecast Outlook 2025 to 2035
Nonwoven Sponges Market Size and Share Forecast Outlook 2025 to 2035
Nonwoven Air Conditioning Filter Market Size and Share Forecast Outlook 2025 to 2035
Nonwoven Flanging Market Size and Share Forecast Outlook 2025 to 2035
Nonwoven Decking Market Size and Share Forecast Outlook 2025 to 2035
Nonwoven Containers Market Size and Share Forecast Outlook 2025 to 2035
Nonwoven Baby Diaper Market Size and Share Forecast Outlook 2025 to 2035

Thank you!
You will receive an email from our Business Development Manager. Please be sure to check your SPAM/JUNK folder too.
Chat With
MaRIA