Reports

- Global Locations -

Headquarters

Future Market Insights, Inc.

Christiana Corporate, 200
Continental Drive, Suite 401,
Newark, Delaware - 19713,
United States

T: +1-845-579-5705

Americas

Future Market Insights, Inc.

616 Corporate Way, Suite 2-9018,
Valley Cottage, NY 10989, United States

T: +1-347-918-3531

MEA

Future Market Insights

1602-6 Jumeirah Bay X2 Tower, Plot No: JLT-PH2-X2A,
Jumeirah Lakes Towers, Dubai,
United Arab Emirates

Europe

Future Market Insights

3rd Floor, 207 Regent Street,
W1B 3HH London
United Kingdom

T: + 44 (0) 20 8123 9659
D: +44 (0) 20 3287 4268

Asia Pacific

Future Market Insights

IndiaLand Global Tech Park, Unit UG-1, Behind Grand HighStreet, Phase 1, Hinjawadi, MH, Pune – 411057, India

Endovenous Laser Therapy Market Snapshot (2022 to 2031)

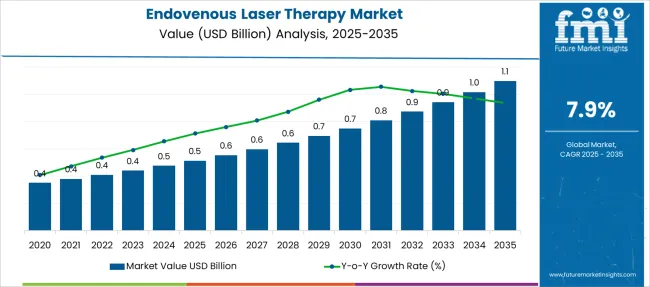
[151 Pages Report] The global Endovenous Laser Therapy Market was valued at US$ 378.3 Million in 2021 and is expected to reach US$ 811.0 Million by 2031, finds `Future Market Insights (FMI) in a recent market survey.

Endovenous Laser Therapy Market Outlook:

Data Points Market Insights
Market Value 2021 USD 378.3 Million
Market Value 2022 USD 407.6 Million
Market Value 2031 USD 811.0 Million
CAGR 2022 to 2031 7.9%
Key Players The key players in AngioDynamics, Inc., Syneron Medical Ltd., Dornier MedTech GmbH, Alma Lasers Ltd., Alna-Medical system GmbH, LSO Medical, Wontech Co., Ltd., intros Medical Laser GmbH and Energist Ltd
Share of Top 5 Countries 59.7%

The growing prevalence of varicose veins and the availability of user-friendly devices are expected to be primary factors driving the endovenous laser therapy market over the forecast period.

In addition, more and more patients are shifting towards advanced laser therapy from traditional treatment options to avoid unwanted injuries and complications, which is supporting the growth of the endovenous laser therapy market.

Also, the global rise in the rate of obesity is expected to increase the demand for endovenous laser therapy devices, thus driving the global endovenous laser therapy market.

The endovenous laser therapy market holds a 3.8% revenue share of the US$ 10 Billion laser therapy market in 2021. Therefore, the demand for laser systems is on the rise as many patients are adopting minimally invasive procedures such as laser therapy to avoid any further complications.

Moreover, the continuous launch of new and improved products and increasing investment in research and development by the manufacturers of endovenous laser therapy devices would lead to the growth of the global market over the forecast period.

For instance, in April 2021, Alma, unveiled the new Alma PrimeXTM platform today, during a worldwide LIVE launch event, which was broadcasted from its headquarters studio.

Driven by this, sales of endovenous laser therapy are expected to rise at a 7.9% CAGR through 2031.

Don't pay for what you don't need

Customize your report by selecting specific countries or regions and save 30%!

How The Market Progressed Till June 2022?

Particulars Details
H1, 2021 7.25%
H1, 2022 Projected 7.83%
H1, 2022 Outlook 7.53%
BPS Change - H1, 2022 (O) - H1, 2022 (P) (-) 30 ↓
BPS Change - H1, 2022 (O) - H1, 2021 (+) 28 ↑

The comparative analysis and market growth rate of the global endovenous laser therapy market as studied by Future Market Insights’ will show a negative BPS growth in the H1-2022 outlook as compared to the H1-2022 projected period by 30 BPS.

The market is subject to changes as per macro and industry standards. Factors that affect the market dynamics are related to side effects and postoperative complications. Moreover, the availability of alternative treatments such as traditional vein surgery affects the adoption of endovenous laser therapy. All these factors are responsible for the observed reduction in the BPS values.

However, a positive BPS growth is expected in H1-2022 over H1- 2021 duration with 28 Basis Point Share (BPS). The reasons for the surge in the market is due to high prevalence of varicose veins, the availability of user-friendly featured devices, and the adoption of minimally invasive devices. Additionally, top players are constantly launching new and improved products and increasing funding in research and development to propel market growth.

2016 to 2021 Endovenous Laser Therapy Market Demand Outlook Compared to 2022 to 2031 Forecast

Sales of endovenous laser therapy grew at a CAGR of 6.7% between 2016 and 2021.

The rapid increase in the number of patients suffering from varicose veins is one of the key factors anticipated to strengthen the demand and growth of the endovenous laser therapy market. Varicose veins are more common in female patients than in male patients. In addition, rising cases of varicose veins because of the growing aging population is a common problem worldwide. Shifting towards an unhealthy lifestyle can as well lead to varicose veins.

Endovenous Laser Therapy Market

Some other factors creating a positive impact on the market are the fast and effective procedures offered by endovenous laser therapy for the treatment of varicose veins over traditional vein surgery. The procedure needs only local anesthesia with minimal discomfort. Also, the therapy has a high success rate. These factors increase the adoption of endovenous laser therapy which in turn leads to market growth.

In addition, the major manufacturers present in the global market are focusing on offering user-friendly equipment to end users for reducing the chances of manual errors. Devices with features such as an intuitive user interface with portable devices & lesser buttons, data storage, and faster procedure setup are being offered by manufacturers to attract a larger customer base. This is anticipated to boost the adoption and demand for the endovenous laser therapy market.

Considering this, FMI expects the global endovenous laser therapy to grow at a CAGR of 7.9% through 2031

Which Factors Are Restraining Demand for Endovenous Laser Therapy?

The availability of alternative treatments and the side effects associated with endovenous laser therapy are the major factors anticipated to hamper the growth of the market.

Although endovenous laser therapy is a simple and safe way to treat varicose veins, the possibility of suffering from potential but rare side effects cannot be neglected. The most common side effect of this treatment method is aching and bruising at the puncture site, temporary numbness in the leg, or pain or inflammation in the length of the vein treated which may persist for up to 2 weeks in some patients.

Also, besides endovenous laser therapy, there are many other medical procedures available to treat varicose veins which will restrain the growth of this market. Treatment options such as sclerotherapy, high ligation, and vein stripping are being implemented to treat varicose veins across the globe. Although there are no oral or topical drugs of proven efficacy for venous disease, still many patients rely on drugs for the management and treatment of varicose veins. These options reduce the adoption of endovenous laser therapy thus hindering market growth.

What is the Impact of the COVID-19 Crisis on the Endovenous Laser Therapy Market?

The COVID-19 pandemic was projected to have a major impact on the development of the studied market. The market observed a huge slowdown in its growth due to the spread of the Covid-19 pandemic worldwide. Along with the effects of COVID-19 on public health, there was the subsequent effect of near? universal cancelation and disruption of surgical facilities, which had unprecedented effects on patients with surgical conditions and surgical services.

However, in the post-COVID-19 situation, the increasing cases of varicose veins were expected to drive the market. As recovery began in 2021, key players started to improve their positions through capacity utilization, production expansion, and collaborations with other players in 2021. Also, hospitals and ambulatory surgical centers were focusing on maintaining covid norms in order to prevent infections while performing surgeries.
Sabyasachi Ghosh
Sabyasachi Ghosh

Principal Consultant

Talk to Analyst

Find your sweet spots for generating winning opportunities in this market.

Country-wise Insights

What Makes the USA a Large Market for Endovenous Laser Therapy?

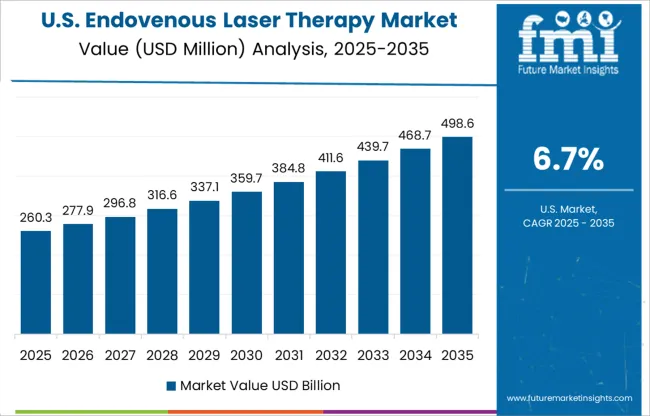
The USA accounted for nearly 90.5% of the North American endovenous laser therapy market in 2021. The growth can be attributed to the increasing number of cases of varicose veins.

For example, as per the American Vein and Lymphatic Society, about 40 million people suffer from varicose veins in 2019, in the USA Also, the increase in the prevalence of obesity and increasing FDA approvals are expected to drive the sales in the USA Furthermore, the technological advancement in laser therapy and favorable reimbursement scenario are some other factors responsible for the growth of the market.
Why Germany is considered a Lucrative Market?

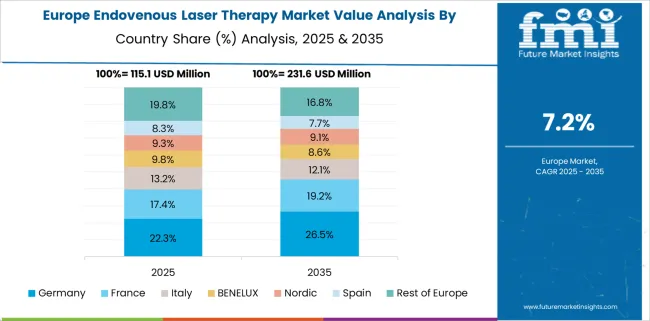
Germany accounted for 19.8% of the Europe endovenous laser therapy market in Europe in 2021. The rising availability of technologically advanced equipment in European countries like Germany is expected to drive the sales of the market during the forecast period. 

In Germany, most healthcare treatment is provided under the public health systems, and the government is deliberately providing subsidies for healthcare treatment. This is an additional factor leading to market growth in Germany. Moreover, increasing awareness regarding the treatment of varicose veins is expected to fuel the demand in Germany.

What are the Factors Fueling the Demand for Endovenous Laser Therapy in China?

The endovenous laser therapy market in China was worth US$ 18.5 Million in 2021.

The increase in the need for varicose veins treatment in China due to the growing number of people suffering from varicose veins is expected to lead to a rise in the utilization of endovenous laser systems in China, thus resulting in the growth of the market in China. In addition, rapid development in laser technology in the country with an increasing number of local players in China is leading to market development during the forecast period.

How will the Endovenous Laser Therapy Market Expand Across Japan?

Demand for endovenous laser therapy in Japan is expected to rise at an impressive 7.0% CAGR over the forecast period.

The need for early treatment for varicose veins due to the rising geriatric population in Japan is expected to be the primary factor driving the market in the country. Moreover, increasing government initiatives to increase awareness regarding laser therapy is likely to support the growth of the market. An increasing number of product launches in the country will add to the development of the market.

What is the market Outlook in India?

India accounted for 25.3% of the endovenous laser therapy market in Asia Pacific in 2021. The demand for the market in India is due to the rise in the obese population in the country.

Obesity is one of the factors responsible for varicose veins. Unhealthy diet and urbanization of lifestyle lead to obesity. Thus, a rise in the obese population is likely to drive the market in India. In addition, developed infrastructure and increasing disposable income in India are some factors increasing the adoption of laser treatment in the country.

Category-wise Insights

Demand for Endovenous Laser Systems to continue gaining Traction

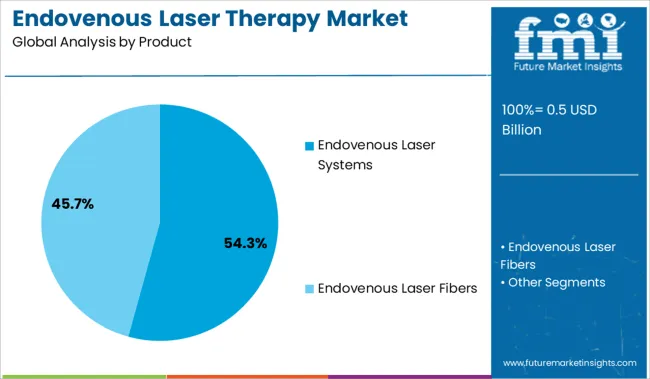
By product, the endovenous laser systems segment held the maximum share of 92.0% in 2021, expanding at a rapid rate during the forecast period.  The increase in demand for early treatment due to the rising number of varicose veins cases and the availability of technologically advanced products are primary factors responsible for the growth of the segment over the forecast period.

Moreover, an increase in Research and Development expenditure in several countries is leading to an increase in the number of product launches with advanced features which in turn is increasing the adoption of endovenous laser systems for the treatment of varicose veins. Due to the increasing need for minimally invasive procedures and minimal discomfort from procedures, several patients are adopting laser therapy over traditional treatments, which is adding to segment growth.

Why Ambulatory Surgical Centers Projected Maximum Growth in the Endovenous laser therapy Market?

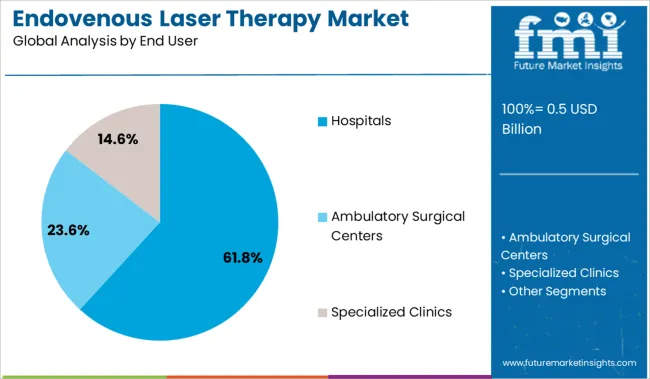
By end user, the ambulatory surgical center's segment held the maximum share of 36.2% in 2021, expanding at a rapid rate during the forecast period due to the increasing adoption rate of endovenous laser therapy in ASCs as it is a minimally invasive procedure and is completed in approximately 30-45 minutes.

Furthermore, the continuous innovations in the medical industry are leading to more and more procedures being performed in an outpatient setting rather than in hospitals. In recent years, the number of ambulatory surgical centers has risen due to a rise in demand from the major players in surgical care. physicians, patients, and insurers.

In addition, over 50% of all outpatient surgeries were performed in ASCs (ambulatory surgery centers) in 2017, which is expected to rise by 6-7% as per the Ambulatory Surgery Center Association and ASCA Foundation. This is expected to lead to the development of the segment.
Get the data you need at a Fraction of the cost

Personalize your report by choosing insights you need
and save 40%!

Competitive Landscape

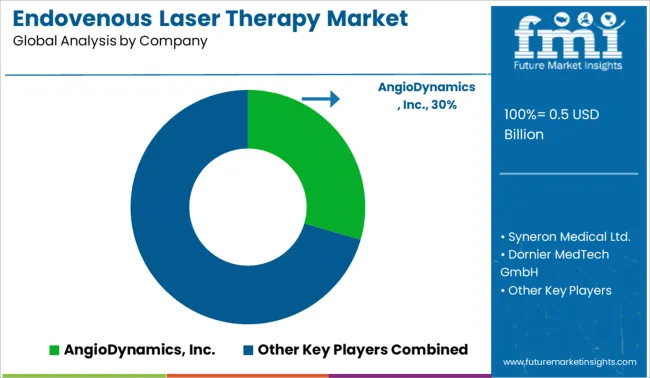
Companies operating in the endovenous laser therapy market are fragmented by nature, with a large number of global and local competitors. These players are involved in a number of strategic alliances. The product launch, FD approval, and acquisition accelerate the manufacturer’s strategy to capitalize on the market share and capture a significant share of the market. Some of the recent instances include:

  • In June 2021, AngioDynamics, Inc. announced that it has received 510(k) clearance from the United States Food and Drug Administration (FDA) for the AlphaVac Mechanical Thrombectomy System, an off-circuit, multi-purpose mechanical aspiration thrombectomy device for the non-surgical removal of thrombi or emboli from the vasculature.
  • In November 2018, Alma announced it has completed the first step of acquiring its Israeli distributor Nova Medical, extending its business outreach and establishing a direct operation in Israel.

Scope of the Report

Attribute Details
Forecast Period 2022 to 2031
Historical Data Available for 2016 to 2021
Market Analysis USD Million for Value and Volume in Units
Key Countries Covered The USA, Canada, Germany, The UK, France, Italy, Spain, BENELUX, Russia, China, Japan, South Korea, India, Thailand, Malaysia, Indonesia, Australia, New Zealand, GCC Countries, Turkey, South Africa
Key Segments Covered Product, End User, and Region
Key Companies Profiled
  • AngioDynamics, Inc.
  • Syneron Medical Ltd.
  • Dornier MedTech GmbH
  • Alma Lasers Ltd.
  • Alna-Medical system GmbH
  • LSO Medical
  • Wontech Co., Ltd.
  • intros Medical Laser GmbH
  • Energist Ltd.
Report Coverage Market Forecast, Competition Intelligence, DROT Analysis, Market Dynamics and Challenges, Strategic Growth Initiatives
Customization & Pricing Available upon Request

Endovenous laser therapy Market by Category

By Product:

  • Endovenous Laser Systems
    • Diode Lasers
    • Yag Lasers
  • Endovenous Laser Fibers
    • Bare Tip Laser Fibers
    • Radial Tip Laser Fiber
    • Gold tip Laser Fiber

By End User:

  • Hospitals
  • Ambulatory Surgical Centers
  • Specialized Clinics

By Region:

  • North America
  • Latin America
  • Western Europe
  • Eastern Europe
  • Asia Pacific Excluding Japan
  • Japan
  • Middle East & Africa (MEA)

Frequently Asked Questions

What are the factors driving demand outlook of the global Endovenous laser therapy?

The global endovenous laser therapy market is projected to reflect high demand in the forecast period with a CAGR of 7.9% owing to the growing caseload for varicose veins and the availability of user-friendly devices.

What was last 5 year market CAGR?

The sales of endovenous laser therapy in the market have grown at a CAGR of nearly 6.7% between 2016 and 2021. The increasing prevalence of obesity together with the growing geriatric population has boosted the demand for endovenous laser therapy.

Which is the most lucrative market for endovenous laser therapy market?

North America currently holds the largest market share in endovenous laser therapy. North America held 42.7% of the global market share in the endovenous laser therapy market with the USA being the leading contributor with a market value of over US$ 146.1 Million in 2021.

How likely is the endovenous laser therapy market to grow in China?

Endovenous laser therapy in China is likely to hold a share of 35.3% during the forecast period of the East Asian market for endovenous laser therapy. The increase in the need for varicose veins treatment in China due to the growing number of people suffering from varicose veins is expected to lead to rising in the utilization of endovenous laser systems in China, thus resulting in the growth of the market in China.

What are key trends driving sales of endovenous laser therapy?

Availability of novel endovenous laser treatment system, rapid adoption of laser systems by clinics and increased expertise are key trends driving sales of Endovenous laser therapy market across the globe.

What are the key market statistics in India and Japan?

India’s endovenous laser therapy market is offering lucrative growth opportunities and is expected to exhibit healthy growth of 8.2% CAGR during the forecast period. Japan's market is expected to exhibit healthy growth of 7.0% CAGR during the forecast period.

What are the top 5 countries driving demand for Endovenous laser therapy market?

The USA, Japan, China, Canada, and Russia are the top 5 countries that are driving the demand for the endovenous laser therapy market.

Which are leading companies of Endovenous laser therapy market?

Leading companies of endovenous laser therapy are AngioDynamics, Inc., Syneron Medical Ltd., Dornier MedTech GmbH, Alma Lasers Ltd., Alna-Medical System GmbH, LSO Medical, Wontech Co., Ltd., intros Medical Laser GmbH and Energist Ltd.

Table of Content

1. Executive Summary | Endovenous Laser Therapy Market

    1.1. Global Market Outlook

    1.2. Demand Side Trends

    1.3. Supply Side Trends

    1.4. Analysis and Recommendations

2. Market Overview

    2.1. Market Coverage / Taxonomy

    2.2. Market Definition / Scope / Limitations

    2.3. Inclusions and Exclusions

3. Key Market Trends

    3.1. Key Trends Impacting the Market

    3.2. Product Innovation / Development Trends

4. Market Context

    4.1. Disease Epidemiology

    4.2. Product Adoption analysis

    4.3. Recent Product Launches and Approval

    4.4. Key Regulatory Scenario

    4.5. Key Manufacturers Promotional Strategies

5. Market Background

    5.1. Macro-Economic Factors

        5.1.1. Global GDP Growth Outlook

        5.1.2. Global Healthcare Spending Outlook

        5.1.3. Per Capita Healthcare Expenditure Outlook

    5.2. Forecast Factors - Relevance & Impact

        5.2.1. Growing Caseload for Varicose Veins

        5.2.2. Increasing Prevalence of Obesity

        5.2.3. New product launches

        5.2.4. Regulatory Dynamics

        5.2.5. Cost Impact

    5.3. Market Dynamics

        5.3.1. Drivers

        5.3.2. Restraints

        5.3.3. Opportunity Analysis

6. COVID19 Crisis Analysis

    6.1. Current COVID19 perspective and Probable Future Impact

    6.2. Current GDP Projection and Probable Impact

    6.3. Current Economic Projection as Compared to 2008 Economic Analysis

    6.4. COVID19 and Impact Analysis

        6.4.1. Revenue By Product

        6.4.2. Revenue By End User

        6.4.3. Revenue By Region

    6.5. 2021 Market Scenario

7. Global Market Demand (in Volume Units) Analysis 2016 to 2021 and Forecast, 2022 to 2031

    7.1. Historical Market Volume (Units) Analysis, 2016 to 2021

    7.2. Current and Future Market Volume (Units) Projections, 2022 to 2031

        7.2.1. Y-o-Y Growth Trend Analysis

8. Global Market - Pricing Analysis

    8.1. Regional Pricing Analysis, By Product

9. Global Market Demand Value (US$ Million) Analysis 2016 to 2021 and Forecast, 2022 to 2031

    9.1. Historical Market Value (US$ Million) Analysis, 2016 to 2021

    9.2. Current and Future Market Value (US$ Million) Projections, 2022 to 2031

        9.2.1. Y-o-Y Growth Trend Analysis

        9.2.2. Absolute $ Opportunity Analysis

10. Global Market Analysis 2016 to 2021 and Forecast 2022 to 2031, By Product

    10.1. Introduction / Key Findings

    10.2. Historical Market Value (US$ Million) and Volume (Units) Analysis, By Product, 2016 to 2021

    10.3. Current and Future Market Value (US$ Million) and Volume (Units) Analysis and Forecast By Product, 2022 to 2031

            10.3.1.1. Endovenous Laser Systems

                10.3.1.1.1. Diode Lasers

                10.3.1.1.2. YAG Lasers

            10.3.1.2. Endovenous laser Fibers

                10.3.1.2.1. Bare Tip Laser Fiber

                10.3.1.2.2. Radial Tip Laser Fiber

                10.3.1.2.3. Gold Tip Laser Fiber

    10.4. Market Attractiveness Analysis, By Product

11. Global Market Analysis 2016 to 2021 and Forecast 2022 to 2031, By End User

    11.1. Introduction / Key Findings

    11.2. Historical Market Value (US$ Million) Analysis, By End User, 2016 to 2021

    11.3. Current and Future Market Value (US$ Million) Analysis and Forecast By End User, 2022 to 2031

        11.3.1. Hospitals

        11.3.2. Ambulatory Surgical Centers

        11.3.3. Specialized Clinics

    11.4. Market Attractiveness Analysis, By End User

12. Global Market Analysis 2016 to 2021 and Forecast 2022 to 2031, By Region

    12.1. Introduction / Key Findings

    12.2. Historical Market Value (US$ Million) and Volume (Units) Analysis, By Region, 2016 to 2021

    12.3. Current and Future Market Value (US$ Million) and Volume (Units) Analysis and Forecast By Region, 2022 to 2031

        12.3.1. North America

        12.3.2. Latin America

        12.3.3. Europe

        12.3.4. South Asia

        12.3.5. East Asia

        12.3.6. Oceania

        12.3.7. Middle East & Africa (MEA)

    12.4. Market Attractiveness Analysis, By Region

13. North America Market Analysis 2016 to 2021 and Forecast 2022 to 2031

    13.1. Introduction

    13.2. Historical Market Value (US$ Million) and Volume (Units) Analysis, By Market Taxonomy, 2016 to 2021

    13.3. Current and Future Market Value (US$ Million) and Volume (Units) Analysis and Forecast By Market Taxonomy, 2022 to 2031

        13.3.1.  By Country

            13.3.1.1. The USA

            13.3.1.2. Canada

        13.3.2. By Product

        13.3.3. By End User

    13.4. Market Attractiveness Analysis

    13.5. Drivers and Restraints - Impact Analysis

14. Latin America Market Analysis 2016 to 2021 and Forecast 2022 to 2031

    14.1. Introduction

    14.2. Historical Market Value (US$ Million) and Volume (Units) Analysis, By Market Taxonomy, 2016 to 2021

    14.3. Current and Future Market Value (US$ Million) and Volume (Units) Analysis and Forecast By Market Taxonomy, 2022 to 2031

        14.3.1.  By Country

            14.3.1.1. Brazil

            14.3.1.2. Mexico

            14.3.1.3. Argentina

            14.3.1.4. Rest of Latin America

        14.3.2. By Product

        14.3.3. By End User

    14.4. Market Attractiveness Analysis

    14.5. Drivers and Restraints - Impact Analysis

15. Europe Market Analysis 2016 to 2021 and Forecast 2022 to 2031

    15.1. Introduction

    15.2. Historical Market Value (US$ Million) and Volume (Units) Analysis, By Market Taxonomy, 2016 to 2021

    15.3. Current and Future Market Value (US$ Million) and Volume (Units) Analysis and Forecast By Market Taxonomy, 2022 to 2031

        15.3.1.  By Country

            15.3.1.1. Germany

            15.3.1.2. Italy

            15.3.1.3. France

            15.3.1.4. The UK

            15.3.1.5. Spain

            15.3.1.6. BENELUX

            15.3.1.7. Russia

            15.3.1.8. Rest of Europe

        15.3.2. By Product

        15.3.3. By End User

    15.4. Market Attractiveness Analysis

    15.5. Drivers and Restraints - Impact Analysis

16. South Asia Market Analysis 2016 to 2021 and Forecast 2022 to 2031

    16.1. Introduction

    16.2. Historical Market Value (US$ Million) and Volume (Units) Analysis, By Market Taxonomy, 2016 to 2021

    16.3. Current and Future Market Value (US$ Million) and Volume (Units) Analysis and Forecast By Market Taxonomy, 2022 to 2031

        16.3.1.  By Country

            16.3.1.1. India

            16.3.1.2. Thailand

            16.3.1.3. Indonesia

            16.3.1.4. Malaysia

            16.3.1.5. Rest of South Asia

        16.3.2. By Product

        16.3.3. By End User

    16.4. Market Attractiveness Analysis

    16.5. Key Market Participants - Intensity Mapping

    16.6. Drivers and Restraints - Impact Analysis

17. East Asia Market Analysis 2016 to 2021 and Forecast 2022 to 2031

    17.1. Introduction

    17.2. Historical Market Value (US$ Million) and Volume (Units) Analysis, By Market Taxonomy, 2016 to 2021

    17.3. Current and Future Market Value (US$ Million) and Volume (Units) Analysis and Forecast By Market Taxonomy, 2022 to 2031

        17.3.1.  By Country

            17.3.1.1. China

            17.3.1.2. Japan

            17.3.1.3. South Korea

        17.3.2. By Product

        17.3.3. By End User

    17.4. Market Attractiveness Analysis

    17.5. Drivers and Restraints - Impact Analysis

18. Oceania Market Analysis 2016 to 2021 and Forecast 2022 to 2031

    18.1. Introduction

    18.2. Historical Market Value (US$ Million) and Volume (Units) Analysis, By Market Taxonomy, 2016 to 2021

    18.3. Current and Future Market Value (US$ Million) and Volume (Units) Analysis and Forecast By Market Taxonomy, 2022 to 2031

        18.3.1.  By Country

            18.3.1.1. Australia

            18.3.1.2. New Zealand

        18.3.2. By Product

        18.3.3. By End User

    18.4. Market Attractiveness Analysis

    18.5. Drivers and Restraints - Impact Analysis

19. Middle East and Africa Market Analysis 2016 to 2021 and Forecast 2022 to 2031

    19.1. Introduction

    19.2. Historical Market Value (US$ Million) and Volume (Units) Analysis, By Market Taxonomy, 2016 to 2021

    19.3. Current and Future Market Value (US$ Million) and Volume (Units) Analysis and Forecast By Market Taxonomy, 2022 to 2031

        19.3.1. By Country

            19.3.1.1. GCC Countries

            19.3.1.2. Turkey

            19.3.1.3. South Africa

            19.3.1.4. Rest of Middle East and Africa

        19.3.2. By Product

        19.3.3. By End User

    19.4. Market Attractiveness Analysis

    19.5. Drivers and Restraints - Impact Analysis

20. Country Level Market Analysis 2016 to 2021 and Forecast 2022 to 2031

    20.1. Introduction

        20.1.1. Market Value Proportion Analysis

        20.1.2. Global VS. Country Growth Comparison

        20.1.3. Pricing Analysis, by Country 

    20.2. The USA Market Analysis

        20.2.1. By Product

        20.2.2. By End User

    20.3. Canada Market Analysis

        20.3.1. By Product

        20.3.2. By End User

    20.4. Brazil Market Analysis

        20.4.1. By Product

        20.4.2. By End User

    20.5. Mexico Market Analysis

        20.5.1. By Product

        20.5.2. By End User 

    20.6. Argentina Market Analysis

        20.6.1. By Product

        20.6.2. By End User

    20.7. The UK Market Analysis

        20.7.1. By Product

        20.7.2. By End User

    20.8. Germany Market Analysis

        20.8.1. By Product

        20.8.2. By End User

    20.9. France Market Analysis

        20.9.1. By Product

        20.9.2. By End User

    20.10. Italy Market Analysis

        20.10.1. By Product

        20.10.2. By End User

    20.11. Spain Market Analysis

        20.11.1. By Product

        20.11.2. By End User

    20.12. Russia Market Analysis

        20.12.1. By Product

        20.12.2. By End User

    20.13. BENELUX Market Analysis

        20.13.1. By Product

        20.13.2. By End User

    20.14. China Market Analysis

        20.14.1. By Product

        20.14.2. By End User

    20.15. Japan Market Analysis

        20.15.1. By Product

        20.15.2. By End User

    20.16. South Korea Market Analysis

        20.16.1. By Product

        20.16.2. By End User

    20.17. India Market Analysis

        20.17.1. By Product

        20.17.2. By End User

    20.18. Thailand Market Analysis

        20.18.1. By Product

        20.18.2. By End User

    20.19. Malaysia Market Analysis

        20.19.1. By Product

        20.19.2. By End User

    20.20. Indonesia Market Analysis

        20.20.1. By Product

        20.20.2. By End User

    20.21. Australia Market Analysis

        20.21.1. By Product

        20.21.2. By End User

    20.22. New Zealand Market Analysis

        20.22.1. By Product

        20.22.2. By End User

    20.23. GCC Countries Market Analysis

        20.23.1. By Product

        20.23.2. By End User

    20.24. South Africa Market Analysis

        20.24.1. By Product

        20.24.2. By End User

    20.25. Turkey Market Analysis

        20.25.1. By Product

        20.25.2. By End User

21. Market Structure Analysis

    21.1. Market Analysis by Tier of Companies

    21.2. Market Share Analysis of Top Players

    21.3. Market Concentration

    21.4. Market Presence Analysis

        21.4.1. Regional Footprint of Players

        21.4.2. Product Footprint of Players

         21.4.3. Channel footprint of players

22. Competition Analysis

    22.1. Competition Dashboard

    22.2. Competition Deep Dive

        22.2.1. AngioDynamics, Inc.

            22.2.1.1. Overview

            22.2.1.2. Product Portfolio

            22.2.1.3. Profitability by Market Segments (Product / Channel / Region)

            22.2.1.4. Sales Footprint

            22.2.1.5. Strategy Overview

                22.2.1.5.1. Marketing Strategy

                22.2.1.5.2. Product Strategy

                22.2.1.5.3. Channel Strategy

        22.2.2. Syneron Medical Ltd.

            22.2.2.1. Overview

            22.2.2.2. Product Portfolio

            22.2.2.3. Profitability by Market Segments (Product / Channel / Region)

            22.2.2.4. Sales Footprint

            22.2.2.5. Strategy Overview

                22.2.2.5.1. Marketing Strategy

                22.2.2.5.2. Product Strategy

                22.2.2.5.3. Channel Strategy

        22.2.3. Dornier MedTech GmbH

            22.2.3.1. Overview

            22.2.3.2. Product Portfolio

            22.2.3.3. Profitability by Market Segments (Product / Channel / Region)

            22.2.3.4. Sales Footprint

            22.2.3.5. Strategy Overview

                22.2.3.5.1. Marketing Strategy

                22.2.3.5.2. Product Strategy

                22.2.3.5.3. Channel Strategy

        22.2.4. Alma Lasers Ltd.

            22.2.4.1. Overview

            22.2.4.2. Product Portfolio

            22.2.4.3. Profitability by Market Segments (Product / Channel / Region)

            22.2.4.4. Sales Footprint

            22.2.4.5. Strategy Overview

                22.2.4.5.1. Marketing Strategy

                22.2.4.5.2. Product Strategy

                22.2.4.5.3. Channel Strategy

        22.2.5. Alna-Medical System GmbH

            22.2.5.1. Overview

            22.2.5.2. Product Portfolio

            22.2.5.3. Profitability by Market Segments (Product / Channel / Region)

            22.2.5.4. Sales Footprint

            22.2.5.5. Strategy Overview

                22.2.5.5.1. Marketing Strategy

                22.2.5.5.2. Product Strategy

                22.2.5.5.3. Channel Strategy

        22.2.6. LSO Medical

            22.2.6.1. Overview

            22.2.6.2. Product Portfolio

            22.2.6.3. Profitability by Market Segments (Product / Channel / Region)

            22.2.6.4. Sales Footprint

            22.2.6.5. Strategy Overview

                22.2.6.5.1. Marketing Strategy

                22.2.6.5.2. Product Strategy

                22.2.6.5.3. Channel Strategy

        22.2.7. Wontech Co., Ltd.

            22.2.7.1. Overview

            22.2.7.2. Product Portfolio

            22.2.7.3. Profitability by Market Segments (Product / Channel / Region)

            22.2.7.4. Sales Footprint

            22.2.7.5. Strategy Overview

                22.2.7.5.1. Marketing Strategy

                22.2.7.5.2. Product Strategy

                22.2.7.5.3. Channel Strategy

        22.2.8. intros Medical Laser GmbH

            22.2.8.1. Overview

            22.2.8.2. Product Portfolio

            22.2.8.3. Profitability by Market Segments (Product / Channel / Region)

            22.2.8.4. Sales Footprint

            22.2.8.5. Strategy Overview

                22.2.8.5.1. Marketing Strategy

                22.2.8.5.2. Product Strategy

                22.2.8.5.3. Channel Strategy

        22.2.9. Energist Ltd.

            22.2.9.1. Overview

            22.2.9.2. Product Portfolio

            22.2.9.3. Profitability by Market Segments (Product / Channel / Region)

            22.2.9.4. Sales Footprint

            22.2.9.5. Strategy Overview

                22.2.9.5.1. Marketing Strategy

                22.2.9.5.2. Product Strategy

                22.2.9.5.3. Channel Strategy

23. Assumptions and Acronyms Used

24. Research Methodology

Don't pay for what you don't need

Customize your report by selecting specific countries or regions and save 30%!

List of Tables

Table 01: Global Market Value (US$ Million) Analysis 2016 to 2021 and Forecast 2022 to 2031, By Product

Table 02: Global Market Volume (Units) Analysis 2016 to 2021 and Forecast 2022 to 2031, By Product

Table 03: Global Market Value (US$ Million) Analysis 2016 to 2021 and Forecast 2022 to 2031, By End User

Table 04: Global Market Value (US$ Million) Analysis 2016 to 2021 and Forecast 2022 to 2031, By Region

Table 05: North America Market Value (US$ Million) Analysis 2016 to 2021 and Forecast 2022 to 2031, By Country

Table 06: North America Market Value (US$ Million) Analysis 2016 to 2021 and Forecast 2022 to 2031, By Product

Table 07: North America Market Volume (Units) Analysis 2016 to 2021 and Forecast 2022 to 2031, By Product

Table 08: North America Market Value (US$ Million) Analysis 2016 to 2021 and Forecast 2022 to 2031, By End User

Table 09: Latin America Market Value (US$ Million) Analysis 2016 to 2021 and Forecast 2022 to 2031, By Country

Table 10: Latin America Market Value (US$ Million) Analysis 2016 to 2021 and Forecast 2022 to 2031, By Product

Table 11: Latin America Market Volume (Units) Analysis 2016 to 2021 and Forecast 2022 to 2031, By Product

Table 12: Latin America Market Volume (Units) Analysis 2016 to 2021 and Forecast 2022 to 2031, By Product

Table 13: Latin America Market Value (US$ Million) Analysis 2016 to 2021 and Forecast 2022 to 2031, By End User

Table 14: Europe Market Value (US$ Million) Analysis 2016 to 2021 and Forecast 2022 to 2031, By Country

Table 15: Europe Market Value (US$ Million) Analysis 2016 to 2021 and Forecast 2022 to 2031, By Product

Table 16: Europe Market Volume (Units) Analysis 2016 to 2021 and Forecast 2022 to 2031, By Product

Table 17: Europe Market Value (US$ Million) Analysis 2016 to 2021 and Forecast 2022 to 2031, By End User

Table 18: South Asia Market Value (US$ Million) Analysis 2016 to 2021 and Forecast 2022 to 2031, By Country

Table 19: South Asia Market Value (US$ Million) Analysis 2016 to 2021 and Forecast 2022 to 2031, By Product

Table 20: South Asia Market Volume (Units) Analysis 2016 to 2021 and Forecast 2022 to 2031, By Product

Table 21: South Asia Market Volume (Units) Analysis 2016 to 2021 and Forecast 2022 to 2031, By Product

Table 22: South Asia Market Value (US$ Million) Analysis 2016 to 2021 and Forecast 2022 to 2031, By End User

Table 23: East Asia Market Value (US$ Million) Analysis 2016 to 2021 and Forecast 2022 to 2031, By Country

Table 24: East Asia Market Value (US$ Million) Analysis 2016 to 2021 and Forecast 2022 to 2031, By Product

Table 25: East Asia Market Volume (Units) Analysis 2016 to 2021 and Forecast 2022 to 2031, By Product

Table 26: East Asia Market Value (US$ Million) Analysis 2016 to 2021 and Forecast 2022 to 2031, By End User

Table 27: North America Market Value (US$ Million) Analysis 2016 to 2021 and Forecast 2022 to 2031, By Country

Table 28: Oceania Market Value (US$ Million) Analysis 2016 to 2021 and Forecast 2022 to 2031, By Product

Table 29: Oceania Market Volume (Units) Analysis 2016 to 2021 and Forecast 2022 to 2031, By Product

Table 30: Oceania Market Value (US$ Million) Analysis 2016 to 2021 and Forecast 2022 to 2031, By End User

Table 31: Middle East and Africa Market Value (US$ Million) Analysis 2016 to 2021 and Forecast 2022 to 2031, By Country

Table 32: Middle East and Africa Market Value (US$ Million) Analysis 2016 to 2021 and Forecast 2022 to 2031, By Product

Table 33: Middle East and Africa Market Volume (Units) Analysis 2016 to 2021 and Forecast 2022 to 2031, By Product

Table 34: Middle East and Africa Market Value (US$ Million) Analysis 2016 to 2021 and Forecast 2022 to 2031, By End User
Sabyasachi Ghosh
Sabyasachi Ghosh

Principal Consultant

Talk to Analyst

Find your sweet spots for generating winning opportunities in this market.

List of Charts

Figure 01: Global Market Share 2022E, by Product

Figure 02: Global Market Share 2022E, by End User

Figure 03: Global Market Share 2022E, by Region

Figure 04: Global Market Volume (Units) Analysis, 2016 to 2021

Figure 05: Global Market Volume (Units) & Y-o-Y Growth (%), 2022 to 2031

Figure 06: Regional Average Pricing Analysis (US$) for Product (2021)

Figure 07: Regional Average Pricing Analysis for Endovenous Laser Systems - USD (2021)

Figure 08: Regional Average Pricing Analysis for Endovenous Laser Fibers - USD (2021)

Figure 09: Regional Average Pricing Analysis Benchmark - US$ By Product (2021)

Figure 10: Global Market Value (US$ Million) Analysis, 2016 to 2021

Figure 11: Global Market Value (US$ Million) & Y-o-Y Growth (%), 2022 to 2031

Figure 12: Global Market Incremental $ Opportunity, 2022 to 2031

Figure 13: Market Analysis, By Product 2022 to 2031

Figure 14: Market Y-o-Y Growth Projections by Product, 2021 to 2031

Figure 15: Global Market Attractiveness Analysis 2016 to 2021 and Forecast 2022 to 2031, By Product

Figure 16: Global Market Analysis, By End User 2022 to 2031

Figure 17: Global Market Y-o-Y Growth Projections, By End User, 2021 to 2031

Figure 18: Global Market Attractiveness Analysis 2016 to 2021 and Forecast 2022 to 2031, By End User

Figure 19: Global Market Analysis, By Region 2022 to 2031

Figure 20: Global Market Y-o-Y Growth Projections, By Region 2021 to 2031

Figure 21: Global Market Attractiveness Analysis 2016 to 2021 and Forecast 2022 to 2031, By Region

Figure 22: North America Market Analysis, By Product (2022E)

Figure 23: North America Market Analysis, By End User (2022E)

Figure 24: North America Market Analysis, By Country (2022E)

Figure 25: North America Market Value (US$ Million), Historical, 2016 to 2021

Figure 26: North America Market Value (US$ Million), Forecast, 2022 to 2031

Figure 27: North America Market Attractiveness Analysis, By Product, 2022 to 2031

Figure 28: North America Market Attractiveness Analysis, By End User, 2022 to 2031

Figure 29: North America Market Attractiveness Analysis, By Country, 2022 to 2031

Figure 30: Latin America Market Analysis, By Product (2022E)

Figure 31: Latin America Market Analysis, By End User (2022E)

Figure 32: Latin America Market Analysis, By Country (2022E)

Figure 33: Latin America Market Value (US$ Million), Historical, 2016 to 2021

Figure 34: Latin America Market Value (US$ Million), Forecast, 2022 to 2031

Figure 35: Latin America Market Attractiveness Analysis, By Product, 2022 to 2031

Figure 36: Latin America Market Attractiveness Analysis, By End User, 2022 to 2031

Figure 37: Latin America Market Attractiveness Analysis, By Country, 2022 to 2031

Figure 38: Europe Market Analysis, By Product (2022E)

Figure 39: Europe Market Analysis, By End User (2022E)

Figure 40: Europe Market Analysis, By Country (2022E)

Figure 41: Europe Market Value (US$ Million), Historical, 2016 to 2021

Figure 42: Europe Market Value (US$ Million), Forecast, 2022 to 2031

Figure 43: Europe Market Attractiveness Analysis, By Product, 2022 to 2031

Figure 44: Europe Market Attractiveness Analysis, By End User, 2022 to 2031

Figure 45: Europe Market Attractiveness Analysis, By Country, 2022 to 2031

Figure 46: South Asia Market Analysis, By Product (2022E)

Figure 47: South Asia Market Analysis, By End User (2022E)

Figure 48: South Asia Market Analysis, By Country (2022E)

Figure 49: South Asia Market Value (US$ Million), Historical, 2016 to 2021

Figure 50: South Asia Market Value (US$ Million), Forecast, 2022 to 2031

Figure 51: South Asia Market Attractiveness Analysis, By Product, 2022 to 2031

Figure 52: South Asia Market Attractiveness Analysis, By End User, 2022 to 2031

Figure 53: South Asia Market Attractiveness Analysis, By Country, 2022 to 2031

Figure 54: East Asia Market Analysis, By Product (2022E)

Figure 55: East Asia Market Analysis, By End User (2022E)

Figure 56: East Asia Market Analysis, By Country (2022E)

Figure 57: East Asia Market Value (US$ Million), Historical, 2016 to 2021

Figure 58: East Asia Market Value (US$ Million), Forecast, 2022 to 2031

Figure 59: East Asia Market Attractiveness Analysis, By Product, 2022 to 2031

Figure 60: East Asia Market Attractiveness Analysis, By End User, 2022 to 2031

Figure 61: East Asia Market Attractiveness Analysis, By Country, 2022 to 2031

Figure 62: Oceania Market Analysis, By Product (2022E)

Figure 63: Oceania Market Analysis, By End User (2022E)

Figure 64: Oceania Market Analysis, By Country (2022E)

Figure 65: Oceania Market Value (US$ Million), Historical, 2016 to 2021

Figure 66: Oceania Market Value (US$ Million), Forecast, 2022 to 2031

Figure 67: Oceania Market Attractiveness Analysis, By Product, 2022 to 2031

Figure 68: Oceania Market Attractiveness Analysis, By End User, 2022 to 2031

Figure 69: Oceania Market Attractiveness Analysis, By Country, 2022 to 2031

Figure 70: Middle East and Africa Market Analysis, By Product (2022E)

Figure 71: Middle East and Africa Market Analysis, By End User (2022E)

Figure 72: Middle East and Africa Market Analysis, By Country (2022E)

Figure 73: Middle East and Africa Market Value (US$ Million), Historical, 2016 to 2021

Figure 74: Middle East and Africa Market Value (US$ Million), Forecast, 2022 to 2031

Figure 75: Middle East and Africa Market Attractiveness Analysis, By Product, 2022 to 2031

Figure 76: Middle East and Africa Market Attractiveness Analysis, By End User, 2022 to 2031

Figure 77: Middle East and Africa Market Attractiveness Analysis, By Country, 2022 to 2031

Figure 78: Global Market Value Proportion Analysis, By Countries, 2021

Figure 79: Global Market, Global Vs. Country Growth Y-o-Y (%) Comparison, 2022 to 2031

Figure 80: U.S Market Share Analysis (%), By Product, 2022 to 2031

Figure 81: U.S Market Share Analysis (%), By End User, 2022 to 2031

Figure 82: Global Vs. U.S Growth Comparison

Figure 83: Canada Market Share Analysis (%), By Application, 2022 to 2031

Figure 84: Canada Market Share Analysis (%), By End User, 2022 to 2031

Figure 85: Global Vs. Canada Growth Comparison

Figure 86: Brazil Market Share Analysis (%), By Application, 2022 to 2031

Figure 87: Brazil Market Share Analysis (%), By End User, 2022 to 2031

Figure 88: Global Vs. Brazil Growth Comparison

Figure 89: Mexico Market Share Analysis (%), By Application, 2022 to 2031

Figure 90: Mexico Market Share Analysis (%), By End User, 2022 to 2031

Figure 91: Global Vs. Mexico Growth Comparison

Figure 92: Argentina Market Share Analysis (%), By Application, 2022 to 2031

Figure 93: Argentina Market Share Analysis (%), By End User, 2022 to 2031

Figure 94: Global Vs. Argentina Growth Comparison

Figure 95: The UK Market Share Analysis (%), By Application, 2022 to 2031

Figure 96: The UK Market Share Analysis (%), By End User, 2022 to 2031

Figure 97: Global Vs. The UK Growth Comparison

Figure 98: Germany Market Share Analysis (%), By Application, 2022 to 2031

Figure 99: Germany Market Share Analysis (%), By End User, 2022 to 2031

Figure 100: Global Vs. Germany Growth Comparison

Figure 101: France Market Share Analysis (%), By Application, 2022 to 2031

Figure 102: France Market Share Analysis (%), By End User, 2022 to 2031

Figure 103: Global Vs. France Growth Comparison

Figure 104: Italy Market Share Analysis (%), By Application, 2022 to 2031

Figure 105: Italy Market Share Analysis (%), By End User, 2022 to 2031

Figure 106: Global Vs. Italy Growth Comparison

Figure 107: Spain Market Share Analysis (%), By Application, 2022 to 2031

Figure 108: Spain Market Share Analysis (%), By End User, 2022 to 2031

Figure 109: Global Vs. Spain Growth Comparison

Figure 110: Russia Market Share Analysis (%), By Application, 2022 to 2031

Figure 111: Russia Market Share Analysis (%), By End User, 2022 to 2031

Figure 112: Global Vs. Russia Growth Comparison

Figure 113: BENELUX Market Share Analysis (%), By Application, 2022 to 2031

Figure 114: BENELUX Market Share Analysis (%), By End User, 2022 to 2031

Figure 115: Global Vs. BENELUX Growth Comparison

Figure 116: China Market Share Analysis (%), By Application, 2022 to 2031

Figure 117: China Market Share Analysis (%), By End User, 2022 to 2031

Figure 118: Global Vs. China Growth Comparison

Figure 119: Japan Market Share Analysis (%), By Application, 2022 to 2031

Figure 120: Japan Market Share Analysis (%), By End User, 2022 to 2031

Figure 121: Global Vs. Japan Growth Comparison

Figure 122: South Korea Market Share Analysis (%), By Application, 2022 to 2031

Figure 123: South Korea Market Share Analysis (%), By End User, 2022 to 2031

Figure 124: Global Vs. South Korea Growth Comparison

Figure 125: India Market Share Analysis (%), By Application, 2022 to 2031

Figure 126: India Market Share Analysis (%), By End User, 2022 to 2031

Figure 127: Global Vs. India Growth Comparison

Figure 128: Thailand Market Share Analysis (%), By Application, 2022 to 2031

Figure 129: Thailand Market Share Analysis (%), By End User, 2022 to 2031

Figure 130: Global Vs. Thailand Growth Comparison

Figure 131: Malaysia Market Share Analysis (%), By Application, 2022 to 2031

Figure 132: Malaysia Market Share Analysis (%), By End User, 2022 to 2031

Figure 133: Global Vs. Malaysia Growth Comparison

Figure 134: Indonesia Market Share Analysis (%), By Application, 2022 to 2031

Figure 135: Indonesia Market Share Analysis (%), By End User, 2022 to 2031

Figure 136: Global Vs. Indonesia Growth Comparison

Figure 137: Australia Market Share Analysis (%), By Application, 2022 to 2031

Figure 138: Australia Market Share Analysis (%), By End User, 2022 to 2031

Figure 139: Global Vs. Australia Growth Comparison

Figure 140: New Zealand Market Share Analysis (%), By Application, 2022 to 2031

Figure 141: New Zealand Market Share Analysis (%), By End User, 2022 to 2031

Figure 142: Global Vs. New Zealand Growth Comparison

Figure 143: GCC Countries Market Share Analysis (%), By Application, 2022 to 2031

Figure 144: GCC Countries Market Share Analysis (%), By End User, 2022 to 2031

Figure 145: Global Vs. GCC Countries Growth Comparison

Figure 146: South Africa Market Share Analysis (%), By Application, 2022 to 2031

Figure 147: South Africa Market Share Analysis (%), By End User, 2022 to 2031

Figure 148: Global Vs. South Africa Growth Comparison

Figure 149: Turkey Market Share Analysis (%), By Application, 2022 to 2031

Figure 150: Turkey Market Share Analysis (%), By End User, 2022 to 2031

Figure 151: Global Vs. Turkey Growth Comparison

Recommendations

Healthcare

Negative Pressure Wound Therapy Market

Published : October 2023

Healthcare

Varicose Vein Treatment Market

Published : June 2023

Healthcare

Laser Therapy Devices Market

Published : May 2023

Healthcare

Ablation Devices Market

Published : January 2023

Explore Healthcare Insights

View Reports

Endovenous Laser Therapy Market