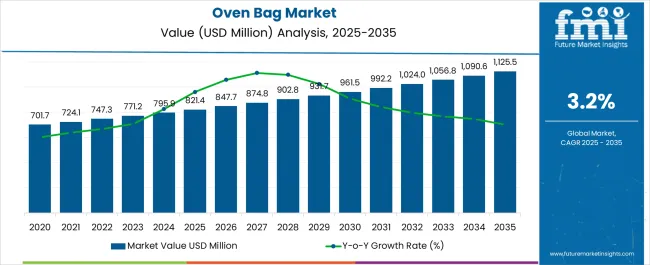
As per the updated report of Future Market Insights, our lead analyst gives a detailed analysis of the packaging market. As per the analysis, sales of oven bags hold a current valuation of USd 795.9 million in 2024.
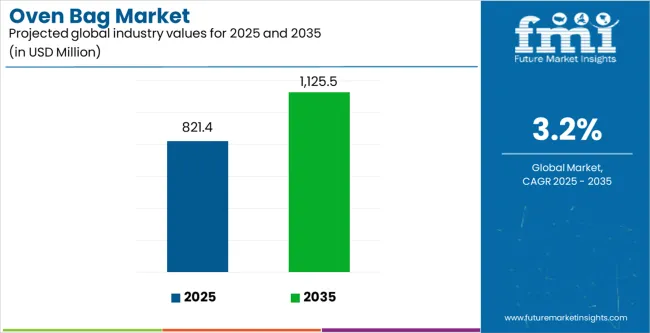
Reflecting on consumers’ expectations, oven bag producers work on simpler labels with understandable ingredients, reinforcing continuous demand. Going by this pattern, demand could rise and equate to a market valuation of USD 1,090.6 million, with a sluggish CAGR of 3.2% by 2034.
Attributes | Details |
---|---|
Oven Bag Market Value for 2024 | USD 795.9 million |
Oven Bag Market Value for 2034 | USD 1,090.6 million |
Oven Bag Market Forecast CAGR for 2024 to 2034 | 3.2% |
In 2018, the global oven bag market showed a potential worth USD 678.2 million. The oven bag market witnessed sluggish growth, registering a CAGR of 2.6% from 2018 to 2023.
Historical CAGR | 2.6% |
---|---|
Forecast CAGR | 3.2% |
Contribution to this development includes the extension of the popularity of oven-ready meals, customer desire for easy cooking solutions, and escalated knowledge of food safety and cleanliness.
Improvements in the technology of oven bags, like the incorporation of materials resistant to heat and better sealing systems, enhanced the effectiveness of the product and its market share.
With a CAGR of 2.6% predicted by FMI from 2018 to 2023, the oven bag market is contemplated to surge in the next years.
The extension of the ready-to-cook and pre-prepared meal segments, the steady trend toward time and convenience-saving cooking techniques, and the escalated use of oven bags in home and commercial food preparation settings are amplified to propel this upward trend.
Producers have a probability to concentrate on product innovation and keep up with changing consumer tastes and sustainability measures, like creating recyclable and eco-friendly materials.
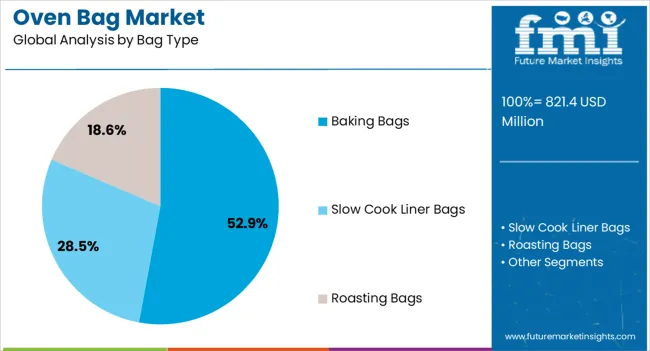
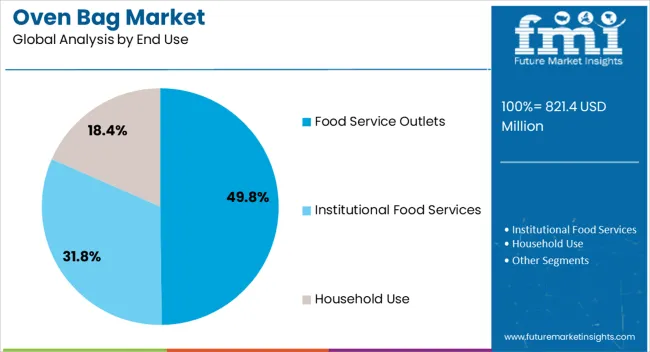
The below section shows the leading segment. Based on the bag type, the baking bag segment is accounted to hold a market share of 52.9% in 2024. Based on end-use, the food service outlets segment is accounted to hold a market share of 49.8% in 2024.
The ease of usage and adaptability of baking bags in cooking a wide range of foods exponentiates the market appeal.
Food service establishments use oven bags because of their effectiveness and reliability in cooking food.
Category | Market Share in 2024 |
---|---|
Baking Bag | 52.9% |
Food Service Outlets | 49.8% |
Based on the bag type, the baking bag sector is accounted to hold a market share of 52.9% in 2024. Baking bags are a convenient and mess-free way to cook various meals, including meats, vegetables, and sweets.
The bags are specially made for using it in baking applications. Baking bags are popular because of their adaptability, simplicity of use, and capacity in retaining tastes and juices throughout cooking.
Based on end-user, food service outlets are accounted to hold a market share of 49.8% in 2024. Food service outlets are any number of businesses that largely use oven bags for different types of cooking, including bakeries, cafes, restaurants, and catering services.
Food service establishments easily make and provide a wide variety of foods to their patrons with the use of oven bags. Oven bag usage in these establishments is considerably high.
The table describes about the top five countries ranked by revenue, with India holding the top position.
Oven bags are the most popular in India due to their extensive usage in regular cooking and holiday celebrations. Oven bags are now essential in the homes of India because of their rich culinary history and exponential need for easy cooking options.
The bags thus provide a hassle-free method of making tasty meals that enhance flavor and keep moisture.
Forecast CAGRs from 2024 to 2034
Countries | CAGR |
---|---|
United States | 2.3% |
Germany | 2% |
China | 5.7% |
Spain | 3.4% |
India | 6.5% |
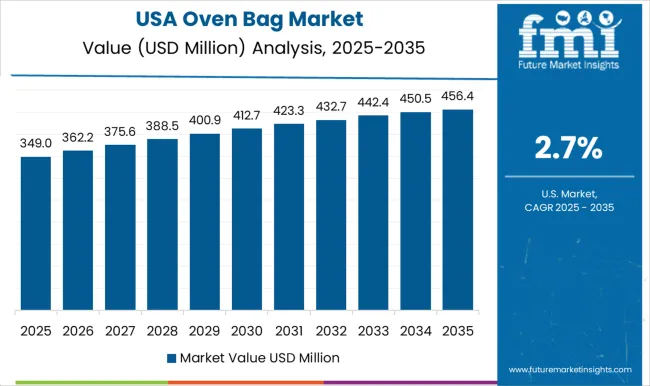
In the United States, consumers predominantly use oven bags for convenient home cooking. The bags offer a hassle-free solution for roasting meats, vegetables, and other dishes in the oven, reducing preparation time and cleanup efforts.
Busy lifestyles broadly focus on convenience, and oven bags have become a popular choice among households in America for preparing delicious and moist meals with minimal fuss.
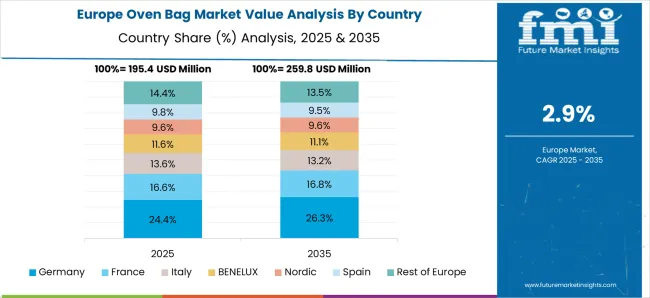
The oven bag market in Germany is often utilized for gourmet cooking and complementing the rich food culture of Germany. The population of Germany values high-quality ingredients and culinary traditions.
The oven bags offer a convenient way of enhancing flavors and retaining moisture in various dishes. For example- From succulent roasts to savory braises, oven bags cater to discerning palates and love flavorful, home-cooked meals of Germany
The oven bag market caters to the needs of urban dwellers with busy lifestyles. With rapid urbanization and a growing middle class, convenience became predominant in households in China.
Oven bags save time for cooking delicious meals without extensive preparation or cleanup. Whether roasting meats or steaming vegetables, oven bags offer the consumers of China a convenient way to enjoy home-cooked meals amidst their bustling schedules.
In Spain, the oven bag market is often used for traditional and festive cooking. The population of Spain has a culinary heritage in their genes, and oven bags play a role in preparing traditional dishes such as roasted meats, seafood, and vegetables for family gatherings and celebrations.
For example - Whether it is a special holiday meal or a casual get-together, oven bags prepare flavorful and succulent dishes central to the vibrant food culture of Spain
The oven bag market is mainly used for festive celebrations and everyday cooking. The households rely on oven bags to prepare dishes ranging from traditional curries and tandoori specialties to baked goods and roasted delicacies.
Oven bags offer the consumers of India a convenient and efficient way of creating flavorful dishes while preserving moisture and enhancing flavors whether they are celebrating festivals or cooking daily meals.
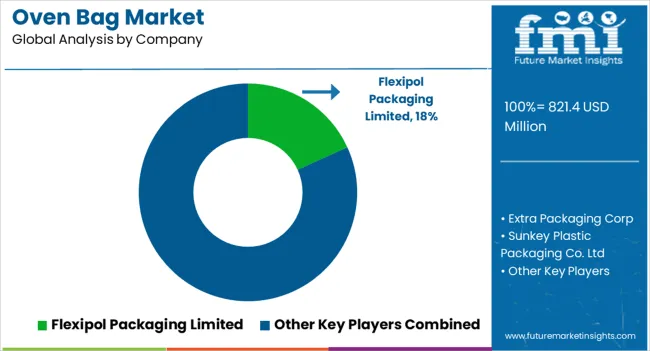
Multinational firms and local producers fight for market share that defines the competitive environment of the oven bag industry. While regional producers concentrate on specialized products or niche markets, multinational corporations use their worldwide presence and resources to maintain a sizable market share.
Some of the key developments are
Attributes | Details |
---|---|
Estimated Market Size in 2024 | USD 795.9 million |
Projected Market Valuation in 2034 | USD 1,090.6 million |
Value-based CAGR 2024 to 2034 | 3.2% |
Forecast Period | 2024 to 2034 |
Historical Data Available for | 2018 to 2023 |
Market Analysis | Value in USD million |
Key Regions Covered | North America; Latin America; Western Europe; Eastern Europe; South Asia and Pacific; East Asia; The Middle East and Africa |
Key Market Segments Covered | Material, Bag Type, End Use, Region |
Key Countries Profiled | The United States, Canada, Brazil, Mexico, Germany, The United Kingdom, France, Spain, Italy, Russia, Poland, Czech Republic, Romania, India, Bangladesh, Australia, New Zealand, China, Japan, South Korea, GCC countries, South Africa, Israel |
Key Companies Profiled | Flexipol Packaging Limited; Extra Packaging Corp; Sunkey Plastic Packaging Co. Ltd; Sirane Ltd; Terinex LTD; Yin Tian Industrial Co. Ltd; M&Q Packaging Ltd; Xiong Xian Xinhuarui Plastic Co Ltd; Huangshan Sinoflex Packaging Co. Ltd; Reynolds Consumer Products |
Table 1: Global Market Value (US$ Million) Forecast by Region, 2019 to 2034
Table 2: Global Market Volume (Unit Pack) Forecast by Region, 2019 to 2034
Table 3: Global Market Value (US$ Million) Forecast by Material, 2019 to 2034
Table 4: Global Market Volume (Unit Pack) Forecast by Material, 2019 to 2034
Table 5: Global Market Value (US$ Million) Forecast by Bag Type, 2019 to 2034
Table 6: Global Market Volume (Unit Pack) Forecast by Bag Type, 2019 to 2034
Table 7: Global Market Value (US$ Million) Forecast by End Use, 2019 to 2034
Table 8: Global Market Volume (Unit Pack) Forecast by End Use, 2019 to 2034
Table 9: North America Market Value (US$ Million) Forecast by Country, 2019 to 2034
Table 10: North America Market Volume (Unit Pack) Forecast by Country, 2019 to 2034
Table 11: North America Market Value (US$ Million) Forecast by Material, 2019 to 2034
Table 12: North America Market Volume (Unit Pack) Forecast by Material, 2019 to 2034
Table 13: North America Market Value (US$ Million) Forecast by Bag Type, 2019 to 2034
Table 14: North America Market Volume (Unit Pack) Forecast by Bag Type, 2019 to 2034
Table 15: North America Market Value (US$ Million) Forecast by End Use, 2019 to 2034
Table 16: North America Market Volume (Unit Pack) Forecast by End Use, 2019 to 2034
Table 17: Latin America Market Value (US$ Million) Forecast by Country, 2019 to 2034
Table 18: Latin America Market Volume (Unit Pack) Forecast by Country, 2019 to 2034
Table 19: Latin America Market Value (US$ Million) Forecast by Material, 2019 to 2034
Table 20: Latin America Market Volume (Unit Pack) Forecast by Material, 2019 to 2034
Table 21: Latin America Market Value (US$ Million) Forecast by Bag Type, 2019 to 2034
Table 22: Latin America Market Volume (Unit Pack) Forecast by Bag Type, 2019 to 2034
Table 23: Latin America Market Value (US$ Million) Forecast by End Use, 2019 to 2034
Table 24: Latin America Market Volume (Unit Pack) Forecast by End Use, 2019 to 2034
Table 25: Western Europe Market Value (US$ Million) Forecast by Country, 2019 to 2034
Table 26: Western Europe Market Volume (Unit Pack) Forecast by Country, 2019 to 2034
Table 27: Western Europe Market Value (US$ Million) Forecast by Material, 2019 to 2034
Table 28: Western Europe Market Volume (Unit Pack) Forecast by Material, 2019 to 2034
Table 29: Western Europe Market Value (US$ Million) Forecast by Bag Type, 2019 to 2034
Table 30: Western Europe Market Volume (Unit Pack) Forecast by Bag Type, 2019 to 2034
Table 31: Western Europe Market Value (US$ Million) Forecast by End Use, 2019 to 2034
Table 32: Western Europe Market Volume (Unit Pack) Forecast by End Use, 2019 to 2034
Table 33: Eastern Europe Market Value (US$ Million) Forecast by Country, 2019 to 2034
Table 34: Eastern Europe Market Volume (Unit Pack) Forecast by Country, 2019 to 2034
Table 35: Eastern Europe Market Value (US$ Million) Forecast by Material, 2019 to 2034
Table 36: Eastern Europe Market Volume (Unit Pack) Forecast by Material, 2019 to 2034
Table 37: Eastern Europe Market Value (US$ Million) Forecast by Bag Type, 2019 to 2034
Table 38: Eastern Europe Market Volume (Unit Pack) Forecast by Bag Type, 2019 to 2034
Table 39: Eastern Europe Market Value (US$ Million) Forecast by End Use, 2019 to 2034
Table 40: Eastern Europe Market Volume (Unit Pack) Forecast by End Use, 2019 to 2034
Table 41: South Asia and Pacific Market Value (US$ Million) Forecast by Country, 2019 to 2034
Table 42: South Asia and Pacific Market Volume (Unit Pack) Forecast by Country, 2019 to 2034
Table 43: South Asia and Pacific Market Value (US$ Million) Forecast by Material, 2019 to 2034
Table 44: South Asia and Pacific Market Volume (Unit Pack) Forecast by Material, 2019 to 2034
Table 45: South Asia and Pacific Market Value (US$ Million) Forecast by Bag Type, 2019 to 2034
Table 46: South Asia and Pacific Market Volume (Unit Pack) Forecast by Bag Type, 2019 to 2034
Table 47: South Asia and Pacific Market Value (US$ Million) Forecast by End Use, 2019 to 2034
Table 48: South Asia and Pacific Market Volume (Unit Pack) Forecast by End Use, 2019 to 2034
Table 49: East Asia Market Value (US$ Million) Forecast by Country, 2019 to 2034
Table 50: East Asia Market Volume (Unit Pack) Forecast by Country, 2019 to 2034
Table 51: East Asia Market Value (US$ Million) Forecast by Material, 2019 to 2034
Table 52: East Asia Market Volume (Unit Pack) Forecast by Material, 2019 to 2034
Table 53: East Asia Market Value (US$ Million) Forecast by Bag Type, 2019 to 2034
Table 54: East Asia Market Volume (Unit Pack) Forecast by Bag Type, 2019 to 2034
Table 55: East Asia Market Value (US$ Million) Forecast by End Use, 2019 to 2034
Table 56: East Asia Market Volume (Unit Pack) Forecast by End Use, 2019 to 2034
Table 57: Middle East and Africa Market Value (US$ Million) Forecast by Country, 2019 to 2034
Table 58: Middle East and Africa Market Volume (Unit Pack) Forecast by Country, 2019 to 2034
Table 59: Middle East and Africa Market Value (US$ Million) Forecast by Material, 2019 to 2034
Table 60: Middle East and Africa Market Volume (Unit Pack) Forecast by Material, 2019 to 2034
Table 61: Middle East and Africa Market Value (US$ Million) Forecast by Bag Type, 2019 to 2034
Table 62: Middle East and Africa Market Volume (Unit Pack) Forecast by Bag Type, 2019 to 2034
Table 63: Middle East and Africa Market Value (US$ Million) Forecast by End Use, 2019 to 2034
Table 64: Middle East and Africa Market Volume (Unit Pack) Forecast by End Use, 2019 to 2034
Figure 1: Global Market Value (US$ Million) by Material, 2024 to 2034
Figure 2: Global Market Value (US$ Million) by Bag Type, 2024 to 2034
Figure 3: Global Market Value (US$ Million) by End Use, 2024 to 2034
Figure 4: Global Market Value (US$ Million) by Region, 2024 to 2034
Figure 5: Global Market Value (US$ Million) Analysis by Region, 2019 to 2034
Figure 6: Global Market Volume (Unit Pack) Analysis by Region, 2019 to 2034
Figure 7: Global Market Value Share (%) and BPS Analysis by Region, 2024 to 2034
Figure 8: Global Market Y-o-Y Growth (%) Projections by Region, 2024 to 2034
Figure 9: Global Market Value (US$ Million) Analysis by Material, 2019 to 2034
Figure 10: Global Market Volume (Unit Pack) Analysis by Material, 2019 to 2034
Figure 11: Global Market Value Share (%) and BPS Analysis by Material, 2024 to 2034
Figure 12: Global Market Y-o-Y Growth (%) Projections by Material, 2024 to 2034
Figure 13: Global Market Value (US$ Million) Analysis by Bag Type, 2019 to 2034
Figure 14: Global Market Volume (Unit Pack) Analysis by Bag Type, 2019 to 2034
Figure 15: Global Market Value Share (%) and BPS Analysis by Bag Type, 2024 to 2034
Figure 16: Global Market Y-o-Y Growth (%) Projections by Bag Type, 2024 to 2034
Figure 17: Global Market Value (US$ Million) Analysis by End Use, 2019 to 2034
Figure 18: Global Market Volume (Unit Pack) Analysis by End Use, 2019 to 2034
Figure 19: Global Market Value Share (%) and BPS Analysis by End Use, 2024 to 2034
Figure 20: Global Market Y-o-Y Growth (%) Projections by End Use, 2024 to 2034
Figure 21: Global Market Attractiveness by Material, 2024 to 2034
Figure 22: Global Market Attractiveness by Bag Type, 2024 to 2034
Figure 23: Global Market Attractiveness by End Use, 2024 to 2034
Figure 24: Global Market Attractiveness by Region, 2024 to 2034
Figure 25: North America Market Value (US$ Million) by Material, 2024 to 2034
Figure 26: North America Market Value (US$ Million) by Bag Type, 2024 to 2034
Figure 27: North America Market Value (US$ Million) by End Use, 2024 to 2034
Figure 28: North America Market Value (US$ Million) by Country, 2024 to 2034
Figure 29: North America Market Value (US$ Million) Analysis by Country, 2019 to 2034
Figure 30: North America Market Volume (Unit Pack) Analysis by Country, 2019 to 2034
Figure 31: North America Market Value Share (%) and BPS Analysis by Country, 2024 to 2034
Figure 32: North America Market Y-o-Y Growth (%) Projections by Country, 2024 to 2034
Figure 33: North America Market Value (US$ Million) Analysis by Material, 2019 to 2034
Figure 34: North America Market Volume (Unit Pack) Analysis by Material, 2019 to 2034
Figure 35: North America Market Value Share (%) and BPS Analysis by Material, 2024 to 2034
Figure 36: North America Market Y-o-Y Growth (%) Projections by Material, 2024 to 2034
Figure 37: North America Market Value (US$ Million) Analysis by Bag Type, 2019 to 2034
Figure 38: North America Market Volume (Unit Pack) Analysis by Bag Type, 2019 to 2034
Figure 39: North America Market Value Share (%) and BPS Analysis by Bag Type, 2024 to 2034
Figure 40: North America Market Y-o-Y Growth (%) Projections by Bag Type, 2024 to 2034
Figure 41: North America Market Value (US$ Million) Analysis by End Use, 2019 to 2034
Figure 42: North America Market Volume (Unit Pack) Analysis by End Use, 2019 to 2034
Figure 43: North America Market Value Share (%) and BPS Analysis by End Use, 2024 to 2034
Figure 44: North America Market Y-o-Y Growth (%) Projections by End Use, 2024 to 2034
Figure 45: North America Market Attractiveness by Material, 2024 to 2034
Figure 46: North America Market Attractiveness by Bag Type, 2024 to 2034
Figure 47: North America Market Attractiveness by End Use, 2024 to 2034
Figure 48: North America Market Attractiveness by Country, 2024 to 2034
Figure 49: Latin America Market Value (US$ Million) by Material, 2024 to 2034
Figure 50: Latin America Market Value (US$ Million) by Bag Type, 2024 to 2034
Figure 51: Latin America Market Value (US$ Million) by End Use, 2024 to 2034
Figure 52: Latin America Market Value (US$ Million) by Country, 2024 to 2034
Figure 53: Latin America Market Value (US$ Million) Analysis by Country, 2019 to 2034
Figure 54: Latin America Market Volume (Unit Pack) Analysis by Country, 2019 to 2034
Figure 55: Latin America Market Value Share (%) and BPS Analysis by Country, 2024 to 2034
Figure 56: Latin America Market Y-o-Y Growth (%) Projections by Country, 2024 to 2034
Figure 57: Latin America Market Value (US$ Million) Analysis by Material, 2019 to 2034
Figure 58: Latin America Market Volume (Unit Pack) Analysis by Material, 2019 to 2034
Figure 59: Latin America Market Value Share (%) and BPS Analysis by Material, 2024 to 2034
Figure 60: Latin America Market Y-o-Y Growth (%) Projections by Material, 2024 to 2034
Figure 61: Latin America Market Value (US$ Million) Analysis by Bag Type, 2019 to 2034
Figure 62: Latin America Market Volume (Unit Pack) Analysis by Bag Type, 2019 to 2034
Figure 63: Latin America Market Value Share (%) and BPS Analysis by Bag Type, 2024 to 2034
Figure 64: Latin America Market Y-o-Y Growth (%) Projections by Bag Type, 2024 to 2034
Figure 65: Latin America Market Value (US$ Million) Analysis by End Use, 2019 to 2034
Figure 66: Latin America Market Volume (Unit Pack) Analysis by End Use, 2019 to 2034
Figure 67: Latin America Market Value Share (%) and BPS Analysis by End Use, 2024 to 2034
Figure 68: Latin America Market Y-o-Y Growth (%) Projections by End Use, 2024 to 2034
Figure 69: Latin America Market Attractiveness by Material, 2024 to 2034
Figure 70: Latin America Market Attractiveness by Bag Type, 2024 to 2034
Figure 71: Latin America Market Attractiveness by End Use, 2024 to 2034
Figure 72: Latin America Market Attractiveness by Country, 2024 to 2034
Figure 73: Western Europe Market Value (US$ Million) by Material, 2024 to 2034
Figure 74: Western Europe Market Value (US$ Million) by Bag Type, 2024 to 2034
Figure 75: Western Europe Market Value (US$ Million) by End Use, 2024 to 2034
Figure 76: Western Europe Market Value (US$ Million) by Country, 2024 to 2034
Figure 77: Western Europe Market Value (US$ Million) Analysis by Country, 2019 to 2034
Figure 78: Western Europe Market Volume (Unit Pack) Analysis by Country, 2019 to 2034
Figure 79: Western Europe Market Value Share (%) and BPS Analysis by Country, 2024 to 2034
Figure 80: Western Europe Market Y-o-Y Growth (%) Projections by Country, 2024 to 2034
Figure 81: Western Europe Market Value (US$ Million) Analysis by Material, 2019 to 2034
Figure 82: Western Europe Market Volume (Unit Pack) Analysis by Material, 2019 to 2034
Figure 83: Western Europe Market Value Share (%) and BPS Analysis by Material, 2024 to 2034
Figure 84: Western Europe Market Y-o-Y Growth (%) Projections by Material, 2024 to 2034
Figure 85: Western Europe Market Value (US$ Million) Analysis by Bag Type, 2019 to 2034
Figure 86: Western Europe Market Volume (Unit Pack) Analysis by Bag Type, 2019 to 2034
Figure 87: Western Europe Market Value Share (%) and BPS Analysis by Bag Type, 2024 to 2034
Figure 88: Western Europe Market Y-o-Y Growth (%) Projections by Bag Type, 2024 to 2034
Figure 89: Western Europe Market Value (US$ Million) Analysis by End Use, 2019 to 2034
Figure 90: Western Europe Market Volume (Unit Pack) Analysis by End Use, 2019 to 2034
Figure 91: Western Europe Market Value Share (%) and BPS Analysis by End Use, 2024 to 2034
Figure 92: Western Europe Market Y-o-Y Growth (%) Projections by End Use, 2024 to 2034
Figure 93: Western Europe Market Attractiveness by Material, 2024 to 2034
Figure 94: Western Europe Market Attractiveness by Bag Type, 2024 to 2034
Figure 95: Western Europe Market Attractiveness by End Use, 2024 to 2034
Figure 96: Western Europe Market Attractiveness by Country, 2024 to 2034
Figure 97: Eastern Europe Market Value (US$ Million) by Material, 2024 to 2034
Figure 98: Eastern Europe Market Value (US$ Million) by Bag Type, 2024 to 2034
Figure 99: Eastern Europe Market Value (US$ Million) by End Use, 2024 to 2034
Figure 100: Eastern Europe Market Value (US$ Million) by Country, 2024 to 2034
Figure 101: Eastern Europe Market Value (US$ Million) Analysis by Country, 2019 to 2034
Figure 102: Eastern Europe Market Volume (Unit Pack) Analysis by Country, 2019 to 2034
Figure 103: Eastern Europe Market Value Share (%) and BPS Analysis by Country, 2024 to 2034
Figure 104: Eastern Europe Market Y-o-Y Growth (%) Projections by Country, 2024 to 2034
Figure 105: Eastern Europe Market Value (US$ Million) Analysis by Material, 2019 to 2034
Figure 106: Eastern Europe Market Volume (Unit Pack) Analysis by Material, 2019 to 2034
Figure 107: Eastern Europe Market Value Share (%) and BPS Analysis by Material, 2024 to 2034
Figure 108: Eastern Europe Market Y-o-Y Growth (%) Projections by Material, 2024 to 2034
Figure 109: Eastern Europe Market Value (US$ Million) Analysis by Bag Type, 2019 to 2034
Figure 110: Eastern Europe Market Volume (Unit Pack) Analysis by Bag Type, 2019 to 2034
Figure 111: Eastern Europe Market Value Share (%) and BPS Analysis by Bag Type, 2024 to 2034
Figure 112: Eastern Europe Market Y-o-Y Growth (%) Projections by Bag Type, 2024 to 2034
Figure 113: Eastern Europe Market Value (US$ Million) Analysis by End Use, 2019 to 2034
Figure 114: Eastern Europe Market Volume (Unit Pack) Analysis by End Use, 2019 to 2034
Figure 115: Eastern Europe Market Value Share (%) and BPS Analysis by End Use, 2024 to 2034
Figure 116: Eastern Europe Market Y-o-Y Growth (%) Projections by End Use, 2024 to 2034
Figure 117: Eastern Europe Market Attractiveness by Material, 2024 to 2034
Figure 118: Eastern Europe Market Attractiveness by Bag Type, 2024 to 2034
Figure 119: Eastern Europe Market Attractiveness by End Use, 2024 to 2034
Figure 120: Eastern Europe Market Attractiveness by Country, 2024 to 2034
Figure 121: South Asia and Pacific Market Value (US$ Million) by Material, 2024 to 2034
Figure 122: South Asia and Pacific Market Value (US$ Million) by Bag Type, 2024 to 2034
Figure 123: South Asia and Pacific Market Value (US$ Million) by End Use, 2024 to 2034
Figure 124: South Asia and Pacific Market Value (US$ Million) by Country, 2024 to 2034
Figure 125: South Asia and Pacific Market Value (US$ Million) Analysis by Country, 2019 to 2034
Figure 126: South Asia and Pacific Market Volume (Unit Pack) Analysis by Country, 2019 to 2034
Figure 127: South Asia and Pacific Market Value Share (%) and BPS Analysis by Country, 2024 to 2034
Figure 128: South Asia and Pacific Market Y-o-Y Growth (%) Projections by Country, 2024 to 2034
Figure 129: South Asia and Pacific Market Value (US$ Million) Analysis by Material, 2019 to 2034
Figure 130: South Asia and Pacific Market Volume (Unit Pack) Analysis by Material, 2019 to 2034
Figure 131: South Asia and Pacific Market Value Share (%) and BPS Analysis by Material, 2024 to 2034
Figure 132: South Asia and Pacific Market Y-o-Y Growth (%) Projections by Material, 2024 to 2034
Figure 133: South Asia and Pacific Market Value (US$ Million) Analysis by Bag Type, 2019 to 2034
Figure 134: South Asia and Pacific Market Volume (Unit Pack) Analysis by Bag Type, 2019 to 2034
Figure 135: South Asia and Pacific Market Value Share (%) and BPS Analysis by Bag Type, 2024 to 2034
Figure 136: South Asia and Pacific Market Y-o-Y Growth (%) Projections by Bag Type, 2024 to 2034
Figure 137: South Asia and Pacific Market Value (US$ Million) Analysis by End Use, 2019 to 2034
Figure 138: South Asia and Pacific Market Volume (Unit Pack) Analysis by End Use, 2019 to 2034
Figure 139: South Asia and Pacific Market Value Share (%) and BPS Analysis by End Use, 2024 to 2034
Figure 140: South Asia and Pacific Market Y-o-Y Growth (%) Projections by End Use, 2024 to 2034
Figure 141: South Asia and Pacific Market Attractiveness by Material, 2024 to 2034
Figure 142: South Asia and Pacific Market Attractiveness by Bag Type, 2024 to 2034
Figure 143: South Asia and Pacific Market Attractiveness by End Use, 2024 to 2034
Figure 144: South Asia and Pacific Market Attractiveness by Country, 2024 to 2034
Figure 145: East Asia Market Value (US$ Million) by Material, 2024 to 2034
Figure 146: East Asia Market Value (US$ Million) by Bag Type, 2024 to 2034
Figure 147: East Asia Market Value (US$ Million) by End Use, 2024 to 2034
Figure 148: East Asia Market Value (US$ Million) by Country, 2024 to 2034
Figure 149: East Asia Market Value (US$ Million) Analysis by Country, 2019 to 2034
Figure 150: East Asia Market Volume (Unit Pack) Analysis by Country, 2019 to 2034
Figure 151: East Asia Market Value Share (%) and BPS Analysis by Country, 2024 to 2034
Figure 152: East Asia Market Y-o-Y Growth (%) Projections by Country, 2024 to 2034
Figure 153: East Asia Market Value (US$ Million) Analysis by Material, 2019 to 2034
Figure 154: East Asia Market Volume (Unit Pack) Analysis by Material, 2019 to 2034
Figure 155: East Asia Market Value Share (%) and BPS Analysis by Material, 2024 to 2034
Figure 156: East Asia Market Y-o-Y Growth (%) Projections by Material, 2024 to 2034
Figure 157: East Asia Market Value (US$ Million) Analysis by Bag Type, 2019 to 2034
Figure 158: East Asia Market Volume (Unit Pack) Analysis by Bag Type, 2019 to 2034
Figure 159: East Asia Market Value Share (%) and BPS Analysis by Bag Type, 2024 to 2034
Figure 160: East Asia Market Y-o-Y Growth (%) Projections by Bag Type, 2024 to 2034
Figure 161: East Asia Market Value (US$ Million) Analysis by End Use, 2019 to 2034
Figure 162: East Asia Market Volume (Unit Pack) Analysis by End Use, 2019 to 2034
Figure 163: East Asia Market Value Share (%) and BPS Analysis by End Use, 2024 to 2034
Figure 164: East Asia Market Y-o-Y Growth (%) Projections by End Use, 2024 to 2034
Figure 165: East Asia Market Attractiveness by Material, 2024 to 2034
Figure 166: East Asia Market Attractiveness by Bag Type, 2024 to 2034
Figure 167: East Asia Market Attractiveness by End Use, 2024 to 2034
Figure 168: East Asia Market Attractiveness by Country, 2024 to 2034
Figure 169: Middle East and Africa Market Value (US$ Million) by Material, 2024 to 2034
Figure 170: Middle East and Africa Market Value (US$ Million) by Bag Type, 2024 to 2034
Figure 171: Middle East and Africa Market Value (US$ Million) by End Use, 2024 to 2034
Figure 172: Middle East and Africa Market Value (US$ Million) by Country, 2024 to 2034
Figure 173: Middle East and Africa Market Value (US$ Million) Analysis by Country, 2019 to 2034
Figure 174: Middle East and Africa Market Volume (Unit Pack) Analysis by Country, 2019 to 2034
Figure 175: Middle East and Africa Market Value Share (%) and BPS Analysis by Country, 2024 to 2034
Figure 176: Middle East and Africa Market Y-o-Y Growth (%) Projections by Country, 2024 to 2034
Figure 177: Middle East and Africa Market Value (US$ Million) Analysis by Material, 2019 to 2034
Figure 178: Middle East and Africa Market Volume (Unit Pack) Analysis by Material, 2019 to 2034
Figure 179: Middle East and Africa Market Value Share (%) and BPS Analysis by Material, 2024 to 2034
Figure 180: Middle East and Africa Market Y-o-Y Growth (%) Projections by Material, 2024 to 2034
Figure 181: Middle East and Africa Market Value (US$ Million) Analysis by Bag Type, 2019 to 2034
Figure 182: Middle East and Africa Market Volume (Unit Pack) Analysis by Bag Type, 2019 to 2034
Figure 183: Middle East and Africa Market Value Share (%) and BPS Analysis by Bag Type, 2024 to 2034
Figure 184: Middle East and Africa Market Y-o-Y Growth (%) Projections by Bag Type, 2024 to 2034
Figure 185: Middle East and Africa Market Value (US$ Million) Analysis by End Use, 2019 to 2034
Figure 186: Middle East and Africa Market Volume (Unit Pack) Analysis by End Use, 2019 to 2034
Figure 187: Middle East and Africa Market Value Share (%) and BPS Analysis by End Use, 2024 to 2034
Figure 188: Middle East and Africa Market Y-o-Y Growth (%) Projections by End Use, 2024 to 2034
Figure 189: Middle East and Africa Market Attractiveness by Material, 2024 to 2034
Figure 190: Middle East and Africa Market Attractiveness by Bag Type, 2024 to 2034
Figure 191: Middle East and Africa Market Attractiveness by End Use, 2024 to 2034
Figure 192: Middle East and Africa Market Attractiveness by Country, 2024 to 2034
As of 2024, the market for oven bags is expected to be valued at USD 795.9 million.
The oven bag market is projected to expand at a CAGR of 3.2% between 2024 and 2034.
The baking bag segment is projected to dominate the industry.
By 2034, the market value of oven bags is expected to reach USD 1,090.6 million.
India is likely the top-performing market, with a CAGR of 6.5%.
Explore Similar Insights
Thank you!
You will receive an email from our Business Development Manager. Please be sure to check your SPAM/JUNK folder too.