Reports
- Global Locations -
Headquarters
Future Market Insights, Inc.
Christiana Corporate, 200
Continental Drive, Suite 401,
Newark, Delaware - 19713,
United States
Americas
Future Market Insights, Inc.
616 Corporate Way, Suite 2-9018,
Valley Cottage, NY 10989, United States
MEA
Future Market Insights
1602-6 Jumeirah Bay X2 Tower, Plot No: JLT-PH2-X2A,
Jumeirah Lakes Towers, Dubai,
United Arab Emirates
Europe
Future Market Insights
3rd Floor, 207 Regent Street,
W1B 3HH London
United Kingdom
Asia Pacific
Future Market Insights
Office No. 401-A, 4th Floor,
VANTAGE 9, S.No. 36/1/1,
Baner, Pune 411045, India
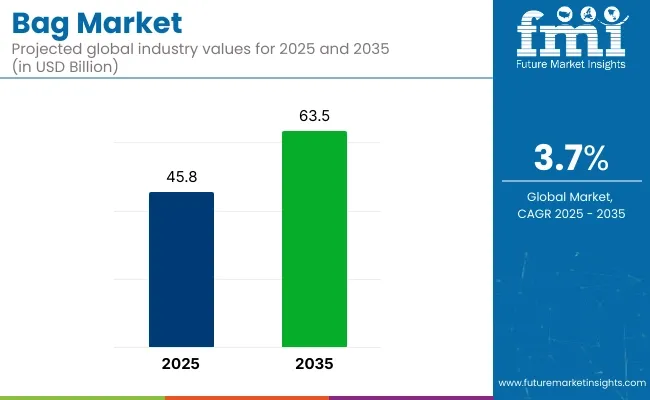
The Bag Market is projected to be valued at US$ 34.1 billion in 2023. The market research report anticipates a growth of US$ 50.3 billion by 2033. The bag sales are expected to record a CAGR of 3.90% during the forecast period.
Attributes | Key Insights |
---|---|
Bag Market Estimated Size in 2023 | US$ 34.1 billion |
Projected Market Value in 2033 | US$ 50.3 billion |
Value-based CAGR from 2023 to 2033 | 3.90% |
Bag Market Trends and Highlights
Don't pay for what you don't need
Customize your report by selecting specific countries or regions and save 30%!
Specialized bags are designed to be reusable and are intended for packaging applications of specifically related products. Numerous competing products entered the market during this period, supporting its worldwide industry's rise.
Through a macroeconomic lens, there is little if any, market restriction. Consumers are buying fewer items packaged in boxes and packaging and instead are going for packaging made with discreet bags. While this change is leading to less demand for sturdy boxes, there is anticipated growth in consumable product manufacturers' interest in creating new product lineups, particularly for end consumers.
The increasing number of women participating in the global workforce has played a crucial role in intensifying the demand for the product as it helps to escalate their purchasing power. The high consumer spending contributed by the female population is likely to raise the consumption rate. The increasing female literacy rate worldwide has led to a heightened awareness of the availability of luxury goods/products, such as handbags, aiding market progress.
Market Value in 2022 | US$ 34.1 billion |
---|---|
Market Value in 2033 | US$ 50.3 billion |
Future Market Insights (FMI) has compared two other markets, the air bubble bags market and the self-sealed bubble bags market. The table reveals that the self-sealed bubble bags market is expanding at a higher CAGR than the other two. The bag market possesses great revenue potential.
The increasing sustainability trend, backed by the rising penetration of smart packaging options, is predicted to bolster growth in the three markets. The expansion of end-user industries will also be crucial for the three market developments. E-commerce industry expansion will be highly beneficial for the three markets
Bag Market:
CAGR from 2023 to 2033 | 3.90% |
---|---|
Market Value in 2023 | US$ 34.1 billion |
Opportunities |
|
Growth Factor |
|
Air Bubble Bag Market:
CAGR from 2023 to 2033 | 4.2% |
---|---|
Market Value in 2023 | US$ 1,162.0 million |
Opportunities |
|
Growth Factor |
|
Self-Sealed Bubble Bag Market:
CAGR from 2023 to 2033 | 5.7% |
---|---|
Market Value in 2023 | US$ 2.4 billion |
Opportunities | Surging demand for consumer goods and thriving growth in the packaging industry will spur growth in the bubble bags market. |
Growth Factor | Increasing efforts by manufacturers to offer innovative packaging solutions will fuel the demand for self-sealable bubble bags. |
Get the data you need at a Fraction of the cost
Personalize your report by choosing insights you need
and save 40%!
Forecast CAGRs from 2023 to 2033
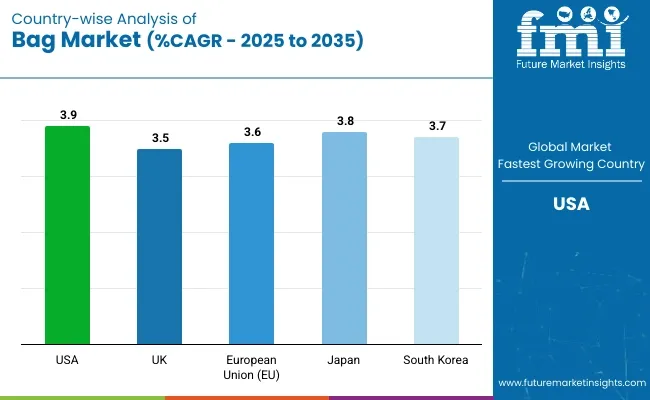
The United States | 2.5% |
---|---|
Italy | 2.6% |
India | 6.4% |
China | 5.7% |
The market in the United States is expected to grow considerably during the forecast period. The surging adoption of advanced technology and the presence of large players in this region are likely to create ample growth opportunities for the market.
Luxury brands like Louis Vuitton, Gucci, and Chanel dominate the high-end handbag segment, with a strong focus on fashion trends and exclusivity. United States is expected to expand at a CAGR of 2.50% through 2033.
The United States boasts one of the largest bag markets globally, driven by a diverse range of bag types, including handbags, backpacks, luggage, and specialty bags. Sustainability is an increasingly important factor, with consumers seeking eco-friendly options. E-commerce has gained a significant share, but brick-and-mortar retail stores remain crucial for consumers to explore and purchase bags.
Various industries, including food and beverage, e-commerce, and retail, have been registering high growth in India on account of the increasing international commerce and the implementation of favorable measures by the Indian government. The expansion of these industries is driving the demand for plastic bags for effective storage and transportation of goods.
Launch of initiatives such as Make in India and industry-specific incentives are operations within manufacturing enterprises in India. India is predicted to account for a CAGR of 6.4% from 2023 to 2033.
The bag market in China is experiencing remarkable growth, influenced by rising disposable incomes, urbanization, and a growing middle class. The growing fashion consciousness and spending on personal items and accessories have also been observed to be major factors driving the market growth. Due to the developing packaging industry, China also accounts for a significant share of the global bag market.
Luxury brands have made significant investments to cater to the increasing demand for high-end handbags. E-commerce platforms have gained prominence, with Alibaba's Tmall and JD.com leading the way. China is expected to expand at a CAGR of 5.7% through 2033.
Italy is expected to expand at a CAGR of 2.6% through 2033. Italy is renowned for its leather craftsmanship and luxury bags. Cities like Florence and Milan are hubs for high-end bag production and fashion. Italian brands like Prada, Gucci, and Fendi are global leaders in the luxury handbag market.
The bag market in Italy reflects its diverse culture and fashion trends. Local materials like leather and canvas are commonly used in bag production in the country.
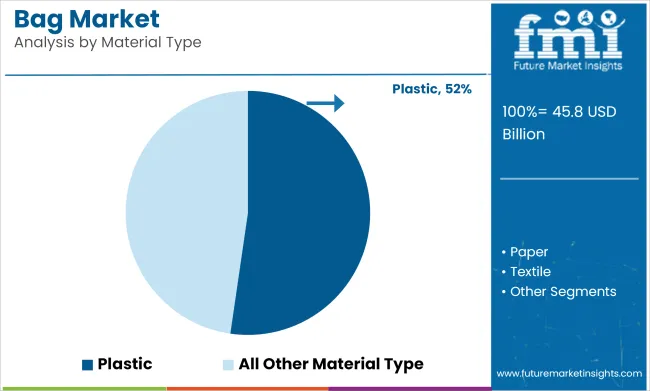
Plastic bags account for 71.8% of the bag market. These bags offer various advantages over paper ones, such as better convenience, sturdiness, high spill proof, and less prone to tearing qualities. Plastic bags can be reused several times as compared to paper bags.
The manufacturing cost of paper bags is way higher than plastic bags. With an increasing literacy rate and awareness regarding environmental degradation due to plastics, consumer preference is moving towards adopting eco-friendly and safe packaging solutions such as paper bags.
Many countries across the globe have imposed stringent restrictions/bans on the use of Single-use plastic bags (SUPs) and have pledged to reduce the use of plastics by 2030 significantly. For instance, China has announced a plan to ban non-degradable bags by 2022.
Segment | Plastic by Material Type |
---|---|
Value Share in 2023 | 71.8% |
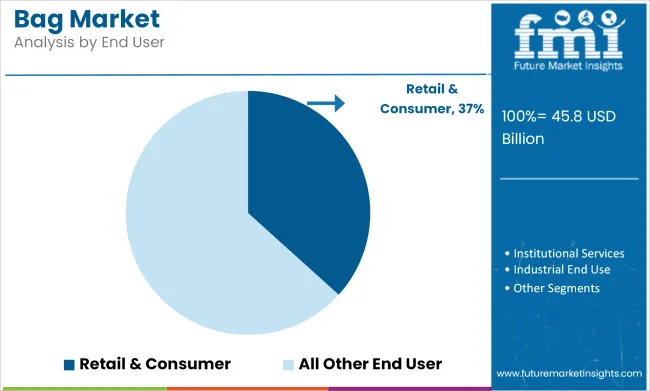
In terms of end-users, the retail and consumer segment is expected to account for the largest share in 2023 and is poised to maintain its dominance during the forecast period. The retail and consumer segment is expected to accelerate and is expected to attract investors for bags.
Segment | Consumer and Retail by End-user |
---|---|
Value Share in 2023 | 56.4% |
Market actors have reshaped the product in such a way that consumers are drawn to acquire bags. The key players in the plastic bags industry are concentrating on providing lighter-weight and more environmentally friendly bags.
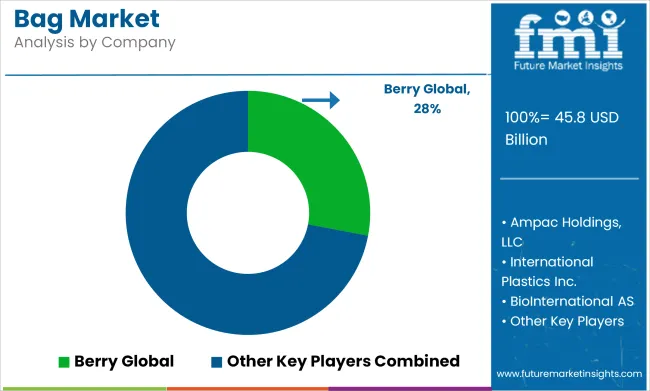
Some of the market's major companies are Berry Global, Mondi Group, Ampac Holdings, LLC, International Plastics Inc., BioBag International AS, Smurfit Kappa, WestRock Company, Billerudkorsnas, Huhtamaki Oyj., Fischer Bag Company.
Some of the key developments
Attributes | Details |
---|---|
Estimated Market Size in 2023 | US$ 34.1 billion |
Projected Market Valuation in 2033 | US$ 50.3 billion |
Value-based CAGR 2023 to 2033 | 3.90% |
Forecast Period | 2023 to 2033 |
Historical Data Available for | 2018 to 2022 |
Market Analysis | Value in US$ billion |
Key Regions Covered |
|
Key Market Segments Covered |
|
Key Countries Profiled |
|
Key Companies Profiled |
|
1. Executive Summary 1.1. Global Market Outlook 1.2. Demand-side Trends 1.3. Supply-side Trends 1.4. Technology Roadmap Analysis 1.5. Analysis and Recommendations 2. Market Overview 2.1. Market Coverage / Taxonomy 2.2. Market Definition / Scope / Limitations 3. Market Background 3.1. Market Dynamics 3.1.1. Drivers 3.1.2. Restraints 3.1.3. Opportunity 3.1.4. Trends 3.2. Scenario Forecast 3.2.1. Demand in Optimistic Scenario 3.2.2. Demand in Likely Scenario 3.2.3. Demand in Conservative Scenario 3.3. Opportunity Map Analysis 3.4. Product Life Cycle Analysis 3.5. Supply Chain Analysis 3.5.1. Supply Side Participants and their Roles 3.5.1.1. Producers 3.5.1.2. Mid-Level Participants (Traders/ Agents/ Brokers) 3.5.1.3. Wholesalers and Distributors 3.5.2. Value Added and Value Created at Node in the Supply Chain 3.5.3. List of Raw Material Suppliers 3.5.4. List of Existing and Potential Buyer’s 3.6. Investment Feasibility Matrix 3.7. Value Chain Analysis 3.7.1. Profit Margin Analysis 3.7.2. Wholesalers and Distributors 3.7.3. Retailers 3.8. PESTLE and Porter’s Analysis 3.9. Regulatory Landscape 3.9.1. By Key Regions 3.9.2. By Key Countries 3.10. Regional Parent Market Outlook 3.11. Production and Consumption Statistics 3.12. Import and Export Statistics 4. Global Market Analysis 2018 to 2022 and Forecast, 2023 to 2033 4.1. Historical Market Size Value (US$ Million) & Volume (Units) Analysis, 2018 to 2022 4.2. Current and Future Market Size Value (US$ Million) & Volume (Units) Projections, 2023 to 2033 4.2.1. Y-o-Y Growth Trend Analysis 4.2.2. Absolute $ Opportunity Analysis 5. Global Market Analysis 2018 to 2022 and Forecast 2023 to 2033, By Material Type 5.1. Introduction / Key Findings 5.2. Historical Market Size Value (US$ Million) & Volume (Units) Analysis By Material Type, 2018 to 2022 5.3. Current and Future Market Size Value (US$ Million) & Volume (Units) Analysis and Forecast By Material Type, 2023 to 2033 5.3.1. Plastic 5.3.2. Paper 5.3.3. Textile 5.4. Y-o-Y Growth Trend Analysis By Material Type, 2018 to 2022 5.5. Absolute $ Opportunity Analysis By Material Type, 2023 to 2033 6. Global Market Analysis 2018 to 2022 and Forecast 2023 to 2033, By Product Type 6.1. Introduction / Key Findings 6.2. Historical Market Size Value (US$ Million) & Volume (Units) Analysis By Product Type, 2018 to 2022 6.3. Current and Future Market Size Value (US$ Million) & Volume (Units) Analysis and Forecast By Product Type, 2023 to 2033 6.3.1. T-Shirt Bag 6.3.2. Gusseted Bag 6.3.3. Lay Flat Bag 6.3.4. Garbage/Refuse/Trash Bag 6.3.5. Woven Bag 6.3.6. Other Bag 6.4. Y-o-Y Growth Trend Analysis By Product Type, 2018 to 2022 6.5. Absolute $ Opportunity Analysis By Product Type, 2023 to 2033 7. Global Market Analysis 2018 to 2022 and Forecast 2023 to 2033, By End User 7.1. Introduction / Key Findings 7.2. Historical Market Size Value (US$ Million) & Volume (Units) Analysis By End User, 2018 to 2022 7.3. Current and Future Market Size Value (US$ Million) & Volume (Units) Analysis and Forecast By End User, 2023 to 2033 7.3.1. Retail & Consumer 7.3.1.1. Grocery Products 7.3.1.2. Food & Beverage 7.3.1.3. Clothing & Apparel 7.3.1.4. Others 7.3.2. Institutional Services 7.3.2.1. Hospitality 7.3.2.2. Healthcare 7.3.2.3. Others 7.3.3. Industrial End Use 7.3.4. Household 7.4. Y-o-Y Growth Trend Analysis By End User, 2018 to 2022 7.5. Absolute $ Opportunity Analysis By End User, 2023 to 2033 8. Global Market Analysis 2018 to 2022 and Forecast 2023 to 2033, By Region 8.1. Introduction 8.2. Historical Market Size Value (US$ Million) & Volume (Units) Analysis By Region, 2018 to 2022 8.3. Current Market Size Value (US$ Million) & Volume (Units) Analysis and Forecast By Region, 2023 to 2033 8.3.1. North America 8.3.2. Latin America 8.3.3. Western Europe 8.3.4. Eastern Europe 8.3.5. South Asia and Pacific 8.3.6. East Asia 8.3.7. Middle East and Africa 8.4. Market Attractiveness Analysis By Region 9. North America Market Analysis 2018 to 2022 and Forecast 2023 to 2033, By Country 9.1. Historical Market Size Value (US$ Million) & Volume (Units) Trend Analysis By Market Taxonomy, 2018 to 2022 9.2. Market Size Value (US$ Million) & Volume (Units) Forecast By Market Taxonomy, 2023 to 2033 9.2.1. By Country 9.2.1.1. USA 9.2.1.2. Canada 9.2.2. By Material Type 9.2.3. By Product Type 9.2.4. By End User 9.3. Market Attractiveness Analysis 9.3.1. By Country 9.3.2. By Material Type 9.3.3. By Product Type 9.3.4. By End User 9.4. Key Takeaways 10. Latin America Market Analysis 2018 to 2022 and Forecast 2023 to 2033, By Country 10.1. Historical Market Size Value (US$ Million) & Volume (Units) Trend Analysis By Market Taxonomy, 2018 to 2022 10.2. Market Size Value (US$ Million) & Volume (Units) Forecast By Market Taxonomy, 2023 to 2033 10.2.1. By Country 10.2.1.1. Brazil 10.2.1.2. Mexico 10.2.1.3. Rest of Latin America 10.2.2. By Material Type 10.2.3. By Product Type 10.2.4. By End User 10.3. Market Attractiveness Analysis 10.3.1. By Country 10.3.2. By Material Type 10.3.3. By Product Type 10.3.4. By End User 10.4. Key Takeaways 11. Western Europe Market Analysis 2018 to 2022 and Forecast 2023 to 2033, By Country 11.1. Historical Market Size Value (US$ Million) & Volume (Units) Trend Analysis By Market Taxonomy, 2018 to 2022 11.2. Market Size Value (US$ Million) & Volume (Units) Forecast By Market Taxonomy, 2023 to 2033 11.2.1. By Country 11.2.1.1. Germany 11.2.1.2. UK 11.2.1.3. France 11.2.1.4. Spain 11.2.1.5. Italy 11.2.1.6. Rest of Western Europe 11.2.2. By Material Type 11.2.3. By Product Type 11.2.4. By End User 11.3. Market Attractiveness Analysis 11.3.1. By Country 11.3.2. By Material Type 11.3.3. By Product Type 11.3.4. By End User 11.4. Key Takeaways 12. Eastern Europe Market Analysis 2018 to 2022 and Forecast 2023 to 2033, By Country 12.1. Historical Market Size Value (US$ Million) & Volume (Units) Trend Analysis By Market Taxonomy, 2018 to 2022 12.2. Market Size Value (US$ Million) & Volume (Units) Forecast By Market Taxonomy, 2023 to 2033 12.2.1. By Country 12.2.1.1. Poland 12.2.1.2. Russia 12.2.1.3. Czech Republic 12.2.1.4. Romania 12.2.1.5. Rest of Eastern Europe 12.2.2. By Material Type 12.2.3. By Product Type 12.2.4. By End User 12.3. Market Attractiveness Analysis 12.3.1. By Country 12.3.2. By Material Type 12.3.3. By Product Type 12.3.4. By End User 12.4. Key Takeaways 13. South Asia and Pacific Market Analysis 2018 to 2022 and Forecast 2023 to 2033, By Country 13.1. Historical Market Size Value (US$ Million) & Volume (Units) Trend Analysis By Market Taxonomy, 2018 to 2022 13.2. Market Size Value (US$ Million) & Volume (Units) Forecast By Market Taxonomy, 2023 to 2033 13.2.1. By Country 13.2.1.1. India 13.2.1.2. Bangladesh 13.2.1.3. Australia 13.2.1.4. New Zealand 13.2.1.5. Rest of South Asia and Pacific 13.2.2. By Material Type 13.2.3. By Product Type 13.2.4. By End User 13.3. Market Attractiveness Analysis 13.3.1. By Country 13.3.2. By Material Type 13.3.3. By Product Type 13.3.4. By End User 13.4. Key Takeaways 14. East Asia Market Analysis 2018 to 2022 and Forecast 2023 to 2033, By Country 14.1. Historical Market Size Value (US$ Million) & Volume (Units) Trend Analysis By Market Taxonomy, 2018 to 2022 14.2. Market Size Value (US$ Million) & Volume (Units) Forecast By Market Taxonomy, 2023 to 2033 14.2.1. By Country 14.2.1.1. China 14.2.1.2. Japan 14.2.1.3. South Korea 14.2.2. By Material Type 14.2.3. By Product Type 14.2.4. By End User 14.3. Market Attractiveness Analysis 14.3.1. By Country 14.3.2. By Material Type 14.3.3. By Product Type 14.3.4. By End User 14.4. Key Takeaways 15. Middle East and Africa Market Analysis 2018 to 2022 and Forecast 2023 to 2033, By Country 15.1. Historical Market Size Value (US$ Million) & Volume (Units) Trend Analysis By Market Taxonomy, 2018 to 2022 15.2. Market Size Value (US$ Million) & Volume (Units) Forecast By Market Taxonomy, 2023 to 2033 15.2.1. By Country 15.2.1.1. GCC Countries 15.2.1.2. South Africa 15.2.1.3. Israel 15.2.1.4. Rest of MEA 15.2.2. By Material Type 15.2.3. By Product Type 15.2.4. By End User 15.3. Market Attractiveness Analysis 15.3.1. By Country 15.3.2. By Material Type 15.3.3. By Product Type 15.3.4. By End User 15.4. Key Takeaways 16. Key Countries Market Analysis 16.1. USA 16.1.1. Pricing Analysis 16.1.2. Market Share Analysis, 2022 16.1.2.1. By Material Type 16.1.2.2. By Product Type 16.1.2.3. By End User 16.2. Canada 16.2.1. Pricing Analysis 16.2.2. Market Share Analysis, 2022 16.2.2.1. By Material Type 16.2.2.2. By Product Type 16.2.2.3. By End User 16.3. Brazil 16.3.1. Pricing Analysis 16.3.2. Market Share Analysis, 2022 16.3.2.1. By Material Type 16.3.2.2. By Product Type 16.3.2.3. By End User 16.4. Mexico 16.4.1. Pricing Analysis 16.4.2. Market Share Analysis, 2022 16.4.2.1. By Material Type 16.4.2.2. By Product Type 16.4.2.3. By End User 16.5. Germany 16.5.1. Pricing Analysis 16.5.2. Market Share Analysis, 2022 16.5.2.1. By Material Type 16.5.2.2. By Product Type 16.5.2.3. By End User 16.6. UK 16.6.1. Pricing Analysis 16.6.2. Market Share Analysis, 2022 16.6.2.1. By Material Type 16.6.2.2. By Product Type 16.6.2.3. By End User 16.7. France 16.7.1. Pricing Analysis 16.7.2. Market Share Analysis, 2022 16.7.2.1. By Material Type 16.7.2.2. By Product Type 16.7.2.3. By End User 16.8. Spain 16.8.1. Pricing Analysis 16.8.2. Market Share Analysis, 2022 16.8.2.1. By Material Type 16.8.2.2. By Product Type 16.8.2.3. By End User 16.9. Italy 16.9.1. Pricing Analysis 16.9.2. Market Share Analysis, 2022 16.9.2.1. By Material Type 16.9.2.2. By Product Type 16.9.2.3. By End User 16.10. Poland 16.10.1. Pricing Analysis 16.10.2. Market Share Analysis, 2022 16.10.2.1. By Material Type 16.10.2.2. By Product Type 16.10.2.3. By End User 16.11. Russia 16.11.1. Pricing Analysis 16.11.2. Market Share Analysis, 2022 16.11.2.1. By Material Type 16.11.2.2. By Product Type 16.11.2.3. By End User 16.12. Czech Republic 16.12.1. Pricing Analysis 16.12.2. Market Share Analysis, 2022 16.12.2.1. By Material Type 16.12.2.2. By Product Type 16.12.2.3. By End User 16.13. Romania 16.13.1. Pricing Analysis 16.13.2. Market Share Analysis, 2022 16.13.2.1. By Material Type 16.13.2.2. By Product Type 16.13.2.3. By End User 16.14. India 16.14.1. Pricing Analysis 16.14.2. Market Share Analysis, 2022 16.14.2.1. By Material Type 16.14.2.2. By Product Type 16.14.2.3. By End User 16.15. Bangladesh 16.15.1. Pricing Analysis 16.15.2. Market Share Analysis, 2022 16.15.2.1. By Material Type 16.15.2.2. By Product Type 16.15.2.3. By End User 16.16. Australia 16.16.1. Pricing Analysis 16.16.2. Market Share Analysis, 2022 16.16.2.1. By Material Type 16.16.2.2. By Product Type 16.16.2.3. By End User 16.17. New Zealand 16.17.1. Pricing Analysis 16.17.2. Market Share Analysis, 2022 16.17.2.1. By Material Type 16.17.2.2. By Product Type 16.17.2.3. By End User 16.18. China 16.18.1. Pricing Analysis 16.18.2. Market Share Analysis, 2022 16.18.2.1. By Material Type 16.18.2.2. By Product Type 16.18.2.3. By End User 16.19. Japan 16.19.1. Pricing Analysis 16.19.2. Market Share Analysis, 2022 16.19.2.1. By Material Type 16.19.2.2. By Product Type 16.19.2.3. By End User 16.20. South Korea 16.20.1. Pricing Analysis 16.20.2. Market Share Analysis, 2022 16.20.2.1. By Material Type 16.20.2.2. By Product Type 16.20.2.3. By End User 16.21. GCC Countries 16.21.1. Pricing Analysis 16.21.2. Market Share Analysis, 2022 16.21.2.1. By Material Type 16.21.2.2. By Product Type 16.21.2.3. By End User 16.22. South Africa 16.22.1. Pricing Analysis 16.22.2. Market Share Analysis, 2022 16.22.2.1. By Material Type 16.22.2.2. By Product Type 16.22.2.3. By End User 16.23. Israel 16.23.1. Pricing Analysis 16.23.2. Market Share Analysis, 2022 16.23.2.1. By Material Type 16.23.2.2. By Product Type 16.23.2.3. By End User 17. Market Structure Analysis 17.1. Competition Dashboard 17.2. Competition Benchmarking 17.3. Market Share Analysis of Top Players 17.3.1. By Regional 17.3.2. By Material Type 17.3.3. By Product Type 17.3.4. By End User 18. Competition Analysis 18.1. Competition Deep Dive 18.1.1. Berry Global 18.1.1.1. Overview 18.1.1.2. Product Portfolio 18.1.1.3. Profitability by Market Segments 18.1.1.4. Sales Footprint 18.1.1.5. Strategy Overview 18.1.1.5.1. Marketing Strategy 18.1.1.5.2. Product Strategy 18.1.1.5.3. Channel Strategy 18.1.2. Mondi Group 18.1.2.1. Overview 18.1.2.2. Product Portfolio 18.1.2.3. Profitability by Market Segments 18.1.2.4. Sales Footprint 18.1.2.5. Strategy Overview 18.1.2.5.1. Marketing Strategy 18.1.2.5.2. Product Strategy 18.1.2.5.3. Channel Strategy 18.1.3. Ampac Holdings, LLC 18.1.3.1. Overview 18.1.3.2. Product Portfolio 18.1.3.3. Profitability by Market Segments 18.1.3.4. Sales Footprint 18.1.3.5. Strategy Overview 18.1.3.5.1. Marketing Strategy 18.1.3.5.2. Product Strategy 18.1.3.5.3. Channel Strategy 18.1.4. International Plastics Inc. 18.1.4.1. Overview 18.1.4.2. Product Portfolio 18.1.4.3. Profitability by Market Segments 18.1.4.4. Sales Footprint 18.1.4.5. Strategy Overview 18.1.4.5.1. Marketing Strategy 18.1.4.5.2. Product Strategy 18.1.4.5.3. Channel Strategy 18.1.5. BioInternational AS 18.1.5.1. Overview 18.1.5.2. Product Portfolio 18.1.5.3. Profitability by Market Segments 18.1.5.4. Sales Footprint 18.1.5.5. Strategy Overview 18.1.5.5.1. Marketing Strategy 18.1.5.5.2. Product Strategy 18.1.5.5.3. Channel Strategy 18.1.6. Smurfit Kappa 18.1.6.1. Overview 18.1.6.2. Product Portfolio 18.1.6.3. Profitability by Market Segments 18.1.6.4. Sales Footprint 18.1.6.5. Strategy Overview 18.1.6.5.1. Marketing Strategy 18.1.6.5.2. Product Strategy 18.1.6.5.3. Channel Strategy 18.1.7. WestRock Company 18.1.7.1. Overview 18.1.7.2. Product Portfolio 18.1.7.3. Profitability by Market Segments 18.1.7.4. Sales Footprint 18.1.7.5. Strategy Overview 18.1.7.5.1. Marketing Strategy 18.1.7.5.2. Product Strategy 18.1.7.5.3. Channel Strategy 18.1.8. Billerudkorsnas 18.1.8.1. Overview 18.1.8.2. Product Portfolio 18.1.8.3. Profitability by Market Segments 18.1.8.4. Sales Footprint 18.1.8.5. Strategy Overview 18.1.8.5.1. Marketing Strategy 18.1.8.5.2. Product Strategy 18.1.8.5.3. Channel Strategy 18.1.9. Huhtamaki Oyj. 18.1.9.1. Overview 18.1.9.2. Product Portfolio 18.1.9.3. Profitability by Market Segments 18.1.9.4. Sales Footprint 18.1.9.5. Strategy Overview 18.1.9.5.1. Marketing Strategy 18.1.9.5.2. Product Strategy 18.1.9.5.3. Channel Strategy 18.1.10. Fischer Company 18.1.10.1. Overview 18.1.10.2. Product Portfolio 18.1.10.3. Profitability by Market Segments 18.1.10.4. Sales Footprint 18.1.10.5. Strategy Overview 18.1.10.5.1. Marketing Strategy 18.1.10.5.2. Product Strategy 18.1.10.5.3. Channel Strategy 19. Assumptions & Acronyms Used 20. Research Methodology
Don't pay for what you don't need
Customize your report by selecting specific countries or regions and save 30%!
Table 1: Global Market Value (US$ Million) Forecast by Region, 2018 to 2033 Table 2: Global Market Volume (Units) Forecast by Region, 2018 to 2033 Table 3: Global Market Value (US$ Million) Forecast by Material Type, 2018 to 2033 Table 4: Global Market Volume (Units) Forecast by Material Type, 2018 to 2033 Table 5: Global Market Value (US$ Million) Forecast by Product Type, 2018 to 2033 Table 6: Global Market Volume (Units) Forecast by Product Type, 2018 to 2033 Table 7: Global Market Value (US$ Million) Forecast by End User, 2018 to 2033 Table 8: Global Market Volume (Units) Forecast by End User, 2018 to 2033 Table 9: North America Market Value (US$ Million) Forecast by Country, 2018 to 2033 Table 10: North America Market Volume (Units) Forecast by Country, 2018 to 2033 Table 11: North America Market Value (US$ Million) Forecast by Material Type, 2018 to 2033 Table 12: North America Market Volume (Units) Forecast by Material Type, 2018 to 2033 Table 13: North America Market Value (US$ Million) Forecast by Product Type, 2018 to 2033 Table 14: North America Market Volume (Units) Forecast by Product Type, 2018 to 2033 Table 15: North America Market Value (US$ Million) Forecast by End User, 2018 to 2033 Table 16: North America Market Volume (Units) Forecast by End User, 2018 to 2033 Table 17: Latin America Market Value (US$ Million) Forecast by Country, 2018 to 2033 Table 18: Latin America Market Volume (Units) Forecast by Country, 2018 to 2033 Table 19: Latin America Market Value (US$ Million) Forecast by Material Type, 2018 to 2033 Table 20: Latin America Market Volume (Units) Forecast by Material Type, 2018 to 2033 Table 21: Latin America Market Value (US$ Million) Forecast by Product Type, 2018 to 2033 Table 22: Latin America Market Volume (Units) Forecast by Product Type, 2018 to 2033 Table 23: Latin America Market Value (US$ Million) Forecast by End User, 2018 to 2033 Table 24: Latin America Market Volume (Units) Forecast by End User, 2018 to 2033 Table 25: Western Europe Market Value (US$ Million) Forecast by Country, 2018 to 2033 Table 26: Western Europe Market Volume (Units) Forecast by Country, 2018 to 2033 Table 27: Western Europe Market Value (US$ Million) Forecast by Material Type, 2018 to 2033 Table 28: Western Europe Market Volume (Units) Forecast by Material Type, 2018 to 2033 Table 29: Western Europe Market Value (US$ Million) Forecast by Product Type, 2018 to 2033 Table 30: Western Europe Market Volume (Units) Forecast by Product Type, 2018 to 2033 Table 31: Western Europe Market Value (US$ Million) Forecast by End User, 2018 to 2033 Table 32: Western Europe Market Volume (Units) Forecast by End User, 2018 to 2033 Table 33: Eastern Europe Market Value (US$ Million) Forecast by Country, 2018 to 2033 Table 34: Eastern Europe Market Volume (Units) Forecast by Country, 2018 to 2033 Table 35: Eastern Europe Market Value (US$ Million) Forecast by Material Type, 2018 to 2033 Table 36: Eastern Europe Market Volume (Units) Forecast by Material Type, 2018 to 2033 Table 37: Eastern Europe Market Value (US$ Million) Forecast by Product Type, 2018 to 2033 Table 38: Eastern Europe Market Volume (Units) Forecast by Product Type, 2018 to 2033 Table 39: Eastern Europe Market Value (US$ Million) Forecast by End User, 2018 to 2033 Table 40: Eastern Europe Market Volume (Units) Forecast by End User, 2018 to 2033 Table 41: South Asia and Pacific Market Value (US$ Million) Forecast by Country, 2018 to 2033 Table 42: South Asia and Pacific Market Volume (Units) Forecast by Country, 2018 to 2033 Table 43: South Asia and Pacific Market Value (US$ Million) Forecast by Material Type, 2018 to 2033 Table 44: South Asia and Pacific Market Volume (Units) Forecast by Material Type, 2018 to 2033 Table 45: South Asia and Pacific Market Value (US$ Million) Forecast by Product Type, 2018 to 2033 Table 46: South Asia and Pacific Market Volume (Units) Forecast by Product Type, 2018 to 2033 Table 47: South Asia and Pacific Market Value (US$ Million) Forecast by End User, 2018 to 2033 Table 48: South Asia and Pacific Market Volume (Units) Forecast by End User, 2018 to 2033 Table 49: East Asia Market Value (US$ Million) Forecast by Country, 2018 to 2033 Table 50: East Asia Market Volume (Units) Forecast by Country, 2018 to 2033 Table 51: East Asia Market Value (US$ Million) Forecast by Material Type, 2018 to 2033 Table 52: East Asia Market Volume (Units) Forecast by Material Type, 2018 to 2033 Table 53: East Asia Market Value (US$ Million) Forecast by Product Type, 2018 to 2033 Table 54: East Asia Market Volume (Units) Forecast by Product Type, 2018 to 2033 Table 55: East Asia Market Value (US$ Million) Forecast by End User, 2018 to 2033 Table 56: East Asia Market Volume (Units) Forecast by End User, 2018 to 2033 Table 57: Middle East and Africa Market Value (US$ Million) Forecast by Country, 2018 to 2033 Table 58: Middle East and Africa Market Volume (Units) Forecast by Country, 2018 to 2033 Table 59: Middle East and Africa Market Value (US$ Million) Forecast by Material Type, 2018 to 2033 Table 60: Middle East and Africa Market Volume (Units) Forecast by Material Type, 2018 to 2033 Table 61: Middle East and Africa Market Value (US$ Million) Forecast by Product Type, 2018 to 2033 Table 62: Middle East and Africa Market Volume (Units) Forecast by Product Type, 2018 to 2033 Table 63: Middle East and Africa Market Value (US$ Million) Forecast by End User, 2018 to 2033 Table 64: Middle East and Africa Market Volume (Units) Forecast by End User, 2018 to 2033
Figure 1: Global Market Value (US$ Million) by Material Type, 2023 to 2033 Figure 2: Global Market Value (US$ Million) by Product Type, 2023 to 2033 Figure 3: Global Market Value (US$ Million) by End User, 2023 to 2033 Figure 4: Global Market Value (US$ Million) by Region, 2023 to 2033 Figure 5: Global Market Value (US$ Million) Analysis by Region, 2018 to 2033 Figure 6: Global Market Volume (Units) Analysis by Region, 2018 to 2033 Figure 7: Global Market Value Share (%) and BPS Analysis by Region, 2023 to 2033 Figure 8: Global Market Y-o-Y Growth (%) Projections by Region, 2023 to 2033 Figure 9: Global Market Value (US$ Million) Analysis by Material Type, 2018 to 2033 Figure 10: Global Market Volume (Units) Analysis by Material Type, 2018 to 2033 Figure 11: Global Market Value Share (%) and BPS Analysis by Material Type, 2023 to 2033 Figure 12: Global Market Y-o-Y Growth (%) Projections by Material Type, 2023 to 2033 Figure 13: Global Market Value (US$ Million) Analysis by Product Type, 2018 to 2033 Figure 14: Global Market Volume (Units) Analysis by Product Type, 2018 to 2033 Figure 15: Global Market Value Share (%) and BPS Analysis by Product Type, 2023 to 2033 Figure 16: Global Market Y-o-Y Growth (%) Projections by Product Type, 2023 to 2033 Figure 17: Global Market Value (US$ Million) Analysis by End User, 2018 to 2033 Figure 18: Global Market Volume (Units) Analysis by End User, 2018 to 2033 Figure 19: Global Market Value Share (%) and BPS Analysis by End User, 2023 to 2033 Figure 20: Global Market Y-o-Y Growth (%) Projections by End User, 2023 to 2033 Figure 21: Global Market Attractiveness by Material Type, 2023 to 2033 Figure 22: Global Market Attractiveness by Product Type, 2023 to 2033 Figure 23: Global Market Attractiveness by End User, 2023 to 2033 Figure 24: Global Market Attractiveness by Region, 2023 to 2033 Figure 25: North America Market Value (US$ Million) by Material Type, 2023 to 2033 Figure 26: North America Market Value (US$ Million) by Product Type, 2023 to 2033 Figure 27: North America Market Value (US$ Million) by End User, 2023 to 2033 Figure 28: North America Market Value (US$ Million) by Country, 2023 to 2033 Figure 29: North America Market Value (US$ Million) Analysis by Country, 2018 to 2033 Figure 30: North America Market Volume (Units) Analysis by Country, 2018 to 2033 Figure 31: North America Market Value Share (%) and BPS Analysis by Country, 2023 to 2033 Figure 32: North America Market Y-o-Y Growth (%) Projections by Country, 2023 to 2033 Figure 33: North America Market Value (US$ Million) Analysis by Material Type, 2018 to 2033 Figure 34: North America Market Volume (Units) Analysis by Material Type, 2018 to 2033 Figure 35: North America Market Value Share (%) and BPS Analysis by Material Type, 2023 to 2033 Figure 36: North America Market Y-o-Y Growth (%) Projections by Material Type, 2023 to 2033 Figure 37: North America Market Value (US$ Million) Analysis by Product Type, 2018 to 2033 Figure 38: North America Market Volume (Units) Analysis by Product Type, 2018 to 2033 Figure 39: North America Market Value Share (%) and BPS Analysis by Product Type, 2023 to 2033 Figure 40: North America Market Y-o-Y Growth (%) Projections by Product Type, 2023 to 2033 Figure 41: North America Market Value (US$ Million) Analysis by End User, 2018 to 2033 Figure 42: North America Market Volume (Units) Analysis by End User, 2018 to 2033 Figure 43: North America Market Value Share (%) and BPS Analysis by End User, 2023 to 2033 Figure 44: North America Market Y-o-Y Growth (%) Projections by End User, 2023 to 2033 Figure 45: North America Market Attractiveness by Material Type, 2023 to 2033 Figure 46: North America Market Attractiveness by Product Type, 2023 to 2033 Figure 47: North America Market Attractiveness by End User, 2023 to 2033 Figure 48: North America Market Attractiveness by Country, 2023 to 2033 Figure 49: Latin America Market Value (US$ Million) by Material Type, 2023 to 2033 Figure 50: Latin America Market Value (US$ Million) by Product Type, 2023 to 2033 Figure 51: Latin America Market Value (US$ Million) by End User, 2023 to 2033 Figure 52: Latin America Market Value (US$ Million) by Country, 2023 to 2033 Figure 53: Latin America Market Value (US$ Million) Analysis by Country, 2018 to 2033 Figure 54: Latin America Market Volume (Units) Analysis by Country, 2018 to 2033 Figure 55: Latin America Market Value Share (%) and BPS Analysis by Country, 2023 to 2033 Figure 56: Latin America Market Y-o-Y Growth (%) Projections by Country, 2023 to 2033 Figure 57: Latin America Market Value (US$ Million) Analysis by Material Type, 2018 to 2033 Figure 58: Latin America Market Volume (Units) Analysis by Material Type, 2018 to 2033 Figure 59: Latin America Market Value Share (%) and BPS Analysis by Material Type, 2023 to 2033 Figure 60: Latin America Market Y-o-Y Growth (%) Projections by Material Type, 2023 to 2033 Figure 61: Latin America Market Value (US$ Million) Analysis by Product Type, 2018 to 2033 Figure 62: Latin America Market Volume (Units) Analysis by Product Type, 2018 to 2033 Figure 63: Latin America Market Value Share (%) and BPS Analysis by Product Type, 2023 to 2033 Figure 64: Latin America Market Y-o-Y Growth (%) Projections by Product Type, 2023 to 2033 Figure 65: Latin America Market Value (US$ Million) Analysis by End User, 2018 to 2033 Figure 66: Latin America Market Volume (Units) Analysis by End User, 2018 to 2033 Figure 67: Latin America Market Value Share (%) and BPS Analysis by End User, 2023 to 2033 Figure 68: Latin America Market Y-o-Y Growth (%) Projections by End User, 2023 to 2033 Figure 69: Latin America Market Attractiveness by Material Type, 2023 to 2033 Figure 70: Latin America Market Attractiveness by Product Type, 2023 to 2033 Figure 71: Latin America Market Attractiveness by End User, 2023 to 2033 Figure 72: Latin America Market Attractiveness by Country, 2023 to 2033 Figure 73: Western Europe Market Value (US$ Million) by Material Type, 2023 to 2033 Figure 74: Western Europe Market Value (US$ Million) by Product Type, 2023 to 2033 Figure 75: Western Europe Market Value (US$ Million) by End User, 2023 to 2033 Figure 76: Western Europe Market Value (US$ Million) by Country, 2023 to 2033 Figure 77: Western Europe Market Value (US$ Million) Analysis by Country, 2018 to 2033 Figure 78: Western Europe Market Volume (Units) Analysis by Country, 2018 to 2033 Figure 79: Western Europe Market Value Share (%) and BPS Analysis by Country, 2023 to 2033 Figure 80: Western Europe Market Y-o-Y Growth (%) Projections by Country, 2023 to 2033 Figure 81: Western Europe Market Value (US$ Million) Analysis by Material Type, 2018 to 2033 Figure 82: Western Europe Market Volume (Units) Analysis by Material Type, 2018 to 2033 Figure 83: Western Europe Market Value Share (%) and BPS Analysis by Material Type, 2023 to 2033 Figure 84: Western Europe Market Y-o-Y Growth (%) Projections by Material Type, 2023 to 2033 Figure 85: Western Europe Market Value (US$ Million) Analysis by Product Type, 2018 to 2033 Figure 86: Western Europe Market Volume (Units) Analysis by Product Type, 2018 to 2033 Figure 87: Western Europe Market Value Share (%) and BPS Analysis by Product Type, 2023 to 2033 Figure 88: Western Europe Market Y-o-Y Growth (%) Projections by Product Type, 2023 to 2033 Figure 89: Western Europe Market Value (US$ Million) Analysis by End User, 2018 to 2033 Figure 90: Western Europe Market Volume (Units) Analysis by End User, 2018 to 2033 Figure 91: Western Europe Market Value Share (%) and BPS Analysis by End User, 2023 to 2033 Figure 92: Western Europe Market Y-o-Y Growth (%) Projections by End User, 2023 to 2033 Figure 93: Western Europe Market Attractiveness by Material Type, 2023 to 2033 Figure 94: Western Europe Market Attractiveness by Product Type, 2023 to 2033 Figure 95: Western Europe Market Attractiveness by End User, 2023 to 2033 Figure 96: Western Europe Market Attractiveness by Country, 2023 to 2033 Figure 97: Eastern Europe Market Value (US$ Million) by Material Type, 2023 to 2033 Figure 98: Eastern Europe Market Value (US$ Million) by Product Type, 2023 to 2033 Figure 99: Eastern Europe Market Value (US$ Million) by End User, 2023 to 2033 Figure 100: Eastern Europe Market Value (US$ Million) by Country, 2023 to 2033 Figure 101: Eastern Europe Market Value (US$ Million) Analysis by Country, 2018 to 2033 Figure 102: Eastern Europe Market Volume (Units) Analysis by Country, 2018 to 2033 Figure 103: Eastern Europe Market Value Share (%) and BPS Analysis by Country, 2023 to 2033 Figure 104: Eastern Europe Market Y-o-Y Growth (%) Projections by Country, 2023 to 2033 Figure 105: Eastern Europe Market Value (US$ Million) Analysis by Material Type, 2018 to 2033 Figure 106: Eastern Europe Market Volume (Units) Analysis by Material Type, 2018 to 2033 Figure 107: Eastern Europe Market Value Share (%) and BPS Analysis by Material Type, 2023 to 2033 Figure 108: Eastern Europe Market Y-o-Y Growth (%) Projections by Material Type, 2023 to 2033 Figure 109: Eastern Europe Market Value (US$ Million) Analysis by Product Type, 2018 to 2033 Figure 110: Eastern Europe Market Volume (Units) Analysis by Product Type, 2018 to 2033 Figure 111: Eastern Europe Market Value Share (%) and BPS Analysis by Product Type, 2023 to 2033 Figure 112: Eastern Europe Market Y-o-Y Growth (%) Projections by Product Type, 2023 to 2033 Figure 113: Eastern Europe Market Value (US$ Million) Analysis by End User, 2018 to 2033 Figure 114: Eastern Europe Market Volume (Units) Analysis by End User, 2018 to 2033 Figure 115: Eastern Europe Market Value Share (%) and BPS Analysis by End User, 2023 to 2033 Figure 116: Eastern Europe Market Y-o-Y Growth (%) Projections by End User, 2023 to 2033 Figure 117: Eastern Europe Market Attractiveness by Material Type, 2023 to 2033 Figure 118: Eastern Europe Market Attractiveness by Product Type, 2023 to 2033 Figure 119: Eastern Europe Market Attractiveness by End User, 2023 to 2033 Figure 120: Eastern Europe Market Attractiveness by Country, 2023 to 2033 Figure 121: South Asia and Pacific Market Value (US$ Million) by Material Type, 2023 to 2033 Figure 122: South Asia and Pacific Market Value (US$ Million) by Product Type, 2023 to 2033 Figure 123: South Asia and Pacific Market Value (US$ Million) by End User, 2023 to 2033 Figure 124: South Asia and Pacific Market Value (US$ Million) by Country, 2023 to 2033 Figure 125: South Asia and Pacific Market Value (US$ Million) Analysis by Country, 2018 to 2033 Figure 126: South Asia and Pacific Market Volume (Units) Analysis by Country, 2018 to 2033 Figure 127: South Asia and Pacific Market Value Share (%) and BPS Analysis by Country, 2023 to 2033 Figure 128: South Asia and Pacific Market Y-o-Y Growth (%) Projections by Country, 2023 to 2033 Figure 129: South Asia and Pacific Market Value (US$ Million) Analysis by Material Type, 2018 to 2033 Figure 130: South Asia and Pacific Market Volume (Units) Analysis by Material Type, 2018 to 2033 Figure 131: South Asia and Pacific Market Value Share (%) and BPS Analysis by Material Type, 2023 to 2033 Figure 132: South Asia and Pacific Market Y-o-Y Growth (%) Projections by Material Type, 2023 to 2033 Figure 133: South Asia and Pacific Market Value (US$ Million) Analysis by Product Type, 2018 to 2033 Figure 134: South Asia and Pacific Market Volume (Units) Analysis by Product Type, 2018 to 2033 Figure 135: South Asia and Pacific Market Value Share (%) and BPS Analysis by Product Type, 2023 to 2033 Figure 136: South Asia and Pacific Market Y-o-Y Growth (%) Projections by Product Type, 2023 to 2033 Figure 137: South Asia and Pacific Market Value (US$ Million) Analysis by End User, 2018 to 2033 Figure 138: South Asia and Pacific Market Volume (Units) Analysis by End User, 2018 to 2033 Figure 139: South Asia and Pacific Market Value Share (%) and BPS Analysis by End User, 2023 to 2033 Figure 140: South Asia and Pacific Market Y-o-Y Growth (%) Projections by End User, 2023 to 2033 Figure 141: South Asia and Pacific Market Attractiveness by Material Type, 2023 to 2033 Figure 142: South Asia and Pacific Market Attractiveness by Product Type, 2023 to 2033 Figure 143: South Asia and Pacific Market Attractiveness by End User, 2023 to 2033 Figure 144: South Asia and Pacific Market Attractiveness by Country, 2023 to 2033 Figure 145: East Asia Market Value (US$ Million) by Material Type, 2023 to 2033 Figure 146: East Asia Market Value (US$ Million) by Product Type, 2023 to 2033 Figure 147: East Asia Market Value (US$ Million) by End User, 2023 to 2033 Figure 148: East Asia Market Value (US$ Million) by Country, 2023 to 2033 Figure 149: East Asia Market Value (US$ Million) Analysis by Country, 2018 to 2033 Figure 150: East Asia Market Volume (Units) Analysis by Country, 2018 to 2033 Figure 151: East Asia Market Value Share (%) and BPS Analysis by Country, 2023 to 2033 Figure 152: East Asia Market Y-o-Y Growth (%) Projections by Country, 2023 to 2033 Figure 153: East Asia Market Value (US$ Million) Analysis by Material Type, 2018 to 2033 Figure 154: East Asia Market Volume (Units) Analysis by Material Type, 2018 to 2033 Figure 155: East Asia Market Value Share (%) and BPS Analysis by Material Type, 2023 to 2033 Figure 156: East Asia Market Y-o-Y Growth (%) Projections by Material Type, 2023 to 2033 Figure 157: East Asia Market Value (US$ Million) Analysis by Product Type, 2018 to 2033 Figure 158: East Asia Market Volume (Units) Analysis by Product Type, 2018 to 2033 Figure 159: East Asia Market Value Share (%) and BPS Analysis by Product Type, 2023 to 2033 Figure 160: East Asia Market Y-o-Y Growth (%) Projections by Product Type, 2023 to 2033 Figure 161: East Asia Market Value (US$ Million) Analysis by End User, 2018 to 2033 Figure 162: East Asia Market Volume (Units) Analysis by End User, 2018 to 2033 Figure 163: East Asia Market Value Share (%) and BPS Analysis by End User, 2023 to 2033 Figure 164: East Asia Market Y-o-Y Growth (%) Projections by End User, 2023 to 2033 Figure 165: East Asia Market Attractiveness by Material Type, 2023 to 2033 Figure 166: East Asia Market Attractiveness by Product Type, 2023 to 2033 Figure 167: East Asia Market Attractiveness by End User, 2023 to 2033 Figure 168: East Asia Market Attractiveness by Country, 2023 to 2033 Figure 169: Middle East and Africa Market Value (US$ Million) by Material Type, 2023 to 2033 Figure 170: Middle East and Africa Market Value (US$ Million) by Product Type, 2023 to 2033 Figure 171: Middle East and Africa Market Value (US$ Million) by End User, 2023 to 2033 Figure 172: Middle East and Africa Market Value (US$ Million) by Country, 2023 to 2033 Figure 173: Middle East and Africa Market Value (US$ Million) Analysis by Country, 2018 to 2033 Figure 174: Middle East and Africa Market Volume (Units) Analysis by Country, 2018 to 2033 Figure 175: Middle East and Africa Market Value Share (%) and BPS Analysis by Country, 2023 to 2033 Figure 176: Middle East and Africa Market Y-o-Y Growth (%) Projections by Country, 2023 to 2033 Figure 177: Middle East and Africa Market Value (US$ Million) Analysis by Material Type, 2018 to 2033 Figure 178: Middle East and Africa Market Volume (Units) Analysis by Material Type, 2018 to 2033 Figure 179: Middle East and Africa Market Value Share (%) and BPS Analysis by Material Type, 2023 to 2033 Figure 180: Middle East and Africa Market Y-o-Y Growth (%) Projections by Material Type, 2023 to 2033 Figure 181: Middle East and Africa Market Value (US$ Million) Analysis by Product Type, 2018 to 2033 Figure 182: Middle East and Africa Market Volume (Units) Analysis by Product Type, 2018 to 2033 Figure 183: Middle East and Africa Market Value Share (%) and BPS Analysis by Product Type, 2023 to 2033 Figure 184: Middle East and Africa Market Y-o-Y Growth (%) Projections by Product Type, 2023 to 2033 Figure 185: Middle East and Africa Market Value (US$ Million) Analysis by End User, 2018 to 2033 Figure 186: Middle East and Africa Market Volume (Units) Analysis by End User, 2018 to 2033 Figure 187: Middle East and Africa Market Value Share (%) and BPS Analysis by End User, 2023 to 2033 Figure 188: Middle East and Africa Market Y-o-Y Growth (%) Projections by End User, 2023 to 2033 Figure 189: Middle East and Africa Market Attractiveness by Material Type, 2023 to 2033 Figure 190: Middle East and Africa Market Attractiveness by Product Type, 2023 to 2033 Figure 191: Middle East and Africa Market Attractiveness by End User, 2023 to 2033 Figure 192: Middle East and Africa Market Attractiveness by Country, 2023 to 2033
Recommendations
Explore Packaging Insights
View Reports