Bagging Equipment Market Outlook

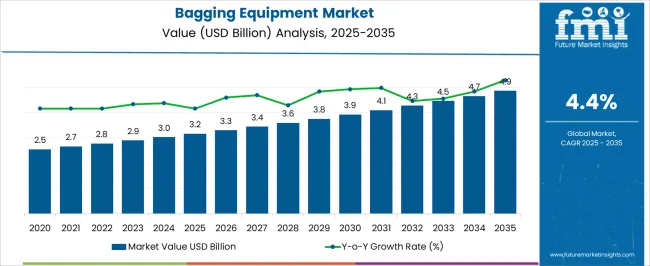
The bagging equipment market is registering a valuation of US$ 2.9 billion in 2023. The market is expected to be worth US$ 4.5 billion by 2033. The market is likely to secure a CAGR of 4.4% during the forecast period.

The global market is influenced by various driving factors, including

  • Increased demand from end-use industries: The demand for bagging equipment is primarily driven by the growth in end-use industries such as food and beverage, pharmaceuticals, and construction. The increasing demand for packaged products from these industries has increased the adoption of bagging equipment.
  • Advancements in technology: Technological advancements in bagging equipment have improved its performance and efficiency. The use of automation and robotics in bagging equipment has made it more accurate and faster, leading to increased adoption.
  • Growing focus on sustainability: There is an increasing demand for sustainable packaging solutions, which has led to the development of eco-friendly bagging equipment. These sustainable solutions are gaining popularity and increasing demand for bagging equipment.
  • Government regulations: Regulations such as the Food Safety Modernization Act (FSMA) have increased the demand for bagging equipment that meets safety and compliance standards.
  • Growing demand for customized bagging equipment: Customers increasingly demand it to meet their specific needs. It has led to the development of innovative bagging solutions, driving the growth of the bagging equipment market.

Don't pay for what you don't need

Customize your report by selecting specific countries or regions and save 30%!

Lack of Skilled Workforce Restrain the Market Growth

Along with the driving factors, the market also faces sure restrain factors, including

  • High capital investment: The initial cost of acquiring bagging equipment is high, and this could be a barrier for smaller businesses that cannot afford the capital investment. It can hinder the growth of the bagging equipment market.
  • Maintenance and operational costs: The maintenance and operational costs of bagging equipment are high, which can be challenging for some businesses. It can affect the adoption of bagging equipment in various industries.
  • Availability of alternatives: There are alternatives to bagging equipment, such as manual packaging, which can be cheaper for small-scale operations to restrain market growth.
  • COVID-19 impact: Like many other industries, the global market has been affected by the Covid-19 pandemic. The disruption in supply chains and decreased demand for certain products has led to a decline in the global market.
  • Lack of skilled workforce: The operation of bagging equipment requires skilled workers, and the shortage of such workers can hinder the growth of the bagging equipment market. The lack of trained professionals in the industry can affect the adoption of bagging equipment.
Attributes Details
Market CAGR (2023 to 2033) 4.4%
Market Valuation (2023) US$ 2.9 billion
Market Valuation (2033) US$ 4.5 billion

Bagging Equipment Market, 2018 to 2022 Historical Sales, Compared to 2023 to 2033 Future Outlook 

The food and beverage, pharmaceutical, and chemical industries mainly drove the market. It required efficient and high-speed bagging solutions to improve its manufacturing processes.

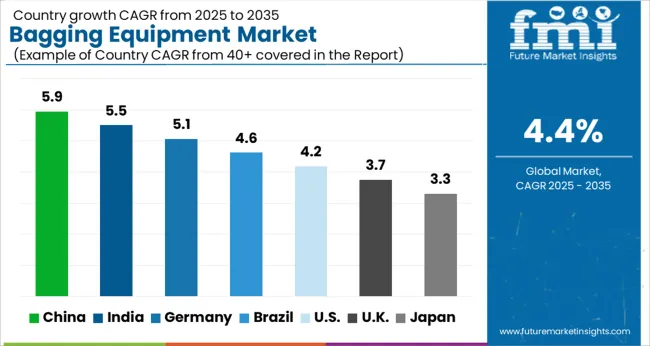
According to Future Market Insights reports, the market is expected to record a CAGR of around 4.4% from 2023 to 2033. Asia Pacific is a significantly growing market due to the increasing demand for packaging solutions in emerging economies such as China and India.

The rising awareness about sustainability and eco-friendly packaging is also expected to boost the demand for innovative and environment-friendly bagging equipment solutions in the market.

  • Short Term (2023 to 2026): The growing consumer demand for sustainable, high-quality bagging equipment is increasing the market size in this time frame. Manufacturers in developed countries are expanding and improving bagging equipment by adopting several marketing tactics to drive the market size.
  • Medium Term (2026 to 2029): The increase in advanced technologies and rapid urbanization are propelling the market size. The key companies are investing considerable amounts in innovating unique products to attract consumers' attention is fueling the market size.
  • Long Term (2028 to 2033): Rising research & development activities, huge investments, government supports, and present critical players are advancing the market size. The growing popularity of environment-friendly bagging equipment due to rising environmental concerns advancing market opportunities.
Ismail Sutaria
Ismail Sutaria

Principal Consultant

Talk to Analyst

Find your sweet spots for generating winning opportunities in this market.

Comparative Analysis of Adjacent Markets 

Bagging Equipment Market:

Attributes Bagging Equipment Market
CAGR (2023 to 2033) 4.4%
Value (2023) US$ 4.5 billion
Value (2033) US$ 2.9 billion
Trends Increasing demand for sustainable, environment-friendly, and customized bagging equipment are fueling the market size.
Opportunities Changing consumer Prefrence toward sustainable products is the key opportunity

Food Packaging Equipment Market:

Attributes Food Packaging Equipment Market
CAGR (2023 to 2033) 6.3%
Value (2023) US$ 20.30 billion
Value (2033) US$ 37.40 billion
Trends Increasing consumer awareness of hygienic food products and easy-to-carry packaging are increasing market trends.
Opportunities Growing new technologies, research & development activities, and innovation of products are propelling market opportunities.

Packaging Equipment Market:

Attributes Packaging Equipment Market
CAGR (2023 to 2033) 4%
Value (2023) US$ 39.37 billion
Value (2033) US$ 58.28 billion
Trends Growing AI advanced technologies, autonomous packaging solutions, and productive packaging fueling the market trends.
Opportunities Increasing investments by market players and government support toward research & development activities are propelling the market.

The Top Categories in the Global Market are

Fully Automatic Segment Dominate the Global Market

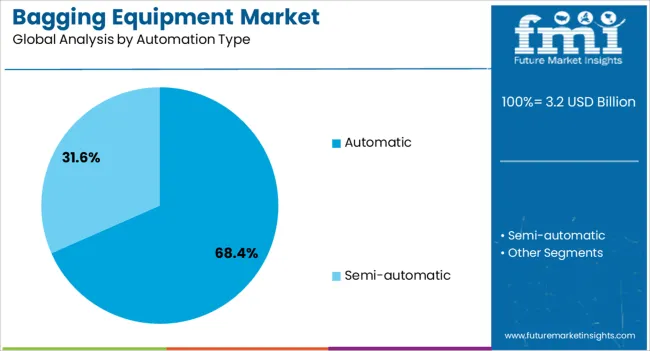
Based on automation type, the fully automatic segment dominates the global market by securing a higher share during the forecast period. The fully automatic bagging equipment offers high-speed and efficient solutions, reducing labor costs and increasing productivity. Additionally, fully automatic bagging equipment can handle various bag sizes and materials. It is a popular choice across various industries, including food and beverage, pharmaceutical, chemical, etc.

Semi-automatic bagging equipment is widely used, particularly in small and medium-scale industries. However, fully automatic bagging equipment is becoming increasingly popular due to its advantages over semi-automatic.

The demand for fully automatic bagging equipment is expected to grow in the coming years due to its faster and more efficient solutions. However, the cost of fully automatic bagging equipment is generally higher than semi-automatic equipment, which may limit its adoption due to limited budgets.

Food & Beverage Sector Leads the Global Market

The food and beverage sector dominates the global market in terms of end-use. It is because bagging equipment is widely used in the food and beverage industry for packaging various products such as snacks, cereal, tea, and others.

The pharmaceutical industry is another significant end-user of bagging equipment. This sector rises due to its stringent packaging requirements, including a sterile environment, accurate dosing, and tamper-evident packaging. The chemical industry also uses bagging equipment for packaging and handling powders and granular materials.

However, the food and beverage industry accounts for a maximum share of the market. The food & beverages sector is increasing due to changing consumer preferences and the need for more efficient packaging solutions. The growing trend towards sustainable and eco-friendly packaging is also expected to drive the demand for innovative, eco-friendly bagging equipment solutions.
Get the data you need at a Fraction of the cost

Personalize your report by choosing insights you need
and save 40%!

Overview of Top Countries in the Global Market

Rising Demand for Bagging Equipment in the Food Industry Drive the United States Market

The market in the United States is mainly driven by the country's manufacturing industry, including the food and beverage, pharmaceutical, and chemical industries, by 2033.

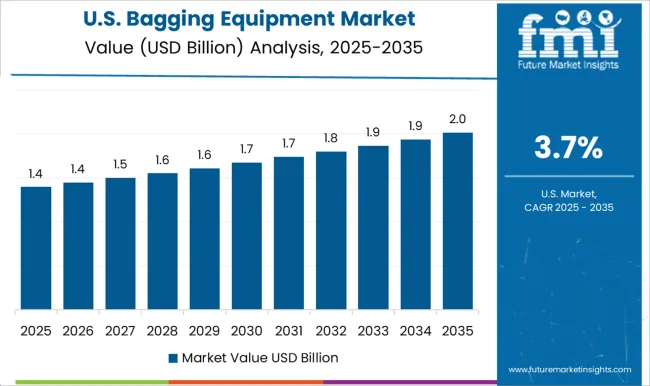
According to a report, the market in the United States was valued at around US$ 1.1 billion in 2018. The market is expected to register a CAGR of around 4.2% from 2019 to 2024.

The growing demand for packaged food and beverages drives this sector's demand for bagging equipment. The bagging equipment is a more efficient and advanced packaging solution.

The pharmaceutical industry is another significant end-user of bagging equipment in the United States. The increasing demand for personalized medicines and other specialty drugs is driving the industry's demand for more advanced and automated bagging solutions.

The chemical industry, further, is a significant end-user of bagging equipment in the United States. The industry requires bagging equipment for packaging and handling various powders and granular materials.

Rising Key Manufacturers Upsurge China Market Growth

China's bagging equipment market has seen steady growth in recent years, driven by the country's strong manufacturing industry and increasing demand for automation in various sectors. Bagging equipment packages products in bags or pouches and can be found in food and beverage, pharmaceuticals, and chemicals.

In China, several domestic manufacturers produce bagging equipment, as well as international companies with a presence in the market. Some key players in the market include Beijing Huihong Machinery, Anhui Zengran Packaging Technology, and Shanghai Xinyue Machinery.

Factors driving growth in the market in China include the increasing need for efficient and automated packaging solutions and the country's focus on improving its manufacturing capabilities and productivity. However, the market is also faced with challenges such as increasing competition and rising raw materials and labor costs.

Overall, China's bagging equipment market is expected to grow in the coming years, driven by increased demand for automation, technological advancements, and expanding manufacturing industry.
Growing Advanced Technology Drives Indian Market Size

The market in India is driven by the country's strong manufacturing industry and increasing demand for automation in various sectors. Bagging equipment packages products in bags or pouches and can be found in food and beverage, pharmaceuticals, and chemicals.

In India, several domestic manufacturers produce bagging equipment, as well as international companies with a presence in the market. A few of the leading players in the market include Nichrome India Ltd., Adelphi Group, and All-Fill India Pvt. Ltd.

Factors driving growth in the Indian market include the increasing need for efficient and automated packaging solutions and its manufacturing capabilities and productivity. However, the market is also faced with challenges such as increasing competition and rising raw materials and labor costs.

Overall, India's bagging equipment market is expected to grow in the coming years, driven by increased demand for automation, technological advancements, and expanding manufacturing industry.

Competitive Landscape

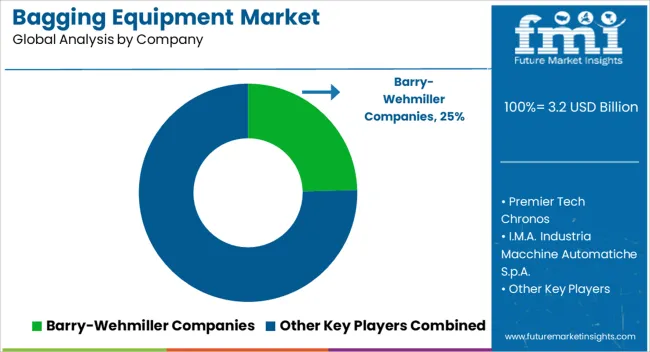
The global market is highly competitive and is characterized by the presence of both domestic and international players. A few of the key players operating in this market include

  • Premier Tech Chronos: A Canadian company that provides bagging equipment, among other packaging solutions, for industries such as agriculture, food, and industrial.
  • I.M.A. Industria Macchine Automatiche S.p.A.: An Italian company that provides packaging solutions, including bagging equipment, for industries such as pharmaceuticals, cosmetics, and food.

The competition in the market is mainly driven by product innovation, pricing strategies, and expanding geographical reach. Companies in this market also improve their after-sales service to attract and retain customers. Additionally, mergers and acquisitions are expected as companies seek to expand their product portfolios and market presence.

Recent Development in the Market are

  • In 2020, Barry-Wehmiller acquired DL Tech, a French company specializing in converting equipment for the packaging industry, which expanded Barry-Wehmiller's offerings in the European market.
  • In 2021, Premier Tech acquired M.J. Maillis, a company specializing in packaging systems and solutions, which enhances Premier Tech's product portfolio and geographic reach.
  • In 2020, I.M.A. acquired the business unit of Ilapak, a Swiss company specializing in packaging equipment, which expanded I.M.A.'s product portfolio and market presence.
  • In 2021, Nichrome launched a new range of pouch packaging machines called Sprint 250 PLUS, designed for high-speed packaging of snacks, namkeen, and other products.
  • In 2021, All-Fill launched the Auger Filler Selector Tool on its website, which allows customers to quickly and easily select the best auger filler for their specific application.

Other Prominent Players in the Market are

  • Barry-Wehmiller Companies
  • Premier Tech Chronos
  • I.M.A. Industria Macchine Automatiche S.p.A.
  • Nichrome India Ltd.
  • All-Fill Inc.
  • Tokyo Automatic Machinery Works Ltd.
  • Robert Bosch GmbH
  • Omori Machinery Co. Ltd.
  • Webster Griffin Ltd.
  • Bossar Packaging S.A.
  • Fuji Machinery Co. Ltd.
  • Paglierani S.r.l.
  • RMGroup United kingdom Ltd. /li>
  • Viking Masek Global Packaging Technologies
  • Bossar Packaging India Pvt. Ltd.

Scope of Report

Attribute Details
Forecast Period 2023 to 2033
Historical Data Available for 2018 to 2022
Market Analysis US$ billion for Value
Key Countries Covered United States, Canada, Germany, United Kingdom, France, Italy, Spain, Russia, China, Japan, South Korea, India, Thailand, Malaysia, Indonesia, Australia, New Zealand, GCC Countries, Türkiye, Northern Africa, and South Africa
Key Segments Covered Product Type, Automation Type, Machine Type, Capacity, End Use, Region
Key Companies Profiled Barry-Wehmiller Companies; Premier Tech Chronos; I.M.A. Industria Macchine Automatiche S.p.A.; Nichrome India Ltd.; All-Fill Inc.; Tokyo Automatic Machinery Works Ltd.; Robert Bosch GmbH; Omori Machinery Co. Ltd.; Webster Griffin Ltd.; Bossar Packaging S.A.; Fuji Machinery Co. Ltd.; Paglierani S.r.l.; RMGroup United kingdom Ltd.; Viking Masek Global Packaging Technologies; Bossar Packaging India Pvt. Ltd.
Report Coverage Market Forecast, Company Share Analysis, Competition Intelligence, DROT Analysis, Market Dynamics and Challenges, and Strategic Growth Initiatives
Customization & Pricing Available upon Request

Bagging Equipment Market by Category

By Product Type:

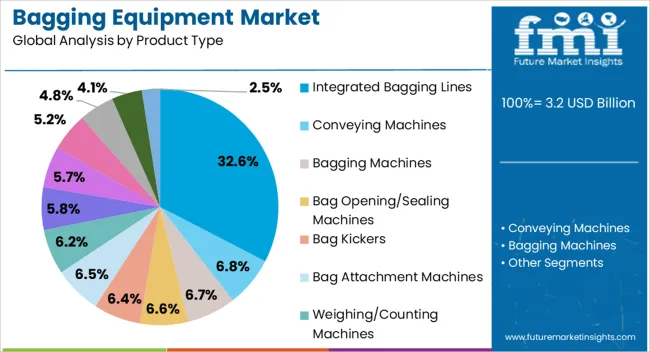
Integrated Bagging Lines:

  • Conveying Machines
    • Incline Transfer
    • Horizontal Transfer
  • Bagging Machines
  • Bag Opening/Sealing Machines
  • Bag Kickers
  • Bag Attachment Machines
  • Weighing/Counting Machines

Standalone Equipment:

  • Open Mouth Baggers
  • FFS Machine
    • Horizontal FFS
    • Vertical FFS
  • Valve Baggers
  • FIBC Bagging Machines
  • Others

By Automation Type:

  • Automatic
  • Semi-automatic

By Capacity:

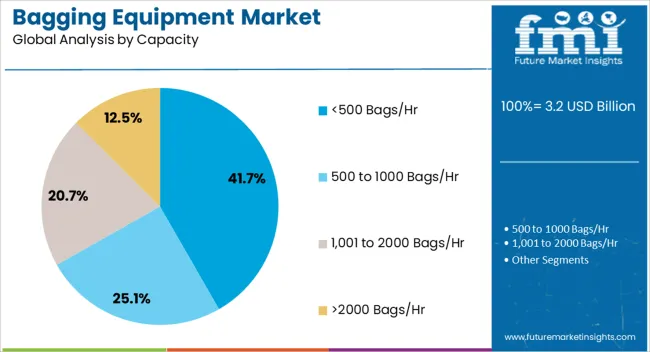
  • <500 Bags/Hr
  • 500 to 1000 Bags/Hr
  • 1,001 to 2000 Bags/Hr
  • >2000 Bags/Hr

By Machine Type:

  • Vertical Baggers
  • Horizontal Baggers

By End Use:

  • Food Industry
  • Construction
  • Pharmaceuticals
  • Others

By Region:

  • North America
  • Latin America
  • Europe
  • South Asia & Pacific
  • East Asia
  • The Middle East & Africa (MEA)

Frequently Asked Questions

How Big is the Bagging Equipment Market?

The market is valued at US$ 2.9 billion in 2023.

Who are the Key Bagging Equipment Market Players?

Bosch Packaging Technology and Nichrome India Ltd. are key market players.

Which are the Key Asian Countries in the market?

India, Japan, and China dominate the Asian market.

How Big Will the market by 2033?

The market is estimated to reach US$ 4.5 billion by 2033.

Which Region holds high Lucrativeness?

Asia-Pacific is projected to emerge as a lucrative market.

Table of Content
1. Executive Summary | Bagging Equipment Market

    1.1. Global Market Outlook

    1.2. Demand-side Trends

    1.3. Supply-side Trends

    1.4. Technology Roadmap Analysis

    1.5. Analysis and Recommendations

2. Market Overview

    2.1. Market Coverage / Taxonomy

    2.2. Market Definition / Scope / Limitations

3. Market Background

    3.1. Market Dynamics

        3.1.1. Drivers

        3.1.2. Restraints

        3.1.3. Opportunity

        3.1.4. Trends

    3.2. Scenario Forecast

        3.2.1. Demand in Optimistic Scenario

        3.2.2. Demand in Likely Scenario

        3.2.3. Demand in Conservative Scenario

    3.3. Opportunity Map Analysis

    3.4. Product Life Cycle Analysis

    3.5. Supply Chain Analysis

        3.5.1. Supply Side Participants and their Roles

            3.5.1.1. Producers

            3.5.1.2. Mid-Level Participants (Traders/ Agents/ Brokers)

            3.5.1.3. Wholesalers and Distributors

        3.5.2. Value Added and Value Created at Node in the Supply Chain

        3.5.3. List of Raw Material Suppliers

        3.5.4. List of Existing and Potential Buyer’s

    3.6. Investment Feasibility Matrix

    3.7. Value Chain Analysis

        3.7.1. Profit Margin Analysis

        3.7.2. Wholesalers and Distributors

        3.7.3. Retailers

    3.8. PESTLE and Porter’s Analysis

    3.9. Regulatory Landscape

        3.9.1. By Key Regions

        3.9.2. By Key Countries

    3.10. Regional Parent Market Outlook

    3.11. Production and Consumption Statistics

    3.12. Import and Export Statistics

4. Global Market Analysis 2018 to 2022 and Forecast, 2023 to 2033

    4.1. Historical Market Size Value (US$ Million) & Volume (Units) Analysis, 2018 to 2022

    4.2. Current and Future Market Size Value (US$ Million) & Volume (Units) Projections, 2023 to 2033

        4.2.1. Y-o-Y Growth Trend Analysis

        4.2.2. Absolute $ Opportunity Analysis

5. Global Market Analysis 2018 to 2022 and Forecast 2023 to 2033, By Product Type

    5.1. Introduction / Key Findings

    5.2. Historical Market Size Value (US$ Million) & Volume (Units) Analysis By Product Type, 2018 to 2022

    5.3. Current and Future Market Size Value (US$ Million) & Volume (Units) Analysis and Forecast By Product Type, 2023 to 2033

        5.3.1. Integrated Bagging Lines

            5.3.1.1. Conveying Machines

            5.3.1.2. Bagging Machines

            5.3.1.3. Bag Opening/Sealing Machines

            5.3.1.4. Bag Kickers

            5.3.1.5. Bag Attachment Machines

            5.3.1.6. Weighing/Counting Machines

        5.3.2. Standalone Equipment

            5.3.2.1. Open Mouth Baggers

            5.3.2.2. FFS Machines

            5.3.2.3. Valve Baggers

            5.3.2.4. FIBC Bagging Machines

    5.4. Y-o-Y Growth Trend Analysis By Product Type, 2018 to 2022

    5.5. Absolute $ Opportunity Analysis By Product Type, 2023 to 2033

6. Global Market Analysis 2018 to 2022 and Forecast 2023 to 2033, By Automation Type

    6.1. Introduction / Key Findings

    6.2. Historical Market Size Value (US$ Million) & Volume (Units) Analysis By Automation Type, 2018 to 2022

    6.3. Current and Future Market Size Value (US$ Million) & Volume (Units) Analysis and Forecast By Automation Type, 2023 to 2033

        6.3.1. Automatic

        6.3.2. Semi-automatic

    6.4. Y-o-Y Growth Trend Analysis By Automation Type, 2018 to 2022

    6.5. Absolute $ Opportunity Analysis By Automation Type, 2023 to 2033

7. Global Market Analysis 2018 to 2022 and Forecast 2023 to 2033, By Capacity

    7.1. Introduction / Key Findings

    7.2. Historical Market Size Value (US$ Million) & Volume (Units) Analysis By Capacity, 2018 to 2022

    7.3. Current and Future Market Size Value (US$ Million) & Volume (Units) Analysis and Forecast By Capacity, 2023 to 2033

        7.3.1. <500 Bags/Hr

        7.3.2. 500-1000 Bags/Hr

        7.3.3. 1001-2000 Bags/Hr

        7.3.4. >2000 Bags/Hr

    7.4. Y-o-Y Growth Trend Analysis By Capacity, 2018 to 2022

    7.5. Absolute $ Opportunity Analysis By Capacity, 2023 to 2033

8. Global Market Analysis 2018 to 2022 and Forecast 2023 to 2033, By Machine Type

    8.1. Introduction / Key Findings

    8.2. Historical Market Size Value (US$ Million) & Volume (Units) Analysis By Machine Type, 2018 to 2022

    8.3. Current and Future Market Size Value (US$ Million) & Volume (Units) Analysis and Forecast By Machine Type, 2023 to 2033

        8.3.1. Vertical Baggers

        8.3.2. Horizontal Baggers

    8.4. Y-o-Y Growth Trend Analysis By Machine Type, 2018 to 2022

    8.5. Absolute $ Opportunity Analysis By Machine Type, 2023 to 2033

9. Global Market Analysis 2018 to 2022 and Forecast 2023 to 2033, By End-use

    9.1. Introduction / Key Findings

    9.2. Historical Market Size Value (US$ Million) & Volume (Units) Analysis By End-use, 2018 to 2022

    9.3. Current and Future Market Size Value (US$ Million) & Volume (Units) Analysis and Forecast By End-use, 2023 to 2033

        9.3.1. Food Industry

        9.3.2. Construction

        9.3.3. Pharmaceuticals

        9.3.4. Personal Care & Cosmetics

        9.3.5. Others

    9.4. Y-o-Y Growth Trend Analysis By End-use, 2018 to 2022

    9.5. Absolute $ Opportunity Analysis By End-use, 2023 to 2033

10. Global Market Analysis 2018 to 2022 and Forecast 2023 to 2033, By Region

    10.1. Introduction

    10.2. Historical Market Size Value (US$ Million) & Volume (Units) Analysis By Region, 2018 to 2022

    10.3. Current Market Size Value (US$ Million) & Volume (Units) Analysis and Forecast By Region, 2023 to 2033

        10.3.1. North America

        10.3.2. Latin America

        10.3.3. Europe

        10.3.4. Asia Pacific

        10.3.5. MEA

    10.4. Market Attractiveness Analysis By Region

11. North America Market Analysis 2018 to 2022 and Forecast 2023 to 2033, By Country

    11.1. Historical Market Size Value (US$ Million) & Volume (Units) Trend Analysis By Market Taxonomy, 2018 to 2022

    11.2. Market Size Value (US$ Million) & Volume (Units) Forecast By Market Taxonomy, 2023 to 2033

        11.2.1. By Country

            11.2.1.1. USA

            11.2.1.2. Canada

        11.2.2. By Product Type

        11.2.3. By Automation Type

        11.2.4. By Capacity

        11.2.5. By Machine Type

        11.2.6. By End-use

    11.3. Market Attractiveness Analysis

        11.3.1. By Country

        11.3.2. By Product Type

        11.3.3. By Automation Type

        11.3.4. By Capacity

        11.3.5. By Machine Type

        11.3.6. By End-use

    11.4. Key Takeaways

12. Latin America Market Analysis 2018 to 2022 and Forecast 2023 to 2033, By Country

    12.1. Historical Market Size Value (US$ Million) & Volume (Units) Trend Analysis By Market Taxonomy, 2018 to 2022

    12.2. Market Size Value (US$ Million) & Volume (Units) Forecast By Market Taxonomy, 2023 to 2033

        12.2.1. By Country

            12.2.1.1. Brazil

            12.2.1.2. Mexico

            12.2.1.3. Rest of Latin America

        12.2.2. By Product Type

        12.2.3. By Automation Type

        12.2.4. By Capacity

        12.2.5. By Machine Type

        12.2.6. By End-use

    12.3. Market Attractiveness Analysis

        12.3.1. By Country

        12.3.2. By Product Type

        12.3.3. By Automation Type

        12.3.4. By Capacity

        12.3.5. By Machine Type

        12.3.6. By End-use

    12.4. Key Takeaways

13. Europe Market Analysis 2018 to 2022 and Forecast 2023 to 2033, By Country

    13.1. Historical Market Size Value (US$ Million) & Volume (Units) Trend Analysis By Market Taxonomy, 2018 to 2022

    13.2. Market Size Value (US$ Million) & Volume (Units) Forecast By Market Taxonomy, 2023 to 2033

        13.2.1. By Country

            13.2.1.1. Germany

            13.2.1.2. United kingdom

            13.2.1.3. France

            13.2.1.4. Spain

            13.2.1.5. Italy

            13.2.1.6. Rest of Europe

        13.2.2. By Product Type

        13.2.3. By Automation Type

        13.2.4. By Capacity

        13.2.5. By Machine Type

        13.2.6. By End-use

    13.3. Market Attractiveness Analysis

        13.3.1. By Country

        13.3.2. By Product Type

        13.3.3. By Automation Type

        13.3.4. By Capacity

        13.3.5. By Machine Type

        13.3.6. By End-use

    13.4. Key Takeaways

14. Asia Pacific Market Analysis 2018 to 2022 and Forecast 2023 to 2033, By Country

    14.1. Historical Market Size Value (US$ Million) & Volume (Units) Trend Analysis By Market Taxonomy, 2018 to 2022

    14.2. Market Size Value (US$ Million) & Volume (Units) Forecast By Market Taxonomy, 2023 to 2033

        14.2.1. By Country

            14.2.1.1. China

            14.2.1.2. Japan

            14.2.1.3. South Korea

            14.2.1.4. Singapore

            14.2.1.5. Thailand

            14.2.1.6. Indonesia

            14.2.1.7. Australia

            14.2.1.8. New Zealand

            14.2.1.9. Rest of Asia Pacific

        14.2.2. By Product Type

        14.2.3. By Automation Type

        14.2.4. By Capacity

        14.2.5. By Machine Type

        14.2.6. By End-use

    14.3. Market Attractiveness Analysis

        14.3.1. By Country

        14.3.2. By Product Type

        14.3.3. By Automation Type

        14.3.4. By Capacity

        14.3.5. By Machine Type

        14.3.6. By End-use

    14.4. Key Takeaways

15. MEA Market Analysis 2018 to 2022 and Forecast 2023 to 2033, By Country

    15.1. Historical Market Size Value (US$ Million) & Volume (Units) Trend Analysis By Market Taxonomy, 2018 to 2022

    15.2. Market Size Value (US$ Million) & Volume (Units) Forecast By Market Taxonomy, 2023 to 2033

        15.2.1. By Country

            15.2.1.1. GCC Countries

            15.2.1.2. South Africa

            15.2.1.3. Israel

            15.2.1.4. Rest of MEA

        15.2.2. By Product Type

        15.2.3. By Automation Type

        15.2.4. By Capacity

        15.2.5. By Machine Type

        15.2.6. By End-use

    15.3. Market Attractiveness Analysis

        15.3.1. By Country

        15.3.2. By Product Type

        15.3.3. By Automation Type

        15.3.4. By Capacity

        15.3.5. By Machine Type

        15.3.6. By End-use

    15.4. Key Takeaways

16. Key Countries Market Analysis

    16.1. USA

        16.1.1. Pricing Analysis

        16.1.2. Market Share Analysis, 2022

            16.1.2.1. By Product Type

            16.1.2.2. By Automation Type

            16.1.2.3. By Capacity

            16.1.2.4. By Machine Type

            16.1.2.5. By End-use

    16.2. Canada

        16.2.1. Pricing Analysis

        16.2.2. Market Share Analysis, 2022

            16.2.2.1. By Product Type

            16.2.2.2. By Automation Type

            16.2.2.3. By Capacity

            16.2.2.4. By Machine Type

            16.2.2.5. By End-use

    16.3. Brazil

        16.3.1. Pricing Analysis

        16.3.2. Market Share Analysis, 2022

            16.3.2.1. By Product Type

            16.3.2.2. By Automation Type

            16.3.2.3. By Capacity

            16.3.2.4. By Machine Type

            16.3.2.5. By End-use

    16.4. Mexico

        16.4.1. Pricing Analysis

        16.4.2. Market Share Analysis, 2022

            16.4.2.1. By Product Type

            16.4.2.2. By Automation Type

            16.4.2.3. By Capacity

            16.4.2.4. By Machine Type

            16.4.2.5. By End-use

    16.5. Germany

        16.5.1. Pricing Analysis

        16.5.2. Market Share Analysis, 2022

            16.5.2.1. By Product Type

            16.5.2.2. By Automation Type

            16.5.2.3. By Capacity

            16.5.2.4. By Machine Type

            16.5.2.5. By End-use

    16.6. United kingdom

        16.6.1. Pricing Analysis

        16.6.2. Market Share Analysis, 2022

            16.6.2.1. By Product Type

            16.6.2.2. By Automation Type

            16.6.2.3. By Capacity

            16.6.2.4. By Machine Type

            16.6.2.5. By End-use

    16.7. France

        16.7.1. Pricing Analysis

        16.7.2. Market Share Analysis, 2022

            16.7.2.1. By Product Type

            16.7.2.2. By Automation Type

            16.7.2.3. By Capacity

            16.7.2.4. By Machine Type

            16.7.2.5. By End-use

    16.8. Spain

        16.8.1. Pricing Analysis

        16.8.2. Market Share Analysis, 2022

            16.8.2.1. By Product Type

            16.8.2.2. By Automation Type

            16.8.2.3. By Capacity

            16.8.2.4. By Machine Type

            16.8.2.5. By End-use

    16.9. Italy

        16.9.1. Pricing Analysis

        16.9.2. Market Share Analysis, 2022

            16.9.2.1. By Product Type

            16.9.2.2. By Automation Type

            16.9.2.3. By Capacity

            16.9.2.4. By Machine Type

            16.9.2.5. By End-use

    16.10. China

        16.10.1. Pricing Analysis

        16.10.2. Market Share Analysis, 2022

            16.10.2.1. By Product Type

            16.10.2.2. By Automation Type

            16.10.2.3. By Capacity

            16.10.2.4. By Machine Type

            16.10.2.5. By End-use

    16.11. Japan

        16.11.1. Pricing Analysis

        16.11.2. Market Share Analysis, 2022

            16.11.2.1. By Product Type

            16.11.2.2. By Automation Type

            16.11.2.3. By Capacity

            16.11.2.4. By Machine Type

            16.11.2.5. By End-use

    16.12. South Korea

        16.12.1. Pricing Analysis

        16.12.2. Market Share Analysis, 2022

            16.12.2.1. By Product Type

            16.12.2.2. By Automation Type

            16.12.2.3. By Capacity

            16.12.2.4. By Machine Type

            16.12.2.5. By End-use

    16.13. Singapore

        16.13.1. Pricing Analysis

        16.13.2. Market Share Analysis, 2022

            16.13.2.1. By Product Type

            16.13.2.2. By Automation Type

            16.13.2.3. By Capacity

            16.13.2.4. By Machine Type

            16.13.2.5. By End-use

    16.14. Thailand

        16.14.1. Pricing Analysis

        16.14.2. Market Share Analysis, 2022

            16.14.2.1. By Product Type

            16.14.2.2. By Automation Type

            16.14.2.3. By Capacity

            16.14.2.4. By Machine Type

            16.14.2.5. By End-use

    16.15. Indonesia

        16.15.1. Pricing Analysis

        16.15.2. Market Share Analysis, 2022

            16.15.2.1. By Product Type

            16.15.2.2. By Automation Type

            16.15.2.3. By Capacity

            16.15.2.4. By Machine Type

            16.15.2.5. By End-use

    16.16. Australia

        16.16.1. Pricing Analysis

        16.16.2. Market Share Analysis, 2022

            16.16.2.1. By Product Type

            16.16.2.2. By Automation Type

            16.16.2.3. By Capacity

            16.16.2.4. By Machine Type

            16.16.2.5. By End-use

    16.17. New Zealand

        16.17.1. Pricing Analysis

        16.17.2. Market Share Analysis, 2022

            16.17.2.1. By Product Type

            16.17.2.2. By Automation Type

            16.17.2.3. By Capacity

            16.17.2.4. By Machine Type

            16.17.2.5. By End-use

    16.18. GCC Countries

        16.18.1. Pricing Analysis

        16.18.2. Market Share Analysis, 2022

            16.18.2.1. By Product Type

            16.18.2.2. By Automation Type

            16.18.2.3. By Capacity

            16.18.2.4. By Machine Type

            16.18.2.5. By End-use

    16.19. South Africa

        16.19.1. Pricing Analysis

        16.19.2. Market Share Analysis, 2022

            16.19.2.1. By Product Type

            16.19.2.2. By Automation Type

            16.19.2.3. By Capacity

            16.19.2.4. By Machine Type

            16.19.2.5. By End-use

    16.20. Israel

        16.20.1. Pricing Analysis

        16.20.2. Market Share Analysis, 2022

            16.20.2.1. By Product Type

            16.20.2.2. By Automation Type

            16.20.2.3. By Capacity

            16.20.2.4. By Machine Type

            16.20.2.5. By End-use

17. Market Structure Analysis

    17.1. Competition Dashboard

    17.2. Competition Benchmarking

    17.3. Market Share Analysis of Top Players

        17.3.1. By Regional

        17.3.2. By Product Type

        17.3.3. By Automation Type

        17.3.4. By Capacity

        17.3.5. By Machine Type

        17.3.6. By End-use

18. Competition Analysis

    18.1. Competition Deep Dive

        18.1.1. Robert Bosch GmbH

            18.1.1.1. Overview

            18.1.1.2. Product Portfolio

            18.1.1.3. Profitability by Market Segments

            18.1.1.4. Sales Footprint

            18.1.1.5. Strategy Overview

                18.1.1.5.1. Marketing Strategy

                18.1.1.5.2. Product Strategy

                18.1.1.5.3. Channel Strategy

        18.1.2. All-Fill Incorporated

            18.1.2.1. Overview

            18.1.2.2. Product Portfolio

            18.1.2.3. Profitability by Market Segments

            18.1.2.4. Sales Footprint

            18.1.2.5. Strategy Overview

                18.1.2.5.1. Marketing Strategy

                18.1.2.5.2. Product Strategy

                18.1.2.5.3. Channel Strategy

        18.1.3. Tokyo Automatic Machinery Works Ltd.

            18.1.3.1. Overview

            18.1.3.2. Product Portfolio

            18.1.3.3. Profitability by Market Segments

            18.1.3.4. Sales Footprint

            18.1.3.5. Strategy Overview

                18.1.3.5.1. Marketing Strategy

                18.1.3.5.2. Product Strategy

                18.1.3.5.3. Channel Strategy

        18.1.4. I.M.A.

            18.1.4.1. Overview

            18.1.4.2. Product Portfolio

            18.1.4.3. Profitability by Market Segments

            18.1.4.4. Sales Footprint

            18.1.4.5. Strategy Overview

                18.1.4.5.1. Marketing Strategy

                18.1.4.5.2. Product Strategy

                18.1.4.5.3. Channel Strategy

        18.1.5. PAYPER S.A.

            18.1.5.1. Overview

            18.1.5.2. Product Portfolio

            18.1.5.3. Profitability by Market Segments

            18.1.5.4. Sales Footprint

            18.1.5.5. Strategy Overview

                18.1.5.5.1. Marketing Strategy

                18.1.5.5.2. Product Strategy

                18.1.5.5.3. Channel Strategy

        18.1.6. Bossar Packaging S.A.

            18.1.6.1. Overview

            18.1.6.2. Product Portfolio

            18.1.6.3. Profitability by Market Segments

            18.1.6.4. Sales Footprint

            18.1.6.5. Strategy Overview

                18.1.6.5.1. Marketing Strategy

                18.1.6.5.2. Product Strategy

                18.1.6.5.3. Channel Strategy

        18.1.7. CONCETTI S.p.A.

            18.1.7.1. Overview

            18.1.7.2. Product Portfolio

            18.1.7.3. Profitability by Market Segments

            18.1.7.4. Sales Footprint

            18.1.7.5. Strategy Overview

                18.1.7.5.1. Marketing Strategy

                18.1.7.5.2. Product Strategy

                18.1.7.5.3. Channel Strategy

        18.1.8. Omori Machinery Co. Ltd.

            18.1.8.1. Overview

            18.1.8.2. Product Portfolio

            18.1.8.3. Profitability by Market Segments

            18.1.8.4. Sales Footprint

            18.1.8.5. Strategy Overview

                18.1.8.5.1. Marketing Strategy

                18.1.8.5.2. Product Strategy

                18.1.8.5.3. Channel Strategy

        18.1.9. Fres-co System USA Inc.

            18.1.9.1. Overview

            18.1.9.2. Product Portfolio

            18.1.9.3. Profitability by Market Segments

            18.1.9.4. Sales Footprint

            18.1.9.5. Strategy Overview

                18.1.9.5.1. Marketing Strategy

                18.1.9.5.2. Product Strategy

                18.1.9.5.3. Channel Strategy

        18.1.10. WOLF Verpackungsmaschinen GmbH

            18.1.10.1. Overview

            18.1.10.2. Product Portfolio

            18.1.10.3. Profitability by Market Segments

            18.1.10.4. Sales Footprint

            18.1.10.5. Strategy Overview

                18.1.10.5.1. Marketing Strategy

                18.1.10.5.2. Product Strategy

                18.1.10.5.3. Channel Strategy

        18.1.11. Fuji Machinery Co. Ltd.

            18.1.11.1. Overview

            18.1.11.2. Product Portfolio

            18.1.11.3. Profitability by Market Segments

            18.1.11.4. Sales Footprint

            18.1.11.5. Strategy Overview

                18.1.11.5.1. Marketing Strategy

                18.1.11.5.2. Product Strategy

                18.1.11.5.3. Channel Strategy

        18.1.12. Webster Griffin Ltd.

            18.1.12.1. Overview

            18.1.12.2. Product Portfolio

            18.1.12.3. Profitability by Market Segments

            18.1.12.4. Sales Footprint

            18.1.12.5. Strategy Overview

                18.1.12.5.1. Marketing Strategy

                18.1.12.5.2. Product Strategy

                18.1.12.5.3. Channel Strategy

        18.1.13. BW Companies Inc.

            18.1.13.1. Overview

            18.1.13.2. Product Portfolio

            18.1.13.3. Profitability by Market Segments

            18.1.13.4. Sales Footprint

            18.1.13.5. Strategy Overview

                18.1.13.5.1. Marketing Strategy

                18.1.13.5.2. Product Strategy

                18.1.13.5.3. Channel Strategy

        18.1.14. Buhler Holding AG

            18.1.14.1. Overview

            18.1.14.2. Product Portfolio

            18.1.14.3. Profitability by Market Segments

            18.1.14.4. Sales Footprint

            18.1.14.5. Strategy Overview

                18.1.14.5.1. Marketing Strategy

                18.1.14.5.2. Product Strategy

                18.1.14.5.3. Channel Strategy

        18.1.15. Imanpack Packaging and Eco Solutions S.p.A.

            18.1.15.1. Overview

            18.1.15.2. Product Portfolio

            18.1.15.3. Profitability by Market Segments

            18.1.15.4. Sales Footprint

            18.1.15.5. Strategy Overview

                18.1.15.5.1. Marketing Strategy

                18.1.15.5.2. Product Strategy

                18.1.15.5.3. Channel Strategy

19. Assumptions & Acronyms Used

20. Research Methodology
Recommendations

Packaging

Bagging Machine Market

September 2024

REP-GB-5584

Upcoming

Packaging

Biodegradable Packaging Market

September 2024

REP-GB-323

Upcoming

Explore Packaging Insights

View Reports