Garage Equipment Market Size and Share Forecast Outlook From 2024 to 2034

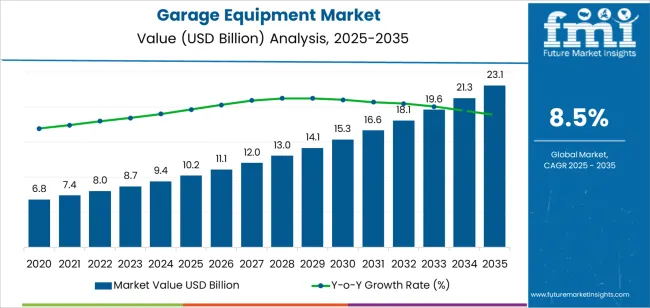
The Garage Equipment Market is projected to be valued at USD 9.4 billion in 2024 and is expected to rise to USD 21.2 billion by 2034. It is expected to grow at a CAGR of 8.5% during the forecast period. The market is growing globally due to increasing vehicle sales, technological advancements, and rising automotive maintenance and repair services.

Attributes Key Statistics
Garage Equipment Market Value (2024 USD 9.4 billion
Anticipated Market Value (2034) USD 21.2 billion
Estimated Growth (2024 to 2034) 8.5 % CAGR

Factors Driving the Demand for Garage Equipment

  • The increase in vehicle ownership drives the demand for garage equipment, particularly maintenance and repair services.
  • Technological advancements are playing a significant role in the growth of the garage equipment market.
  • Manufacturers continuously innovate to develop advanced equipment with enhanced features, automation, and connectivity capabilities. These innovations improve garage operations' efficiency, accuracy, and productivity, attracting customers seeking modern solutions.
  • Integrating digital technologies such as IoT (Internet of Things) and AI (Artificial Intelligence) into garage equipment enables remote monitoring, predictive maintenance, and data-driven decision-making.
  • Increasing consumer awareness and focus on vehicle maintenance and safety are also driving the growth of the market.
  • Consumers recognize the importance of regular maintenance to ensure the longevity and performance of their vehicles. Stricter regulations and standards regarding vehicle safety and emissions further emphasize the need for quality garage equipment to comply with regulatory requirements.
  • The expansion of the automotive aftermarket industry also provides significant opportunities for garage equipment manufacturers and service providers.
  • The rise of electric vehicles (EVs) and hybrid vehicles presents new opportunities for garage equipment manufacturers to develop specialized tools and equipment tailored to these alternative propulsion systems' unique needs.

Consumption Patterns Influencing the Garage Equipment Market

  • The garage equipment market is witnessing a surge in demand due to the increasing vehicle ownership and the subsequent need for maintenance and repair services.
  • Consumers' growing preference for professional garage services equipped with modern equipment drives sales of advanced garage equipment such as vehicle lifts, diagnostic tools, and tire changers.
  • Technological advancements further fuel the adoption of garage equipment, with garages and automotive service centers embracing automation, connectivity, and digitalization to enhance productivity and customer satisfaction.
  • The popularity of advanced equipment is on the rise as consumers become more aware of the importance of regular vehicle maintenance and safety.
  • Regulatory mandates and industry standards related to vehicle safety, emissions, and maintenance drive the adoption and sales of specialized garage equipment.
  • Garage equipment's versatility and applicability across various automotive sectors, including passenger vehicles, commercial fleets, and specialty vehicles, drive adoption across multiple industries.

Factors Restraining the Demand for Garage Equipment

  • The market is anticipated to surpass a valuation of USD 21.2 billion by 2034, expanding at an 8.5% CAGR. While the market is experiencing growth, several restraining factors can adversely affect its development and expansion.
  • Economic uncertainties and fluctuations can decrease consumer spending on vehicle maintenance and repair services, leading to reduced demand for garage equipment and a slowdown in sales for manufacturers and service providers.
  • The high cost of advanced garage equipment is a significant barrier to adoption, especially for small-scale automotive service providers and independent garages, limiting market growth.
  • The lack of skilled technicians and trained personnel proficient in operating complex garage equipment presents challenges for industry players, hindering the effective utilization of equipment and impeding market expansion.
  • Regulatory complexities and compliance requirements increase operational costs and administrative burdens for businesses, and non-compliance can result in fines, penalties, and reputational damage, further dampening market growth.
  • Competition from alternative service providers, such as DIY automotive repair shops and online platforms that offer aftermarket parts and tools, negatively affects traditional garage equipment businesses. This impacts equipment sales and service revenues.

Garage Equipment Industry Analysis by Top Investment Segments

OEM-authorized Garages endorsed by Original Equipment Manufacturers

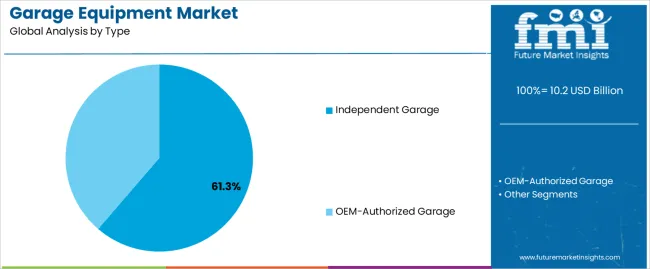
Based on the garage type, the OEM-authorized garage segment dominates the market and is expected to grow at an 8.3% CAGR through 2034. The segment’s rising popularity is attributed to the following reasons:

  • OEMs are perceived to have specialized expertise and access to genuine parts, which ensures high maintenance and repair standards. Thus, customers can trust the quality of service and equipment.
  • Endorsement enhances the credibility and reputation of authorized garages, attracting a loyal customer base seeking reliable and efficient service.
  • Manufacturers provide comprehensive training and support to authorized garages, enabling them to utilize advanced garage equipment and diagnostic tools effectively.
  • Access to technical resources, software updates, and service bulletins provide authorized garages to stay up-to-date with evolving vehicle technologies and industry standards.
Attributes Details
Top Garage Type OEM-authorized Garage
CAGR (2024 to 2034) 8.3%

Demand for High-quality Collision Repair Services to Remain High

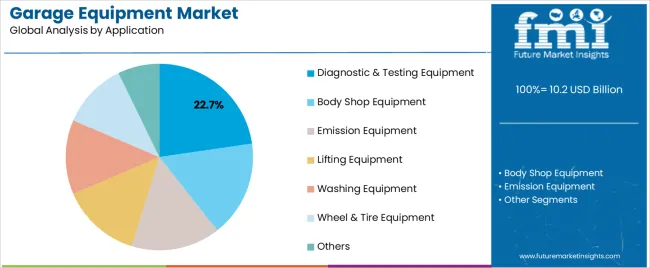
Based on the application type, the body shop equipment segment dominates the garage equipment market. The segment is expected to grow at an 8.1% CAGR through 2034. This rising popularity is attributed to the following reasons:

  • With the increasing frequency of vehicle accidents and rising ownership rates, the demand for professional repair services continues to grow.
  • Modern vehicles with advanced safety features and materials necessitate specialized equipment and expertise for accurate and effective repairs.
  • Body shop equipment enables technicians to address structural damage, perform precision painting, and restore vehicle aesthetics, ensuring optimal safety and functionality.
Attributes Details
Top Application Body Shop Equipment
CAGR (2024 to 2034) 8.1%

Analysis of Top Countries, Manufacturing and Using Garage Equipment

The section analyzes the garage equipment market by country, including the United States, the United Kingdom, China, Japan, and South Korea. The table presents the CAGR for each country, indicating the expected market growth through 2034.

Countries CAGR (2024 to 2034)
United States 8.8%
United Kingdom 9.7%
China 8.9%
Japan 10.1%
South Korea 9.8%

The United States Thriving Automotive Aftermarket Industry Drives Market Demand

The United States dominates the garage equipment market in the North American region. It is expected to exhibit a CAGR of 8.8% until 2034.

  • With many vehicles on the road and a strong network of independent garages and service centers, the country's automotive repair and maintenance sector benefits from high consumer spending on vehicle services.
  • The adoption of innovative garage equipment solutions also contributes to market growth, as the United States is home to many garage equipment manufacturers and technological innovators.

The United Kingdom's Safety, Emissions, and Roadworthiness

The United Kingdom is the leading European country in the garage equipment market, and the market is predicted to register an annual growth rate of 9.7% through 2034.

  • The government's focus on environmental sustainability and vehicle safety encourages automotive service providers to invest in modern diagnostic tools, vehicle lifts, and emissions testing equipment.
  • Technicians must also undergo professional certification and training programs to ensure proficiency in operating advanced garage equipment, further boosting market growth.

China's Increasing Vehicle Ownership and Demand for Automotive Repair and Maintenance Services

China is another Asian country leading in the global garage equipment market. The Chinese market is anticipated to register a CAGR of 8.9% through 2034.

  • China's expanding automotive aftermarket industry presents significant opportunities for garage equipment manufacturers and service providers.
  • The adoption of digital technologies in garage operations also enhances efficiency and productivity, further boosting market growth.

Japan's Reputation for Quality, Precision, and Innovation in Automotive Manufacturing

Japan is the leading Asian country in the global garage equipment market, and its demand is anticipated to register a CAGR of 10.1% through 2034.

  • Japanese automotive service providers prioritize advanced garage equipment solutions to meet the stringent requirements of modern vehicles.
  • The need for specialized equipment for hybrid and electric vehicles also contributes to market growth, with Japanese manufacturers leading in technological innovation and product development.

South Korea's Focus on Quality and Efficiency in its Automotive Industry

South Korea is another Asian country in the global garage equipment market, and its demand is anticipated to register a CAGR of 9.8% through 2034.

  • Strong government support for technological innovation and environmental sustainability drives the adoption of advanced garage equipment solutions.
  • South Korean manufacturers excel in producing high-quality garage equipment tailored to the needs of modern vehicles, enhancing the country's influence in the global market.

Leading Suppliers of Garage Equipment

Key market players are investing heavily in research and development to create advanced and innovative garage equipment solutions that cater to the changing needs of automotive service providers and vehicle owners.

Companies are increasingly using digitalization, automation, and connectivity to enhance garage equipment's accuracy, reliability, and efficiency, improving overall productivity and customer satisfaction.

Major players are expanding their global presence by forming strategic partnerships, collaborations, and acquisitions to access new markets and strengthen their presence in key regions. In addition, they are actively promoting and marketing their modern garage equipment solutions to create awareness among automotive service providers and end users

Recent Developments

  • On July 28, 2022, ATS Elgi, a wholly-owned subsidiary of Elgi Equipments, announced its manufacturing agreement with VTEQ, a global leader in vehicle testing equipment based out of Spain. The collaboration aimed to produce advanced vehicle testing equipment, leveraging the expertise of both companies.
  • On January 8, 2024, GSF Car Parts awarded over a thousand customers a bumper Christmas during its All Wrapped Up promotion. Staffordshire garage VW Services emerged as the grand prize winner, securing the £5,000 reward.
  • On May 21, 2020, B.K. Hardin launched DIY Garage in South Knox, inspired by his quest for a car lift.

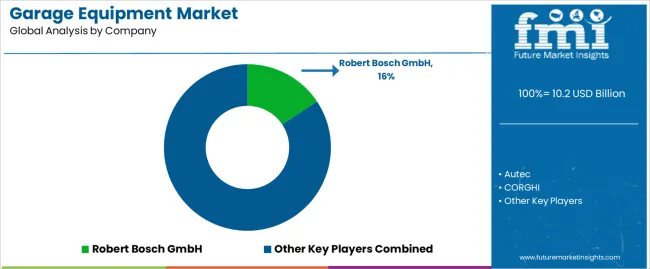
Key Players and Market Concentration in the Garage Equipment Industry

  • Autec
  • CORGHI
  • Integrated Garage Equipment
  • Hennesy Industries
  • Automotive Equipment International
  • Arex Test Systems B.V., Boston Garage Equipment Ltd
  • Robert Bosch GmbH
  • Continental AG
  • Aro Equipments Pvt. Ltd.
  • LKQ Coatings Ltd.
  • Istobal S.A.
  • Con Air Equipments Private Limited
  • Vehicle Service Group
  • Gray Manufacturing Company Inc
  • Symach SRL
  • Standard Tools and Equipment Co.
  • VisiCon Automatisierungstechnik GmbH
  • MAHA Mechanical Engineering Haldenwang GmbH & Co. KG
  • Snap-on Incorporated
  • Samvit Garage Equipment
  • Sarveshwari Technologies Limited (SARV)
  • Oil Lube Systems Pvt Ltd.
  • Guangzhou Jingjia Auto Equipment Co.

Top Segments Studied in the Garage Equipment Market

By Garage Type:

  • OEM-authorized garage
  • Independent garage

By Application:

  • Body Shop Equipment
  • Diagnostic & Testing Equipment
  • Emission Equipment
  • Lifting Equipment
  • Washing Equipment
  • Wheel & Tire Equipment
  • Others

By Installation Type:

  • Mobile
  • Fixed

By Function Type:

  • Electronic
  • Mechanical

By Vehicle Type:

  • Commercial vehicle
  • Passenger vehicle

By Region:

  • Asia Pacific
  • Europe
  • North America
  • Middle East & Africa
  • Latin America

Table of Content

  • 1. Executive Summary
  • 2. Market Overview
  • 3. Market Background
  • 4. Global Market Analysis 2019 to 2023 and Forecast, 2024 to 2034
  • 5. Global Market Analysis 2019 to 2023 and Forecast 2024 to 2034, By Garage type
    • 5.1. OEM authorized garage
    • 5.2. Independent garage
  • 6. Global Market Analysis 2019 to 2023 and Forecast 2024 to 2034, By Application
    • 6.1. Body Shop Equipment
    • 6.2. Diagnostic & Testing Equipment
    • 6.3. Emission Equipment
    • 6.4. Lifting Equipment
    • 6.5. Washing Equipment
    • 6.6. Wheel & Tire Equipment
    • 6.7. Others
  • 7. Global Market Analysis 2019 to 2023 and Forecast 2024 to 2034, By Installation type
    • 7.1. Mobile
    • 7.2. Fixed
  • 8. Global Market Analysis 2019 to 2023 and Forecast 2024 to 2034, By Function type
    • 8.1. Electronic
    • 8.2. Mechanical
  • 9. Global Market Analysis 2019 to 2023 and Forecast 2024 to 2034, By Vehicle Type
    • 9.1. Commercial vehicle
    • 9.2. Passenger vehicle
  • 10. Global Market Analysis 2019 to 2023 and Forecast 2024 to 2034, By Region
    • 10.1. North America
    • 10.2. Latin America
    • 10.3. Europe
    • 10.4. East Asia
    • 10.5. South Asia
    • 10.6. Oceania
    • 10.7. MEA
  • 11. North America Market Analysis 2019 to 2023 and Forecast 2024 to 2034, By Country
  • 12. Latin America Market Analysis 2019 to 2023 and Forecast 2024 to 2034, By Country
  • 13. Europe Market Analysis 2019 to 2023 and Forecast 2024 to 2034, By Country
  • 14. East Asia Market Analysis 2019 to 2023 and Forecast 2024 to 2034, By Country
  • 15. South Asia Market Analysis 2019 to 2023 and Forecast 2024 to 2034, By Country
  • 16. Oceania Market Analysis 2019 to 2023 and Forecast 2024 to 2034, By Country
  • 17. MEA Market Analysis 2019 to 2023 and Forecast 2024 to 2034, By Country
  • 18. Key Countries Market Analysis
  • 19. Market Structure Analysis
  • 20. Competition Analysis
    • 20.1. Autec
    • 20.2. CORGHI
    • 20.3. Hennesy Industries
    • 20.4. Automotive Equipment International
    • 20.5. Manatec Electronics Private Limited
    • 20.6. LINCOLN ELECTRIC HOLDINGS
    • 20.7. Ravaglioli
    • 20.8. HIGHVELD GARAGE EQUIPMENT
    • 20.9. CEMB USA
    • 20.10. Hunter Engineering Company
  • 21. Assumptions & Acronyms Used
  • 22. Research Methodology

List of Tables

Table 1: Global Market Value (US$ Million) Forecast by Region, 2019 to 2034

Table 2: Global Market Volume (Units) Forecast by Region, 2019 to 2034

Table 3: Global Market Value (US$ Million) Forecast by Garage type, 2019 to 2034

Table 4: Global Market Volume (Units) Forecast by Garage type, 2019 to 2034

Table 5: Global Market Value (US$ Million) Forecast by Application, 2019 to 2034

Table 6: Global Market Volume (Units) Forecast by Application, 2019 to 2034

Table 7: Global Market Value (US$ Million) Forecast by Installation type, 2019 to 2034

Table 8: Global Market Volume (Units) Forecast by Installation type, 2019 to 2034

Table 9: Global Market Value (US$ Million) Forecast by Function type, 2019 to 2034

Table 10: Global Market Volume (Units) Forecast by Function type, 2019 to 2034

Table 11: Global Market Value (US$ Million) Forecast by Vehicle Type, 2019 to 2034

Table 12: Global Market Volume (Units) Forecast by Vehicle Type, 2019 to 2034

Table 13: North America Market Value (US$ Million) Forecast by Country, 2019 to 2034

Table 14: North America Market Volume (Units) Forecast by Country, 2019 to 2034

Table 15: North America Market Value (US$ Million) Forecast by Garage type, 2019 to 2034

Table 16: North America Market Volume (Units) Forecast by Garage type, 2019 to 2034

Table 17: North America Market Value (US$ Million) Forecast by Application, 2019 to 2034

Table 18: North America Market Volume (Units) Forecast by Application, 2019 to 2034

Table 19: North America Market Value (US$ Million) Forecast by Installation type, 2019 to 2034

Table 20: North America Market Volume (Units) Forecast by Installation type, 2019 to 2034

Table 21: North America Market Value (US$ Million) Forecast by Function type, 2019 to 2034

Table 22: North America Market Volume (Units) Forecast by Function type, 2019 to 2034

Table 23: North America Market Value (US$ Million) Forecast by Vehicle Type, 2019 to 2034

Table 24: North America Market Volume (Units) Forecast by Vehicle Type, 2019 to 2034

Table 25: Latin America Market Value (US$ Million) Forecast by Country, 2019 to 2034

Table 26: Latin America Market Volume (Units) Forecast by Country, 2019 to 2034

Table 27: Latin America Market Value (US$ Million) Forecast by Garage type, 2019 to 2034

Table 28: Latin America Market Volume (Units) Forecast by Garage type, 2019 to 2034

Table 29: Latin America Market Value (US$ Million) Forecast by Application, 2019 to 2034

Table 30: Latin America Market Volume (Units) Forecast by Application, 2019 to 2034

Table 31: Latin America Market Value (US$ Million) Forecast by Installation type, 2019 to 2034

Table 32: Latin America Market Volume (Units) Forecast by Installation type, 2019 to 2034

Table 33: Latin America Market Value (US$ Million) Forecast by Function type, 2019 to 2034

Table 34: Latin America Market Volume (Units) Forecast by Function type, 2019 to 2034

Table 35: Latin America Market Value (US$ Million) Forecast by Vehicle Type, 2019 to 2034

Table 36: Latin America Market Volume (Units) Forecast by Vehicle Type, 2019 to 2034

Table 37: Europe Market Value (US$ Million) Forecast by Country, 2019 to 2034

Table 38: Europe Market Volume (Units) Forecast by Country, 2019 to 2034

Table 39: Europe Market Value (US$ Million) Forecast by Garage type, 2019 to 2034

Table 40: Europe Market Volume (Units) Forecast by Garage type, 2019 to 2034

Table 41: Europe Market Value (US$ Million) Forecast by Application, 2019 to 2034

Table 42: Europe Market Volume (Units) Forecast by Application, 2019 to 2034

Table 43: Europe Market Value (US$ Million) Forecast by Installation type, 2019 to 2034

Table 44: Europe Market Volume (Units) Forecast by Installation type, 2019 to 2034

Table 45: Europe Market Value (US$ Million) Forecast by Function type, 2019 to 2034

Table 46: Europe Market Volume (Units) Forecast by Function type, 2019 to 2034

Table 47: Europe Market Value (US$ Million) Forecast by Vehicle Type, 2019 to 2034

Table 48: Europe Market Volume (Units) Forecast by Vehicle Type, 2019 to 2034

Table 49: East Asia Market Value (US$ Million) Forecast by Country, 2019 to 2034

Table 50: East Asia Market Volume (Units) Forecast by Country, 2019 to 2034

Table 51: East Asia Market Value (US$ Million) Forecast by Garage type, 2019 to 2034

Table 52: East Asia Market Volume (Units) Forecast by Garage type, 2019 to 2034

Table 53: East Asia Market Value (US$ Million) Forecast by Application, 2019 to 2034

Table 54: East Asia Market Volume (Units) Forecast by Application, 2019 to 2034

Table 55: East Asia Market Value (US$ Million) Forecast by Installation type, 2019 to 2034

Table 56: East Asia Market Volume (Units) Forecast by Installation type, 2019 to 2034

Table 57: East Asia Market Value (US$ Million) Forecast by Function type, 2019 to 2034

Table 58: East Asia Market Volume (Units) Forecast by Function type, 2019 to 2034

Table 59: East Asia Market Value (US$ Million) Forecast by Vehicle Type, 2019 to 2034

Table 60: East Asia Market Volume (Units) Forecast by Vehicle Type, 2019 to 2034

Table 61: South Asia Market Value (US$ Million) Forecast by Country, 2019 to 2034

Table 62: South Asia Market Volume (Units) Forecast by Country, 2019 to 2034

Table 63: South Asia Market Value (US$ Million) Forecast by Garage type, 2019 to 2034

Table 64: South Asia Market Volume (Units) Forecast by Garage type, 2019 to 2034

Table 65: South Asia Market Value (US$ Million) Forecast by Application, 2019 to 2034

Table 66: South Asia Market Volume (Units) Forecast by Application, 2019 to 2034

Table 67: South Asia Market Value (US$ Million) Forecast by Installation type, 2019 to 2034

Table 68: South Asia Market Volume (Units) Forecast by Installation type, 2019 to 2034

Table 69: South Asia Market Value (US$ Million) Forecast by Function type, 2019 to 2034

Table 70: South Asia Market Volume (Units) Forecast by Function type, 2019 to 2034

Table 71: South Asia Market Value (US$ Million) Forecast by Vehicle Type, 2019 to 2034

Table 72: South Asia Market Volume (Units) Forecast by Vehicle Type, 2019 to 2034

Table 73: Oceania Market Value (US$ Million) Forecast by Country, 2019 to 2034

Table 74: Oceania Market Volume (Units) Forecast by Country, 2019 to 2034

Table 75: Oceania Market Value (US$ Million) Forecast by Garage type, 2019 to 2034

Table 76: Oceania Market Volume (Units) Forecast by Garage type, 2019 to 2034

Table 77: Oceania Market Value (US$ Million) Forecast by Application, 2019 to 2034

Table 78: Oceania Market Volume (Units) Forecast by Application, 2019 to 2034

Table 79: Oceania Market Value (US$ Million) Forecast by Installation type, 2019 to 2034

Table 80: Oceania Market Volume (Units) Forecast by Installation type, 2019 to 2034

Table 81: Oceania Market Value (US$ Million) Forecast by Function type, 2019 to 2034

Table 82: Oceania Market Volume (Units) Forecast by Function type, 2019 to 2034

Table 83: Oceania Market Value (US$ Million) Forecast by Vehicle Type, 2019 to 2034

Table 84: Oceania Market Volume (Units) Forecast by Vehicle Type, 2019 to 2034

Table 85: MEA Market Value (US$ Million) Forecast by Country, 2019 to 2034

Table 86: MEA Market Volume (Units) Forecast by Country, 2019 to 2034

Table 87: MEA Market Value (US$ Million) Forecast by Garage type, 2019 to 2034

Table 88: MEA Market Volume (Units) Forecast by Garage type, 2019 to 2034

Table 89: MEA Market Value (US$ Million) Forecast by Application, 2019 to 2034

Table 90: MEA Market Volume (Units) Forecast by Application, 2019 to 2034

Table 91: MEA Market Value (US$ Million) Forecast by Installation type, 2019 to 2034

Table 92: MEA Market Volume (Units) Forecast by Installation type, 2019 to 2034

Table 93: MEA Market Value (US$ Million) Forecast by Function type, 2019 to 2034

Table 94: MEA Market Volume (Units) Forecast by Function type, 2019 to 2034

Table 95: MEA Market Value (US$ Million) Forecast by Vehicle Type, 2019 to 2034

Table 96: MEA Market Volume (Units) Forecast by Vehicle Type, 2019 to 2034

List of Figures

Figure 1: Global Market Value (US$ Million) by Garage type, 2024 to 2034

Figure 2: Global Market Value (US$ Million) by Application, 2024 to 2034

Figure 3: Global Market Value (US$ Million) by Installation type, 2024 to 2034

Figure 4: Global Market Value (US$ Million) by Function type, 2024 to 2034

Figure 5: Global Market Value (US$ Million) by Vehicle Type, 2024 to 2034

Figure 6: Global Market Value (US$ Million) by Region, 2024 to 2034

Figure 7: Global Market Value (US$ Million) Analysis by Region, 2019 to 2034

Figure 8: Global Market Volume (Units) Analysis by Region, 2019 to 2034

Figure 9: Global Market Value Share (%) and BPS Analysis by Region, 2024 to 2034

Figure 10: Global Market Y-o-Y Growth (%) Projections by Region, 2024 to 2034

Figure 11: Global Market Value (US$ Million) Analysis by Garage type, 2019 to 2034

Figure 12: Global Market Volume (Units) Analysis by Garage type, 2019 to 2034

Figure 13: Global Market Value Share (%) and BPS Analysis by Garage type, 2024 to 2034

Figure 14: Global Market Y-o-Y Growth (%) Projections by Garage type, 2024 to 2034

Figure 15: Global Market Value (US$ Million) Analysis by Application, 2019 to 2034

Figure 16: Global Market Volume (Units) Analysis by Application, 2019 to 2034

Figure 17: Global Market Value Share (%) and BPS Analysis by Application, 2024 to 2034

Figure 18: Global Market Y-o-Y Growth (%) Projections by Application, 2024 to 2034

Figure 19: Global Market Value (US$ Million) Analysis by Installation type, 2019 to 2034

Figure 20: Global Market Volume (Units) Analysis by Installation type, 2019 to 2034

Figure 21: Global Market Value Share (%) and BPS Analysis by Installation type, 2024 to 2034

Figure 22: Global Market Y-o-Y Growth (%) Projections by Installation type, 2024 to 2034

Figure 23: Global Market Value (US$ Million) Analysis by Function type, 2019 to 2034

Figure 24: Global Market Volume (Units) Analysis by Function type, 2019 to 2034

Figure 25: Global Market Value Share (%) and BPS Analysis by Function type, 2024 to 2034

Figure 26: Global Market Y-o-Y Growth (%) Projections by Function type, 2024 to 2034

Figure 27: Global Market Value (US$ Million) Analysis by Vehicle Type, 2019 to 2034

Figure 28: Global Market Volume (Units) Analysis by Vehicle Type, 2019 to 2034

Figure 29: Global Market Value Share (%) and BPS Analysis by Vehicle Type, 2024 to 2034

Figure 30: Global Market Y-o-Y Growth (%) Projections by Vehicle Type, 2024 to 2034

Figure 31: Global Market Attractiveness by Garage type, 2024 to 2034

Figure 32: Global Market Attractiveness by Application, 2024 to 2034

Figure 33: Global Market Attractiveness by Installation type, 2024 to 2034

Figure 34: Global Market Attractiveness by Function type, 2024 to 2034

Figure 35: Global Market Attractiveness by Vehicle Type, 2024 to 2034

Figure 36: Global Market Attractiveness by Region, 2024 to 2034

Figure 37: North America Market Value (US$ Million) by Garage type, 2024 to 2034

Figure 38: North America Market Value (US$ Million) by Application, 2024 to 2034

Figure 39: North America Market Value (US$ Million) by Installation type, 2024 to 2034

Figure 40: North America Market Value (US$ Million) by Function type, 2024 to 2034

Figure 41: North America Market Value (US$ Million) by Vehicle Type, 2024 to 2034

Figure 42: North America Market Value (US$ Million) by Country, 2024 to 2034

Figure 43: North America Market Value (US$ Million) Analysis by Country, 2019 to 2034

Figure 44: North America Market Volume (Units) Analysis by Country, 2019 to 2034

Figure 45: North America Market Value Share (%) and BPS Analysis by Country, 2024 to 2034

Figure 46: North America Market Y-o-Y Growth (%) Projections by Country, 2024 to 2034

Figure 47: North America Market Value (US$ Million) Analysis by Garage type, 2019 to 2034

Figure 48: North America Market Volume (Units) Analysis by Garage type, 2019 to 2034

Figure 49: North America Market Value Share (%) and BPS Analysis by Garage type, 2024 to 2034

Figure 50: North America Market Y-o-Y Growth (%) Projections by Garage type, 2024 to 2034

Figure 51: North America Market Value (US$ Million) Analysis by Application, 2019 to 2034

Figure 52: North America Market Volume (Units) Analysis by Application, 2019 to 2034

Figure 53: North America Market Value Share (%) and BPS Analysis by Application, 2024 to 2034

Figure 54: North America Market Y-o-Y Growth (%) Projections by Application, 2024 to 2034

Figure 55: North America Market Value (US$ Million) Analysis by Installation type, 2019 to 2034

Figure 56: North America Market Volume (Units) Analysis by Installation type, 2019 to 2034

Figure 57: North America Market Value Share (%) and BPS Analysis by Installation type, 2024 to 2034

Figure 58: North America Market Y-o-Y Growth (%) Projections by Installation type, 2024 to 2034

Figure 59: North America Market Value (US$ Million) Analysis by Function type, 2019 to 2034

Figure 60: North America Market Volume (Units) Analysis by Function type, 2019 to 2034

Figure 61: North America Market Value Share (%) and BPS Analysis by Function type, 2024 to 2034

Figure 62: North America Market Y-o-Y Growth (%) Projections by Function type, 2024 to 2034

Figure 63: North America Market Value (US$ Million) Analysis by Vehicle Type, 2019 to 2034

Figure 64: North America Market Volume (Units) Analysis by Vehicle Type, 2019 to 2034

Figure 65: North America Market Value Share (%) and BPS Analysis by Vehicle Type, 2024 to 2034

Figure 66: North America Market Y-o-Y Growth (%) Projections by Vehicle Type, 2024 to 2034

Figure 67: North America Market Attractiveness by Garage type, 2024 to 2034

Figure 68: North America Market Attractiveness by Application, 2024 to 2034

Figure 69: North America Market Attractiveness by Installation type, 2024 to 2034

Figure 70: North America Market Attractiveness by Function type, 2024 to 2034

Figure 71: North America Market Attractiveness by Vehicle Type, 2024 to 2034

Figure 72: North America Market Attractiveness by Country, 2024 to 2034

Figure 73: Latin America Market Value (US$ Million) by Garage type, 2024 to 2034

Figure 74: Latin America Market Value (US$ Million) by Application, 2024 to 2034

Figure 75: Latin America Market Value (US$ Million) by Installation type, 2024 to 2034

Figure 76: Latin America Market Value (US$ Million) by Function type, 2024 to 2034

Figure 77: Latin America Market Value (US$ Million) by Vehicle Type, 2024 to 2034

Figure 78: Latin America Market Value (US$ Million) by Country, 2024 to 2034

Figure 79: Latin America Market Value (US$ Million) Analysis by Country, 2019 to 2034

Figure 80: Latin America Market Volume (Units) Analysis by Country, 2019 to 2034

Figure 81: Latin America Market Value Share (%) and BPS Analysis by Country, 2024 to 2034

Figure 82: Latin America Market Y-o-Y Growth (%) Projections by Country, 2024 to 2034

Figure 83: Latin America Market Value (US$ Million) Analysis by Garage type, 2019 to 2034

Figure 84: Latin America Market Volume (Units) Analysis by Garage type, 2019 to 2034

Figure 85: Latin America Market Value Share (%) and BPS Analysis by Garage type, 2024 to 2034

Figure 86: Latin America Market Y-o-Y Growth (%) Projections by Garage type, 2024 to 2034

Figure 87: Latin America Market Value (US$ Million) Analysis by Application, 2019 to 2034

Figure 88: Latin America Market Volume (Units) Analysis by Application, 2019 to 2034

Figure 89: Latin America Market Value Share (%) and BPS Analysis by Application, 2024 to 2034

Figure 90: Latin America Market Y-o-Y Growth (%) Projections by Application, 2024 to 2034

Figure 91: Latin America Market Value (US$ Million) Analysis by Installation type, 2019 to 2034

Figure 92: Latin America Market Volume (Units) Analysis by Installation type, 2019 to 2034

Figure 93: Latin America Market Value Share (%) and BPS Analysis by Installation type, 2024 to 2034

Figure 94: Latin America Market Y-o-Y Growth (%) Projections by Installation type, 2024 to 2034

Figure 95: Latin America Market Value (US$ Million) Analysis by Function type, 2019 to 2034

Figure 96: Latin America Market Volume (Units) Analysis by Function type, 2019 to 2034

Figure 97: Latin America Market Value Share (%) and BPS Analysis by Function type, 2024 to 2034

Figure 98: Latin America Market Y-o-Y Growth (%) Projections by Function type, 2024 to 2034

Figure 99: Latin America Market Value (US$ Million) Analysis by Vehicle Type, 2019 to 2034

Figure 100: Latin America Market Volume (Units) Analysis by Vehicle Type, 2019 to 2034

Figure 101: Latin America Market Value Share (%) and BPS Analysis by Vehicle Type, 2024 to 2034

Figure 102: Latin America Market Y-o-Y Growth (%) Projections by Vehicle Type, 2024 to 2034

Figure 103: Latin America Market Attractiveness by Garage type, 2024 to 2034

Figure 104: Latin America Market Attractiveness by Application, 2024 to 2034

Figure 105: Latin America Market Attractiveness by Installation type, 2024 to 2034

Figure 106: Latin America Market Attractiveness by Function type, 2024 to 2034

Figure 107: Latin America Market Attractiveness by Vehicle Type, 2024 to 2034

Figure 108: Latin America Market Attractiveness by Country, 2024 to 2034

Figure 109: Europe Market Value (US$ Million) by Garage type, 2024 to 2034

Figure 110: Europe Market Value (US$ Million) by Application, 2024 to 2034

Figure 111: Europe Market Value (US$ Million) by Installation type, 2024 to 2034

Figure 112: Europe Market Value (US$ Million) by Function type, 2024 to 2034

Figure 113: Europe Market Value (US$ Million) by Vehicle Type, 2024 to 2034

Figure 114: Europe Market Value (US$ Million) by Country, 2024 to 2034

Figure 115: Europe Market Value (US$ Million) Analysis by Country, 2019 to 2034

Figure 116: Europe Market Volume (Units) Analysis by Country, 2019 to 2034

Figure 117: Europe Market Value Share (%) and BPS Analysis by Country, 2024 to 2034

Figure 118: Europe Market Y-o-Y Growth (%) Projections by Country, 2024 to 2034

Figure 119: Europe Market Value (US$ Million) Analysis by Garage type, 2019 to 2034

Figure 120: Europe Market Volume (Units) Analysis by Garage type, 2019 to 2034

Figure 121: Europe Market Value Share (%) and BPS Analysis by Garage type, 2024 to 2034

Figure 122: Europe Market Y-o-Y Growth (%) Projections by Garage type, 2024 to 2034

Figure 123: Europe Market Value (US$ Million) Analysis by Application, 2019 to 2034

Figure 124: Europe Market Volume (Units) Analysis by Application, 2019 to 2034

Figure 125: Europe Market Value Share (%) and BPS Analysis by Application, 2024 to 2034

Figure 126: Europe Market Y-o-Y Growth (%) Projections by Application, 2024 to 2034

Figure 127: Europe Market Value (US$ Million) Analysis by Installation type, 2019 to 2034

Figure 128: Europe Market Volume (Units) Analysis by Installation type, 2019 to 2034

Figure 129: Europe Market Value Share (%) and BPS Analysis by Installation type, 2024 to 2034

Figure 130: Europe Market Y-o-Y Growth (%) Projections by Installation type, 2024 to 2034

Figure 131: Europe Market Value (US$ Million) Analysis by Function type, 2019 to 2034

Figure 132: Europe Market Volume (Units) Analysis by Function type, 2019 to 2034

Figure 133: Europe Market Value Share (%) and BPS Analysis by Function type, 2024 to 2034

Figure 134: Europe Market Y-o-Y Growth (%) Projections by Function type, 2024 to 2034

Figure 135: Europe Market Value (US$ Million) Analysis by Vehicle Type, 2019 to 2034

Figure 136: Europe Market Volume (Units) Analysis by Vehicle Type, 2019 to 2034

Figure 137: Europe Market Value Share (%) and BPS Analysis by Vehicle Type, 2024 to 2034

Figure 138: Europe Market Y-o-Y Growth (%) Projections by Vehicle Type, 2024 to 2034

Figure 139: Europe Market Attractiveness by Garage type, 2024 to 2034

Figure 140: Europe Market Attractiveness by Application, 2024 to 2034

Figure 141: Europe Market Attractiveness by Installation type, 2024 to 2034

Figure 142: Europe Market Attractiveness by Function type, 2024 to 2034

Figure 143: Europe Market Attractiveness by Vehicle Type, 2024 to 2034

Figure 144: Europe Market Attractiveness by Country, 2024 to 2034

Figure 145: East Asia Market Value (US$ Million) by Garage type, 2024 to 2034

Figure 146: East Asia Market Value (US$ Million) by Application, 2024 to 2034

Figure 147: East Asia Market Value (US$ Million) by Installation type, 2024 to 2034

Figure 148: East Asia Market Value (US$ Million) by Function type, 2024 to 2034

Figure 149: East Asia Market Value (US$ Million) by Vehicle Type, 2024 to 2034

Figure 150: East Asia Market Value (US$ Million) by Country, 2024 to 2034

Figure 151: East Asia Market Value (US$ Million) Analysis by Country, 2019 to 2034

Figure 152: East Asia Market Volume (Units) Analysis by Country, 2019 to 2034

Figure 153: East Asia Market Value Share (%) and BPS Analysis by Country, 2024 to 2034

Figure 154: East Asia Market Y-o-Y Growth (%) Projections by Country, 2024 to 2034

Figure 155: East Asia Market Value (US$ Million) Analysis by Garage type, 2019 to 2034

Figure 156: East Asia Market Volume (Units) Analysis by Garage type, 2019 to 2034

Figure 157: East Asia Market Value Share (%) and BPS Analysis by Garage type, 2024 to 2034

Figure 158: East Asia Market Y-o-Y Growth (%) Projections by Garage type, 2024 to 2034

Figure 159: East Asia Market Value (US$ Million) Analysis by Application, 2019 to 2034

Figure 160: East Asia Market Volume (Units) Analysis by Application, 2019 to 2034

Figure 161: East Asia Market Value Share (%) and BPS Analysis by Application, 2024 to 2034

Figure 162: East Asia Market Y-o-Y Growth (%) Projections by Application, 2024 to 2034

Figure 163: East Asia Market Value (US$ Million) Analysis by Installation type, 2019 to 2034

Figure 164: East Asia Market Volume (Units) Analysis by Installation type, 2019 to 2034

Figure 165: East Asia Market Value Share (%) and BPS Analysis by Installation type, 2024 to 2034

Figure 166: East Asia Market Y-o-Y Growth (%) Projections by Installation type, 2024 to 2034

Figure 167: East Asia Market Value (US$ Million) Analysis by Function type, 2019 to 2034

Figure 168: East Asia Market Volume (Units) Analysis by Function type, 2019 to 2034

Figure 169: East Asia Market Value Share (%) and BPS Analysis by Function type, 2024 to 2034

Figure 170: East Asia Market Y-o-Y Growth (%) Projections by Function type, 2024 to 2034

Figure 171: East Asia Market Value (US$ Million) Analysis by Vehicle Type, 2019 to 2034

Figure 172: East Asia Market Volume (Units) Analysis by Vehicle Type, 2019 to 2034

Figure 173: East Asia Market Value Share (%) and BPS Analysis by Vehicle Type, 2024 to 2034

Figure 174: East Asia Market Y-o-Y Growth (%) Projections by Vehicle Type, 2024 to 2034

Figure 175: East Asia Market Attractiveness by Garage type, 2024 to 2034

Figure 176: East Asia Market Attractiveness by Application, 2024 to 2034

Figure 177: East Asia Market Attractiveness by Installation type, 2024 to 2034

Figure 178: East Asia Market Attractiveness by Function type, 2024 to 2034

Figure 179: East Asia Market Attractiveness by Vehicle Type, 2024 to 2034

Figure 180: East Asia Market Attractiveness by Country, 2024 to 2034

Figure 181: South Asia Market Value (US$ Million) by Garage type, 2024 to 2034

Figure 182: South Asia Market Value (US$ Million) by Application, 2024 to 2034

Figure 183: South Asia Market Value (US$ Million) by Installation type, 2024 to 2034

Figure 184: South Asia Market Value (US$ Million) by Function type, 2024 to 2034

Figure 185: South Asia Market Value (US$ Million) by Vehicle Type, 2024 to 2034

Figure 186: South Asia Market Value (US$ Million) by Country, 2024 to 2034

Figure 187: South Asia Market Value (US$ Million) Analysis by Country, 2019 to 2034

Figure 188: South Asia Market Volume (Units) Analysis by Country, 2019 to 2034

Figure 189: South Asia Market Value Share (%) and BPS Analysis by Country, 2024 to 2034

Figure 190: South Asia Market Y-o-Y Growth (%) Projections by Country, 2024 to 2034

Figure 191: South Asia Market Value (US$ Million) Analysis by Garage type, 2019 to 2034

Figure 192: South Asia Market Volume (Units) Analysis by Garage type, 2019 to 2034

Figure 193: South Asia Market Value Share (%) and BPS Analysis by Garage type, 2024 to 2034

Figure 194: South Asia Market Y-o-Y Growth (%) Projections by Garage type, 2024 to 2034

Figure 195: South Asia Market Value (US$ Million) Analysis by Application, 2019 to 2034

Figure 196: South Asia Market Volume (Units) Analysis by Application, 2019 to 2034

Figure 197: South Asia Market Value Share (%) and BPS Analysis by Application, 2024 to 2034

Figure 198: South Asia Market Y-o-Y Growth (%) Projections by Application, 2024 to 2034

Figure 199: South Asia Market Value (US$ Million) Analysis by Installation type, 2019 to 2034

Figure 200: South Asia Market Volume (Units) Analysis by Installation type, 2019 to 2034

Figure 201: South Asia Market Value Share (%) and BPS Analysis by Installation type, 2024 to 2034

Figure 202: South Asia Market Y-o-Y Growth (%) Projections by Installation type, 2024 to 2034

Figure 203: South Asia Market Value (US$ Million) Analysis by Function type, 2019 to 2034

Figure 204: South Asia Market Volume (Units) Analysis by Function type, 2019 to 2034

Figure 205: South Asia Market Value Share (%) and BPS Analysis by Function type, 2024 to 2034

Figure 206: South Asia Market Y-o-Y Growth (%) Projections by Function type, 2024 to 2034

Figure 207: South Asia Market Value (US$ Million) Analysis by Vehicle Type, 2019 to 2034

Figure 208: South Asia Market Volume (Units) Analysis by Vehicle Type, 2019 to 2034

Figure 209: South Asia Market Value Share (%) and BPS Analysis by Vehicle Type, 2024 to 2034

Figure 210: South Asia Market Y-o-Y Growth (%) Projections by Vehicle Type, 2024 to 2034

Figure 211: South Asia Market Attractiveness by Garage type, 2024 to 2034

Figure 212: South Asia Market Attractiveness by Application, 2024 to 2034

Figure 213: South Asia Market Attractiveness by Installation type, 2024 to 2034

Figure 214: South Asia Market Attractiveness by Function type, 2024 to 2034

Figure 215: South Asia Market Attractiveness by Vehicle Type, 2024 to 2034

Figure 216: South Asia Market Attractiveness by Country, 2024 to 2034

Figure 217: Oceania Market Value (US$ Million) by Garage type, 2024 to 2034

Figure 218: Oceania Market Value (US$ Million) by Application, 2024 to 2034

Figure 219: Oceania Market Value (US$ Million) by Installation type, 2024 to 2034

Figure 220: Oceania Market Value (US$ Million) by Function type, 2024 to 2034

Figure 221: Oceania Market Value (US$ Million) by Vehicle Type, 2024 to 2034

Figure 222: Oceania Market Value (US$ Million) by Country, 2024 to 2034

Figure 223: Oceania Market Value (US$ Million) Analysis by Country, 2019 to 2034

Figure 224: Oceania Market Volume (Units) Analysis by Country, 2019 to 2034

Figure 225: Oceania Market Value Share (%) and BPS Analysis by Country, 2024 to 2034

Figure 226: Oceania Market Y-o-Y Growth (%) Projections by Country, 2024 to 2034

Figure 227: Oceania Market Value (US$ Million) Analysis by Garage type, 2019 to 2034

Figure 228: Oceania Market Volume (Units) Analysis by Garage type, 2019 to 2034

Figure 229: Oceania Market Value Share (%) and BPS Analysis by Garage type, 2024 to 2034

Figure 230: Oceania Market Y-o-Y Growth (%) Projections by Garage type, 2024 to 2034

Figure 231: Oceania Market Value (US$ Million) Analysis by Application, 2019 to 2034

Figure 232: Oceania Market Volume (Units) Analysis by Application, 2019 to 2034

Figure 233: Oceania Market Value Share (%) and BPS Analysis by Application, 2024 to 2034

Figure 234: Oceania Market Y-o-Y Growth (%) Projections by Application, 2024 to 2034

Figure 235: Oceania Market Value (US$ Million) Analysis by Installation type, 2019 to 2034

Figure 236: Oceania Market Volume (Units) Analysis by Installation type, 2019 to 2034

Figure 237: Oceania Market Value Share (%) and BPS Analysis by Installation type, 2024 to 2034

Figure 238: Oceania Market Y-o-Y Growth (%) Projections by Installation type, 2024 to 2034

Figure 239: Oceania Market Value (US$ Million) Analysis by Function type, 2019 to 2034

Figure 240: Oceania Market Volume (Units) Analysis by Function type, 2019 to 2034

Figure 241: Oceania Market Value Share (%) and BPS Analysis by Function type, 2024 to 2034

Figure 242: Oceania Market Y-o-Y Growth (%) Projections by Function type, 2024 to 2034

Figure 243: Oceania Market Value (US$ Million) Analysis by Vehicle Type, 2019 to 2034

Figure 244: Oceania Market Volume (Units) Analysis by Vehicle Type, 2019 to 2034

Figure 245: Oceania Market Value Share (%) and BPS Analysis by Vehicle Type, 2024 to 2034

Figure 246: Oceania Market Y-o-Y Growth (%) Projections by Vehicle Type, 2024 to 2034

Figure 247: Oceania Market Attractiveness by Garage type, 2024 to 2034

Figure 248: Oceania Market Attractiveness by Application, 2024 to 2034

Figure 249: Oceania Market Attractiveness by Installation type, 2024 to 2034

Figure 250: Oceania Market Attractiveness by Function type, 2024 to 2034

Figure 251: Oceania Market Attractiveness by Vehicle Type, 2024 to 2034

Figure 252: Oceania Market Attractiveness by Country, 2024 to 2034

Figure 253: MEA Market Value (US$ Million) by Garage type, 2024 to 2034

Figure 254: MEA Market Value (US$ Million) by Application, 2024 to 2034

Figure 255: MEA Market Value (US$ Million) by Installation type, 2024 to 2034

Figure 256: MEA Market Value (US$ Million) by Function type, 2024 to 2034

Figure 257: MEA Market Value (US$ Million) by Vehicle Type, 2024 to 2034

Figure 258: MEA Market Value (US$ Million) by Country, 2024 to 2034

Figure 259: MEA Market Value (US$ Million) Analysis by Country, 2019 to 2034

Figure 260: MEA Market Volume (Units) Analysis by Country, 2019 to 2034

Figure 261: MEA Market Value Share (%) and BPS Analysis by Country, 2024 to 2034

Figure 262: MEA Market Y-o-Y Growth (%) Projections by Country, 2024 to 2034

Figure 263: MEA Market Value (US$ Million) Analysis by Garage type, 2019 to 2034

Figure 264: MEA Market Volume (Units) Analysis by Garage type, 2019 to 2034

Figure 265: MEA Market Value Share (%) and BPS Analysis by Garage type, 2024 to 2034

Figure 266: MEA Market Y-o-Y Growth (%) Projections by Garage type, 2024 to 2034

Figure 267: MEA Market Value (US$ Million) Analysis by Application, 2019 to 2034

Figure 268: MEA Market Volume (Units) Analysis by Application, 2019 to 2034

Figure 269: MEA Market Value Share (%) and BPS Analysis by Application, 2024 to 2034

Figure 270: MEA Market Y-o-Y Growth (%) Projections by Application, 2024 to 2034

Figure 271: MEA Market Value (US$ Million) Analysis by Installation type, 2019 to 2034

Figure 272: MEA Market Volume (Units) Analysis by Installation type, 2019 to 2034

Figure 273: MEA Market Value Share (%) and BPS Analysis by Installation type, 2024 to 2034

Figure 274: MEA Market Y-o-Y Growth (%) Projections by Installation type, 2024 to 2034

Figure 275: MEA Market Value (US$ Million) Analysis by Function type, 2019 to 2034

Figure 276: MEA Market Volume (Units) Analysis by Function type, 2019 to 2034

Figure 277: MEA Market Value Share (%) and BPS Analysis by Function type, 2024 to 2034

Figure 278: MEA Market Y-o-Y Growth (%) Projections by Function type, 2024 to 2034

Figure 279: MEA Market Value (US$ Million) Analysis by Vehicle Type, 2019 to 2034

Figure 280: MEA Market Volume (Units) Analysis by Vehicle Type, 2019 to 2034

Figure 281: MEA Market Value Share (%) and BPS Analysis by Vehicle Type, 2024 to 2034

Figure 282: MEA Market Y-o-Y Growth (%) Projections by Vehicle Type, 2024 to 2034

Figure 283: MEA Market Attractiveness by Garage type, 2024 to 2034

Figure 284: MEA Market Attractiveness by Application, 2024 to 2034

Figure 285: MEA Market Attractiveness by Installation type, 2024 to 2034

Figure 286: MEA Market Attractiveness by Function type, 2024 to 2034

Figure 287: MEA Market Attractiveness by Vehicle Type, 2024 to 2034

Figure 288: MEA Market Attractiveness by Country, 2024 to 2034

Frequently Asked Questions

What is the Garage Equipment Market Valuation in 2024?

The garage equipment market is predicted to be worth USD 9.4 billion in 2024.

What is the Sales Forecast for Garage Equipment through 2034?

The market is expected to reach USD 21.2 billion by 2034.

At What Rate is the Market Growing through 2034?

The market is growing at a CAGR of 8.5% from 2024 to 2034.

Which are the Key Companies for Garage Equipment?

Some key players in the market are Autec, CORGHI, Integrated Garage Equipment, Hennesy Industries, and Automotive Equipment International.

Which is the Top Garage Type in the Market?

The OEM-authorized garage segment is expected to advance at an 8.3% CAGR through 2034.

Explore Similar Insights

Future Market Insights

Garage Equipment Market