The automotive garage equipment market is projected to grow from USD 31.8 billion in 2025 to USD 75.3 billion by 2035, driven by increasing demand for advanced workshop solutions, vehicle maintenance tools, and diagnostic equipment. The growth will be driven by increasing vehicle ownership, the need for efficient repair and maintenance services, and the adoption of technologically advanced equipment that enhances operational productivity in garages and service centers. Automation, digital diagnostics, and energy-efficient machinery are likely to influence investment decisions, particularly in developed markets with mature automotive sectors.
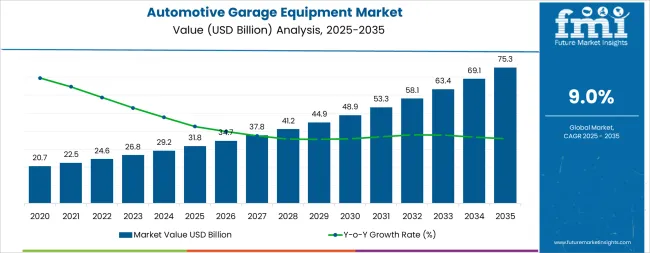
Comparing growth across the decade, the first five years will focus on modernizing existing facilities, replacing outdated tools, and integrating basic digital solutions, supporting steady adoption. The latter half of the period is expected to witness accelerated growth as emerging technologies, including AI-assisted diagnostics and connected garage equipment, become mainstream. Expansion into regions with growing automotive demand and rising vehicle fleets will further boost the market size. By 2035, the market is projected to more than double its 2025 value, demonstrating strong momentum and a shift toward more advanced, efficient, and reliable automotive garage solutions globally.
The automotive garage equipment market is mainly divided between OEM-authorized garages and independent garages. OEM-authorized garages hold around 46% of the market, benefiting from direct ties with vehicle manufacturers, access to specialized tools, and trained personnel. Independent garages account for approximately 45%, providing flexible and cost-effective services, particularly for vehicles out of warranty. The remaining share is distributed among smaller service chains and specialty workshops. Together, these segments form the core of the market, balancing brand-specific expertise with broader accessibility for vehicle owners across diverse regions.
Recent trends in the automotive garage equipment market focus on digitalization, electrification, and sustainability. Garages are increasingly adopting advanced diagnostic tools, automated service systems, and data-driven maintenance solutions. The rise of electric vehicles is driving investment in specialized EV repair and charging equipment. Eco-friendly practices, including energy-efficient lifts and tools, are becoming more common.
| Metric | Value |
|---|---|
| Estimated Value in (2025E) | USD 31.8 billion |
| Forecast Value in (2035F) | USD 75.3 billion |
| Forecast CAGR (2025 to 2035) | 9.0% |
Market expansion is being supported by the increasing complexity of modern vehicles and the corresponding need for advanced diagnostic and repair equipment in automotive service applications across global independent workshops and dealership service operations. Modern automotive service providers are increasingly focused on specialized equipment technologies that can diagnose sophisticated electronic systems, support electric vehicle maintenance, and enhance service efficiency while meeting stringent quality and safety requirements. The proven efficacy of advanced garage equipment in various automotive service applications makes them an essential component of comprehensive workshop modernization strategies and service quality improvement initiatives.
The growing emphasis on vehicle electrification and advanced driver assistance systems is driving demand for ultra-sophisticated diagnostic equipment that meets stringent performance specifications and regulatory requirements for automotive service applications. Service providers' preference for reliable, high-performance equipment systems that can ensure consistent diagnostic accuracy is creating opportunities for innovative technologies and customized workshop solutions. The rising influence of manufacturer certification programs and quality standards is also contributing to increased adoption of premium-grade automotive garage equipment across different service applications and workshop facilities requiring specialized diagnostic and repair technology.
The automotive garage equipment market represents a dynamic growth opportunity, expanding from USD 31.8 billion in 2025 to USD 75.3 billion by 2035 at a 9.0% CAGR. As automotive service providers prioritize diagnostic accuracy, operational efficiency, and multi-brand service capability in complex vehicle repair processes, automotive garage equipment has evolved from basic mechanical tools to sophisticated diagnostic platforms enabling electronic system analysis, calibration services, and comprehensive vehicle health monitoring across traditional internal combustion, hybrid, and fully electric vehicle platforms.
The convergence of vehicle complexity escalation, increasing electric vehicle adoption, specialized service technology requirements, and connected workshop transformation creates sustained momentum in demand. Advanced diagnostic scanners offering comprehensive system coverage, electric vehicle-specific service equipment balancing safety with functionality, and augmented reality-guided repair solutions for training efficiency will capture market premiums, while geographic expansion into high-growth Asian service markets and emerging market penetration will drive volume leadership. Regulatory emphasis on service quality standardization and technician certification provides structural support.
The market is segmented by vehicle type, equipment type, end-user, and region. By vehicle type, the market is divided into Light Vehicles, Heavy-Duty Vehicles, Two-Wheelers, and Others. Based on equipment type, the market is categorized into Vehicle Diagnostics & Testing, Lifting Equipment, Wheel & Tire Service Equipment, Washing & Cleaning Equipment, Body Shop Equipment, and Others. By end-user, the market includes Independent Workshops, Authorized Service Centers, and DIY/Retail. Regionally, the market is divided into North America, Europe, East Asia, South Asia, Latin America, and the Middle East & Africa.
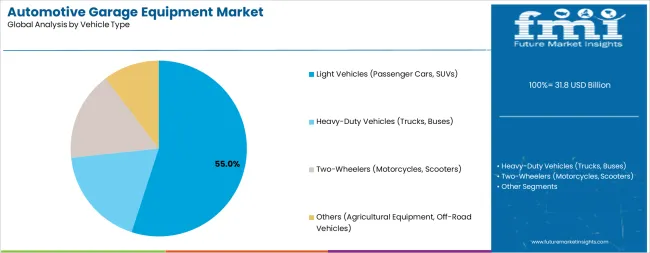
The Light Vehicles segment is projected to account for 55% of the automotive garage equipment market in 2025, reaffirming its position as the category's dominant vehicle type. Equipment manufacturers and service providers increasingly recognize the substantial market scale represented by passenger car servicing, particularly given global light vehicle parc exceeding one billion units requiring ongoing maintenance and repair services. This vehicle segment addresses both mass-market service requirements and premium brand service facilities while driving the majority of equipment sales across diverse service applications.
This vehicle type forms the foundation of most automotive service business models, as it represents the largest addressable market and most consistent service demand patterns in the industry. Multi-brand diagnostic capability requirements and extensive vehicle platform coverage continue to drive equipment investment among independent service providers and dealership networks. With increasing recognition of the profitability optimization requirements in automotive service operations, Light Vehicle equipment investments align with both revenue generation potential and service capability expansion goals, making them the central growth driver of comprehensive workshop equipment strategies.
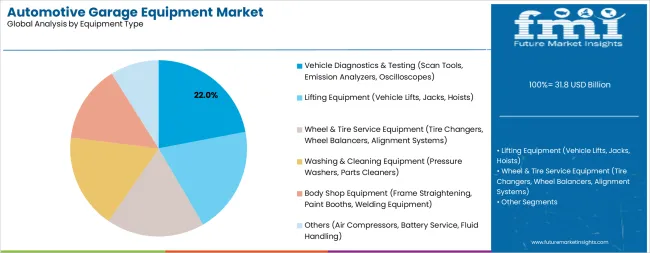
Vehicle Diagnostics & Testing equipment is projected to exhibit the strongest growth trajectory at a 10.2% CAGR through 2035, representing approximately 22% of the automotive garage equipment market. This exceptional growth reflects the escalating complexity of modern vehicle electronic systems, the proliferation of advanced driver assistance systems requiring specialized calibration equipment, and the emergence of electric vehicle platforms demanding entirely new diagnostic capabilities. Service providers recognize that without advanced diagnostic equipment, they cannot effectively service modern vehicles or compete for premium service work.
The segment is supported by the continuous introduction of new vehicle technologies, requiring updated diagnostic software and hardware capabilities, and the increasing recognition that diagnostic accuracy directly impacts repair success rates and customer satisfaction. The manufacturer certification programs increasingly mandate specific diagnostic equipment capabilities, compelling independent service providers to invest in advanced equipment to maintain service authorization. As vehicle electrification accelerates and software-defined vehicle architectures proliferate, diagnostic and testing equipment will continue to play the most crucial role in comprehensive automotive service capabilities within the garage equipment market.
The automotive garage equipment market is advancing steadily due to increasing recognition of advanced diagnostic technologies' importance and growing demand for sophisticated service equipment across the automotive aftermarket and dealership service sectors. The market faces challenges, including high capital equipment costs potentially limiting small workshop modernization, rapid technology obsolescence requiring frequent equipment updates, and concerns about equipment utilization rates in specialized applications. Innovation in cloud-connected diagnostics and subscription-based equipment models continues to influence market development and service facility investment patterns.
The accelerating transition to electric vehicle platforms is fundamentally transforming automotive service equipment requirements and creating substantial new equipment categories. Specialized EV service equipment encompasses high-voltage safety tools including insulated hand tools and personal protective equipment, battery diagnostic systems capable of cell-level health assessment, thermal imaging cameras for electrical system fault detection, and charging infrastructure testing equipment. Service facilities investing in EV certification programs require comprehensive equipment packages addressing both safety compliance and diagnostic capability requirements, creating premium equipment sales opportunities for manufacturers offering integrated EV service solutions and technician training programs.
Modern equipment manufacturers are incorporating advanced digital technologies including AI-powered diagnostic assistance, augmented reality repair guidance, and predictive maintenance analytics to enhance service efficiency and diagnostic accuracy. AI algorithms analyze vehicle data streams to identify fault patterns and recommend diagnostic procedures, reducing diagnostic time and improving first-time fix rates. Augmented reality systems overlay digital repair instructions onto physical vehicles through technician-worn devices, accelerating training effectiveness and reducing repair errors. Cloud connectivity enables remote expert support, allowing experienced technicians to guide less experienced colleagues through complex procedures in real-time, democratizing service expertise across distributed workshop networks.
Evolving business models are transforming equipment procurement approaches, with manufacturers increasingly offering subscription-based diagnostic software, equipment leasing programs, and comprehensive service packages bundling equipment, software updates, and technical support. These models reduce upfront capital requirements for service facilities, ensure access to latest equipment capabilities, and create recurring revenue streams for equipment manufacturers. Equipment-as-a-service offerings particularly benefit small and medium-sized workshops lacking capital for major equipment investments while ensuring they maintain competitive service capabilities. This trend is democratizing access to advanced diagnostic equipment and accelerating technology adoption across the automotive service industry.
| Country | CAGR (2025-2035) |
|---|---|
| India | 9.9% |
| China | 9.3% |
| Brazil | 9.1% |
| United States | 8.3% |
| Germany | 8.0% |
| United Kingdom | 7.8% |
| Japan | 7.7% |
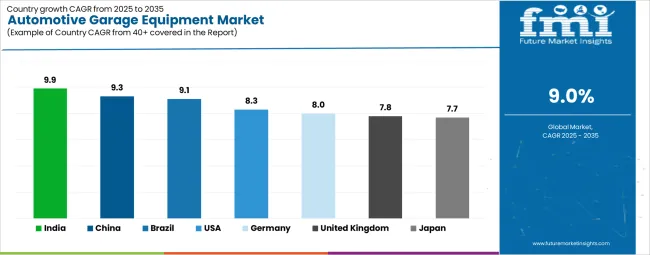
The automotive garage equipment market is experiencing varied growth globally, with the United States leading in absolute market size at USD 6.9 billion in 2025, advancing at an 8.3% CAGR through 2035, driven by extensive independent aftermarket infrastructure, high vehicle ownership rates, and continuous technology adoption. China follows at USD 5.4 billion with a robust 9.3% CAGR, supported by rapid vehicle parc expansion, increasing service sophistication, and domestic manufacturing capabilities. Germany demonstrates USD 3.1 billion with an 8.0% CAGR, emphasizing precision equipment manufacturing and premium vehicle service requirements.
Japan records USD 2.9 billion with a 7.7% CAGR, reflecting mature market characteristics and advanced technology adoption. India shows USD 2.4 billion with the highest 9.9% CAGR, driven by motorization acceleration and service industry modernization. The United Kingdom exhibits USD 2.6 billion with a 7.8% CAGR, supported by established service infrastructure and regulatory compliance requirements. Brazil demonstrates USD 1.9 billion with a 9.1% CAGR, driven by growing vehicle ownership and expanding service capacity.
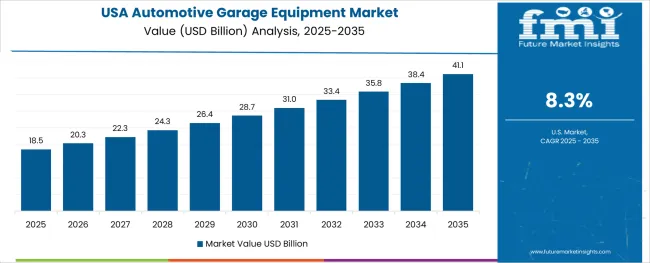
The demand for automotive garage equipment in the United States is projected to exhibit robust growth from USD 6.9 billion in 2025 at a CAGR of 8.3% through 2035, driven by the world's largest independent automotive aftermarket infrastructure and increasing recognition of advanced diagnostic equipment as essential for servicing modern vehicles. The country's extensive network of independent workshops, franchise service chains, and dealership service departments creates significant opportunities for equipment adoption across both replacement cycles and capacity expansion initiatives. Major international and domestic equipment manufacturers maintain comprehensive distribution networks including equipment dealers, direct sales teams, and e-commerce channels to serve the diverse population of automotive service providers requiring high-performance diagnostic and repair equipment across light vehicle, commercial truck, and specialty vehicle service applications throughout the United States' vast geographical service market.
The American automotive service industry's emphasis on productivity optimization and diagnostic accuracy is driving substantial investments in advanced equipment technologies. This trend, combined with the country's large and aging vehicle parc requiring increasing service intensity, creates a favorable environment for automotive garage equipment market development. American service providers are increasingly focusing on certification programs and manufacturer-approved equipment to capture warranty and recall service work, with advanced diagnostic capabilities representing a key competitive differentiator in this service transformation.
Revenue from automotive garage equipment in China is expanding from USD 5.4 billion at a robust 9.3% CAGR, driven by the world's largest automotive market, rapidly expanding vehicle parc, and increasing service facility sophistication. The country's position as both a massive domestic equipment market and dominant manufacturing base creates unique dynamics combining substantial local demand with competitive equipment supply. The market is characterized by diverse service facility types ranging from basic roadside repair shops to premium brand dealership networks, extensive domestic equipment manufacturing capabilities, and increasing quality expectations as vehicle ownership matures.
China's automotive garage equipment market benefits from government policies promoting new energy vehicle adoption driving EV service equipment demand, expanding middle-class vehicle ownership supporting service industry growth, and domestic manufacturers' increasing competitiveness in both price-sensitive and technology-advanced equipment segments. The country's ambitious automotive industry transformation toward electrification and intelligent connectivity creates sustained equipment modernization requirements.
Demand for automotive garage equipment in Germany is projected to grow from USD 3.1 billion at an 8.0% CAGR, supported by the country's position as Europe's automotive manufacturing center, extensive premium vehicle service requirements, and world-leading equipment manufacturing capabilities. German service providers consistently utilize cutting-edge diagnostic and repair equipment, with particular strength in premium brand dealership networks and specialized independent workshops serving sophisticated vehicle platforms. The market is characterized by high equipment quality standards, comprehensive technician training systems, and established relationships between equipment manufacturers and service facility operators.
Germany's automotive service equipment industry benefits from advanced engineering capabilities, strong automotive OEM relationships driving equipment specification requirements, and emphasis on precision and reliability reflecting broader German manufacturing excellence. The country's leadership in automotive technology innovation, particularly in electric vehicle development and autonomous driving systems, positions German equipment manufacturers at the forefront of next-generation service equipment development.
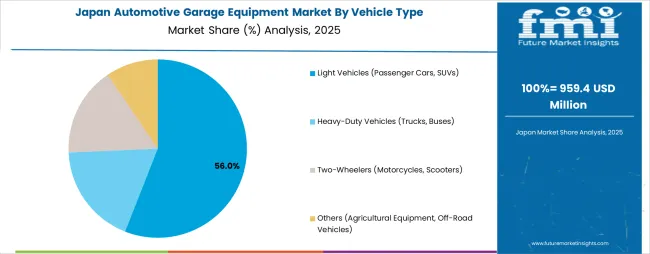
Revenue from automotive garage equipment in Japan is projected to grow from USD 2.9 billion at a 7.7% CAGR through 2035, supported by the country's mature automotive market, quality-focused service culture, and systematic approach to vehicle maintenance that emphasizes precision, reliability, and comprehensive vehicle care. Japanese service providers maintain high equipment investment levels reflecting cultural emphasis on service quality excellence, with dealership networks and independent workshops consistently upgrading equipment to support latest vehicle technologies. The market is characterized by strong brand loyalty, established service intervals driving consistent workshop activity, and emphasis on preventive maintenance supporting equipment utilization.
Japan's automotive garage equipment market benefits from domestic vehicle manufacturer leadership in hybrid and electric vehicle technologies driving specialized equipment requirements, advanced diagnostic equipment manufacturing capabilities, and strong emphasis on technician skill development supporting sophisticated equipment adoption. The country's aging vehicle parc and declining population create service industry consolidation pressures while supporting equipment efficiency investments.
Revenue from automotive garage equipment in India is expanding from USD 2.4 billion at an exceptional 9.9% CAGR, the highest among major markets, driven by rapid motorization, expanding middle-class vehicle ownership, and automotive service industry professionalization. The Indian market represents enormous untapped potential characterized by transition from traditional repair shops to organized service facilities, increasing equipment sophistication requirements, and growing consumer quality expectations. The market spans from basic hand tools and equipment for small workshops to comprehensive diagnostic platforms for authorized service centers and premium workshop chains.
India's automotive garage equipment market faces unique dynamics including significant price sensitivity in mass-market segments requiring cost-effective equipment solutions, rapidly growing premium segment demanding international-quality equipment, and expanding organized service chains driving standardized equipment procurement. International equipment manufacturers are establishing distribution networks and local assembly operations while domestic manufacturers develop increasingly sophisticated equipment offerings targeting cost-conscious service providers.
Revenue from automotive garage equipment in the United Kingdom is projected to grow from USD 2.6 billion at a 7.8% CAGR through 2035, supported by mature independent aftermarket infrastructure, comprehensive MOT testing requirements driving diagnostic equipment demand, and increasing electric vehicle adoption necessitating specialized service capabilities. British automotive service providers operate within well-established regulatory frameworks emphasizing service quality, safety compliance, and technician competence, creating consistent equipment investment requirements. The market benefits from strong franchise service network presence, independent garage consolidation trends, and comprehensive equipment dealer infrastructure.
The UK's automotive garage equipment market is characterized by equipment financing availability supporting workshop investments, strong emphasis on MOT testing equipment ensuring compliance with annual vehicle inspection requirements, and increasing focus on electric vehicle service training and equipment certification. The country's relatively compact geography supports centralized equipment distribution and technical support capabilities.
Revenue from automotive garage equipment in Brazil is projected to grow from USD 1.9 billion at a 9.1% CAGR through 2035, driven by expanding vehicle parc, increasing service facility sophistication, and growing recognition of equipment quality importance for service efficiency and customer satisfaction. The Brazilian market represents the largest automotive service opportunity in Latin America, characterized by diverse service facility types, increasing organized service chain presence, and equipment modernization requirements. The market benefits from domestic vehicle production, growing aftermarket parts distribution infrastructure, and increasing consumer vehicle ownership across expanding middle-class populations.
Brazil's automotive garage equipment sector faces opportunities in equipment accessibility improvement through financing programs, service industry professionalization supporting quality equipment adoption, and technology transfer from international manufacturers establishing local production or partnership arrangements. The country's large geographical scale creates distribution challenges while supporting regional equipment dealer networks and technical support infrastructure development.
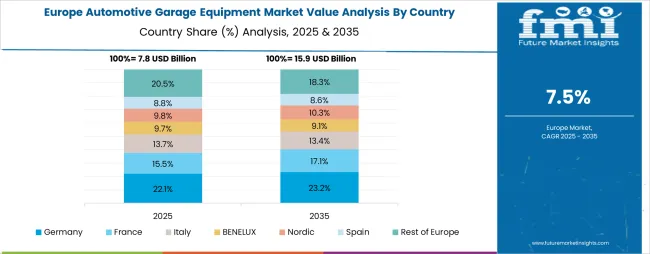
The automotive garage equipment market in Europe is projected to grow from USD 10.2 billion in 2025 to USD 18.1 billion by 2035, registering a CAGR of 5.9% over the forecast period. Germany is expected to maintain its leadership position with a 30.4% market share in 2025, rising to 31.2% by 2035, supported by its position as Europe's automotive manufacturing center, extensive premium vehicle service requirements, and world-leading equipment manufacturing capabilities including diagnostic systems and testing equipment. The United Kingdom follows with a 25.5% share in 2025, projected to reach 24.8% by 2035, driven by comprehensive MOT testing requirements, established independent aftermarket infrastructure, and increasing electric vehicle service equipment adoption.
France holds a 17.3% share in 2025, expected to increase to 17.9% by 2035, supported by large vehicle parc and expanding service network modernization. Italy commands a 13.8% share in 2025, projected to reach 14.1% by 2035, reflecting strong automotive heritage and premium vehicle service concentration. Spain accounts for 7.6% in 2025, expected to reach 7.8% by 2035. The Nordic region maintains a 3.2% share in 2025, growing to 3.4% by 2035, supported by advanced technology adoption and electric vehicle penetration. The Rest of Europe region is anticipated to hold 2.2% in 2025, declining slightly to 1.8% by 2035.
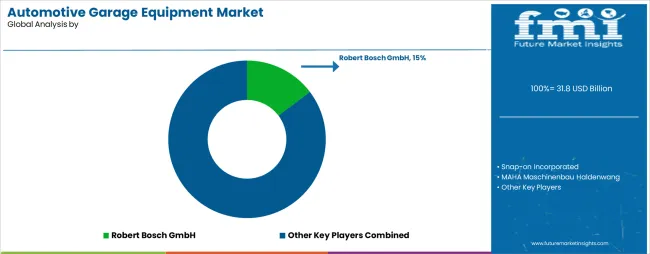
The automotive garage equipment market is characterized by competition among established global equipment manufacturers, specialized diagnostic equipment companies, and regional suppliers focused on delivering reliable, technologically advanced, and cost-effective automotive service solutions. Companies are investing in diagnostic software development, artificial intelligence integration, strategic distribution partnerships, and comprehensive technical support programs to deliver effective, efficient, and user-friendly automotive garage equipment solutions that meet demanding service facility requirements. Product innovation, software platform ecosystems, and service network excellence are central to strengthening market positions and customer loyalty.
Robert Bosch GmbH leads the market with comprehensive diagnostic equipment offerings, workshop equipment systems, and extensive global distribution infrastructure supporting independent workshops and dealership service centers. Snap-on Incorporated provides premium hand tools, diagnostic platforms, and equipment solutions with emphasis on professional technician market segments and comprehensive financing programs. MAHA Maschinenbau Haldenwang focuses on testing and measuring equipment including brake testers, emissions analyzers, and vehicle inspection systems for regulatory compliance applications. Hunter Engineering Company delivers specialized wheel alignment equipment, tire changers, and balancing systems serving tire service facilities and general automotive workshops.
Continental AG operates with diversified automotive service equipment portfolio leveraging automotive technology expertise and OEM relationships. Additional industry participants provide regional equipment distribution, specialized equipment categories, and aftermarket parts integration that complement primary equipment manufacturers' offerings and support comprehensive automotive service facility requirements across diverse geographic markets and service facility types.
| Items | Values |
|---|---|
| Quantitative Units (2025) | USD 31.8 billion |
| Vehicle Type | Light Vehicles, Heavy-Duty Vehicles, Two-Wheelers, Others |
| Equipment Type | Vehicle Diagnostics & Testing, Lifting Equipment, Wheel & Tire Service Equipment, Washing & Cleaning Equipment, Body Shop Equipment, Others |
| End-User | Independent Workshops, Authorized Service Centers, DIY/Retail |
| Regions Covered | North America, Europe, East Asia, South Asia, Latin America, Middle East & Africa |
| Countries Covered | United States, China, Germany, Japan, India, United Kingdom, Brazil and 40+ countries |
| Key Companies Profiled | Robert Bosch GmbH, Snap-on Incorporated, MAHA Maschinenbau Haldenwang, Hunter Engineering Company, Continental AG |
| Additional Attributes | Dollar sales by vehicle type and equipment type, regional demand trends, competitive landscape, service provider preferences for specific equipment configurations, integration with connected workshop platforms, innovations in diagnostic technologies, EV service capabilities, and subscription-based equipment models |
The global automotive garage equipment market is estimated to be valued at USD 31.8 billion in 2025.
The market size for the automotive garage equipment market is projected to reach USD 75.3 billion by 2035.
The automotive garage equipment market is expected to grow at a 9.0% CAGR between 2025 and 2035.
The key product types in automotive garage equipment market are light vehicles (passenger cars, suvs), heavy-duty vehicles (trucks, buses), two-wheelers (motorcycles, scooters) and others (agricultural equipment, off-road vehicles).
In terms of equipment type, vehicle diagnostics & testing (scan tools, emission analyzers, oscilloscopes) segment to command 22.0% share in the automotive garage equipment market in 2025.


Our Research Products

The "Full Research Suite" delivers actionable market intel, deep dives on markets or technologies, so clients act faster, cut risk, and unlock growth.

The Leaderboard benchmarks and ranks top vendors, classifying them as Established Leaders, Leading Challengers, or Disruptors & Challengers.

Locates where complements amplify value and substitutes erode it, forecasting net impact by horizon

We deliver granular, decision-grade intel: market sizing, 5-year forecasts, pricing, adoption, usage, revenue, and operational KPIs—plus competitor tracking, regulation, and value chains—across 60 countries broadly.

Spot the shifts before they hit your P&L. We track inflection points, adoption curves, pricing moves, and ecosystem plays to show where demand is heading, why it is changing, and what to do next across high-growth markets and disruptive tech

Real-time reads of user behavior. We track shifting priorities, perceptions of today’s and next-gen services, and provider experience, then pace how fast tech moves from trial to adoption, blending buyer, consumer, and channel inputs with social signals (#WhySwitch, #UX).

Partner with our analyst team to build a custom report designed around your business priorities. From analysing market trends to assessing competitors or crafting bespoke datasets, we tailor insights to your needs.
Supplier Intelligence
Discovery & Profiling
Capacity & Footprint
Performance & Risk
Compliance & Governance
Commercial Readiness
Who Supplies Whom
Scorecards & Shortlists
Playbooks & Docs
Category Intelligence
Definition & Scope
Demand & Use Cases
Cost Drivers
Market Structure
Supply Chain Map
Trade & Policy
Operating Norms
Deliverables
Buyer Intelligence
Account Basics
Spend & Scope
Procurement Model
Vendor Requirements
Terms & Policies
Entry Strategy
Pain Points & Triggers
Outputs
Pricing Analysis
Benchmarks
Trends
Should-Cost
Indexation
Landed Cost
Commercial Terms
Deliverables
Brand Analysis
Positioning & Value Prop
Share & Presence
Customer Evidence
Go-to-Market
Digital & Reputation
Compliance & Trust
KPIs & Gaps
Outputs
Full Research Suite comprises of:
Market outlook & trends analysis
Interviews & case studies
Strategic recommendations
Vendor profiles & capabilities analysis
5-year forecasts
8 regions and 60+ country-level data splits
Market segment data splits
12 months of continuous data updates
DELIVERED AS:
PDF EXCEL ONLINE
Garage Equipment Market Forecast and Outlook 2025 to 2035
Automotive Test Equipment Market Size and Share Forecast Outlook 2025 to 2035
Garage Body Shop Equipment Market Size and Share Forecast Outlook 2025 to 2035
Automotive Manufacturing Equipment Market Size and Share Forecast Outlook 2025 to 2035
Automotive Emission Test Equipment Market Size and Share Forecast Outlook 2025 to 2035
Automotive Direct Liquid Cooling IGBT Module Market Size and Share Forecast Outlook 2025 to 2035
Automotive Hoses and Assemblies Market Size and Share Forecast Outlook 2025 to 2035
Automotive Network Testing Market Size and Share Forecast Outlook 2025 to 2035
Automotive Performance Part Market Size and Share Forecast Outlook 2025 to 2035
Automotive Carbon Ceramic Brake Market Size and Share Forecast Outlook 2025 to 2035
Automotive Camshaft Market Size and Share Forecast Outlook 2025 to 2035
Automotive Stamping Industry Analysis in India Size and Share Forecast Outlook 2025 to 2035
Automotive Cylinder Liner Market Size and Share Forecast Outlook 2025 to 2035
Automotive Microcontroller Market Size and Share Forecast Outlook 2025 to 2035
Automotive Roof Rails Market Size and Share Forecast Outlook 2025 to 2035
Automotive Active Safety System Market Size and Share Forecast Outlook 2025 to 2035
Automotive Diagnostic Scan Tool Market Size and Share Forecast Outlook 2025 to 2035
Automotive Dynamic Map Data Market Size and Share Forecast Outlook 2025 to 2035
Automotive Green Tires Market Size and Share Forecast Outlook 2025 to 2035
Automotive E-Tailing Market Size and Share Forecast Outlook 2025 to 2035

Thank you!
You will receive an email from our Business Development Manager. Please be sure to check your SPAM/JUNK folder too.
Chat With
MaRIA