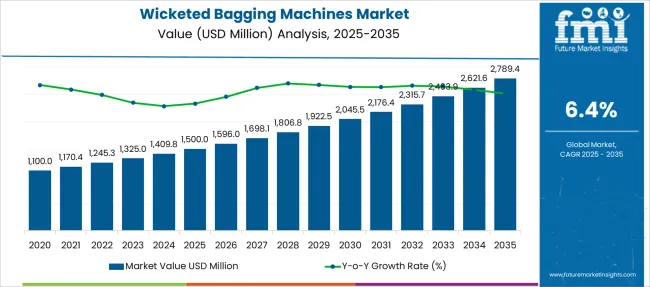
The demand in the global wicketed bagging machines market is estimated to exhibit growth at a CAGR of nearly 4% to 5% during the assessment period 2022 to 2032. On account of growing advancements in technologies and the increasing introduction of novel bio-plastics, the sales of wicketed bagging machines are expected to rise at a robust pace in the forthcoming years.
Report Attribute | Details |
---|---|
Wicketed Bagging Machines Market Projected Growth Rate (2022 to 2032) | 4% to 5% CAGR |
Wicketed bags are a type of packaging solution made of plastic resins that are held together on a thin wicket (or metal bar), making product dispensing easier and faster. Wicketed bagging machines are industrial equipment designed to automatically or semi-automatically open, fill and seal pre-made wicketed bags.
Wicketed bagging machines are garnering huge popularity across various industries, on account of their robust packaging features and ability to work with bags of different sizes at different operating speeds.
Attributed to this, these industrial equipment are finding a plethora of applications across sectors such as bakery, confectionery, animal feed, agrochemicals, personal care & cosmetics, pharmaceuticals, processed food, and others. Hence, the rising expansion of these sectors and accelerating usage in packaging wheat, rice, corn, pulses, seeds, and other grains are projected to augment the demand for wicketed bagging machines in the global market.
Also, there is a rapid surge in the trend of industrialization and the adoption of process automation technologies across the globe. Hence, numerous leading food & beverage & packaging industry players are focusing on adopting automated equipment such as wicketed bagging machines for increasing productivity, declining packaging time, and faster dispensing of products. This is anticipated to create remunerative opportunities for growth in the wicketed bagging machines market share.
Implementation of stringent regulations by a number of governmental and environmental protection agencies concerning the use of plastic packaging solutions is restraining the growth in the global wicketed bagging machines market.
Also, the high initiation cost and cost of maintenance of this industrial equipment are primary factors impeding the sales of wicketed bagging machines in the global market.
As per FMI, South Asia is forecast to exhibit growth at a rapid CAGR in the global wicketed bagging machines market between 2022 and 2032.
Governments in several countries in focusing on undertaking numerous initiatives for the adoption of process automation technologies for increasing overall productivity. For instance, the Ministry of Heavy Industries & Public Enterprises in India announced the introduction of Samarth Udyog Bharat 4.0 initiatives for the augmenting implementation of process automation. The increasing launch of such initiatives is estimated to bolster the sales of wicketed bagging machines in the market.
Also, rising demand for wicketed bag packaging, owing to the rapidly expanding e-commerce sector is estimated to further bolster the growth in the South Asia market.
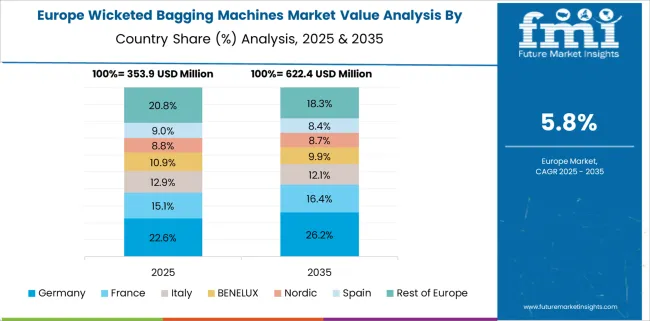
Europe is anticipated to emerge as a highly opportunistic market for wicketed bagging machines from 2022 to 2032, states Future Market Insights.
Prominent players in the market are emphasizing on introducing novel products with innovative features to capitalize on the growing demand for packaging equipment.
For instance, NEWTEC, a Belgium-based manufacturer of high-quality weighing, packaging, and sorting machinery recently announced the launching of its new machine for packaging pre-made wicketed bags for citrus and similar fruits with a capacity to work on up to 50 bags per min. A multiplicity of such new product launches is expected to bolster the growth in the Europe market.
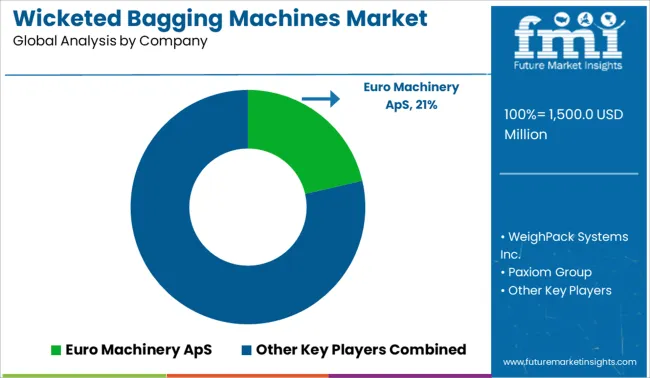
Some of the leading players in the global wicketed bagging machines market are Euro Machinery ApS, WeighPack Systems Inc., Paxiom Group, Robert Bosch GmbH, M.A. Industria Macchine Automatiche SpA, NEWTEC, and others.
Leading wicketed bagging machine manufacturers in the market are focusing on launching equipment with innovative features and mergers & acquisitions to increase their share in the highly competitive market.
Report Attribute | Details |
---|---|
Growth Rate | CAGR of 4% to 5% from 2022 to 2032 |
Base Year for Estimation | 2021 |
Historical Data | 2015 to 2020 |
Forecast Period | 2022 to 2032 |
Quantitative Units | Revenue in USD Billion, Volume in Kilotons, and CAGR from 2022 to 2032 |
Report Coverage | Revenue Forecast, Volume Forecast, Company Ranking, Competitive Landscape, Growth Factors, Trends, and Pricing Analysis |
Segments Covered | Automation Type, Machine Type, Machine Speed, End Use, Region |
Countries Covered | North America, Latin America, Europe, East Asia, South Asia, Oceania, Middle East and Africa |
Key Companies Profiled | Euro Machinery ApS; WeighPack Systems Inc.; Paxiom Group; Robert Bosch GmbH; M.A. Industria Macchine Automatiche SpA; NEWTEC; Others |
Customization | Available Upon Request |
Table 1: Global Market Value (US$ Million) Forecast by Region, 2017 to 2032
Table 2: Global Market Volume (Units) Forecast by Region, 2017 to 2032
Table 3: Global Market Value (US$ Million) Forecast by Automation Type, 2017 to 2032
Table 4: Global Market Volume (Units) Forecast by Automation Type, 2017 to 2032
Table 5: Global Market Value (US$ Million) Forecast by Machine Type, 2017 to 2032
Table 6: Global Market Volume (Units) Forecast by Machine Type, 2017 to 2032
Table 7: Global Market Value (US$ Million) Forecast by Machine Speed, 2017 to 2032
Table 8: Global Market Volume (Units) Forecast by Machine Speed, 2017 to 2032
Table 9: Global Market Value (US$ Million) Forecast by End Use, 2017 to 2032
Table 10: Global Market Volume (Units) Forecast by End Use, 2017 to 2032
Table 11: North America Market Value (US$ Million) Forecast by Country, 2017 to 2032
Table 12: North America Market Volume (Units) Forecast by Country, 2017 to 2032
Table 13: North America Market Value (US$ Million) Forecast by Automation Type, 2017 to 2032
Table 14: North America Market Volume (Units) Forecast by Automation Type, 2017 to 2032
Table 15: North America Market Value (US$ Million) Forecast by Machine Type, 2017 to 2032
Table 16: North America Market Volume (Units) Forecast by Machine Type, 2017 to 2032
Table 17: North America Market Value (US$ Million) Forecast by Machine Speed, 2017 to 2032
Table 18: North America Market Volume (Units) Forecast by Machine Speed, 2017 to 2032
Table 19: North America Market Value (US$ Million) Forecast by End Use, 2017 to 2032
Table 20: North America Market Volume (Units) Forecast by End Use, 2017 to 2032
Table 21: Latin America Market Value (US$ Million) Forecast by Country, 2017 to 2032
Table 22: Latin America Market Volume (Units) Forecast by Country, 2017 to 2032
Table 23: Latin America Market Value (US$ Million) Forecast by Automation Type, 2017 to 2032
Table 24: Latin America Market Volume (Units) Forecast by Automation Type, 2017 to 2032
Table 25: Latin America Market Value (US$ Million) Forecast by Machine Type, 2017 to 2032
Table 26: Latin America Market Volume (Units) Forecast by Machine Type, 2017 to 2032
Table 27: Latin America Market Value (US$ Million) Forecast by Machine Speed, 2017 to 2032
Table 28: Latin America Market Volume (Units) Forecast by Machine Speed, 2017 to 2032
Table 29: Latin America Market Value (US$ Million) Forecast by End Use, 2017 to 2032
Table 30: Latin America Market Volume (Units) Forecast by End Use, 2017 to 2032
Table 31: Europe Market Value (US$ Million) Forecast by Country, 2017 to 2032
Table 32: Europe Market Volume (Units) Forecast by Country, 2017 to 2032
Table 33: Europe Market Value (US$ Million) Forecast by Automation Type, 2017 to 2032
Table 34: Europe Market Volume (Units) Forecast by Automation Type, 2017 to 2032
Table 35: Europe Market Value (US$ Million) Forecast by Machine Type, 2017 to 2032
Table 36: Europe Market Volume (Units) Forecast by Machine Type, 2017 to 2032
Table 37: Europe Market Value (US$ Million) Forecast by Machine Speed, 2017 to 2032
Table 38: Europe Market Volume (Units) Forecast by Machine Speed, 2017 to 2032
Table 39: Europe Market Value (US$ Million) Forecast by End Use, 2017 to 2032
Table 40: Europe Market Volume (Units) Forecast by End Use, 2017 to 2032
Table 41: Asia Pacific Market Value (US$ Million) Forecast by Country, 2017 to 2032
Table 42: Asia Pacific Market Volume (Units) Forecast by Country, 2017 to 2032
Table 43: Asia Pacific Market Value (US$ Million) Forecast by Automation Type, 2017 to 2032
Table 44: Asia Pacific Market Volume (Units) Forecast by Automation Type, 2017 to 2032
Table 45: Asia Pacific Market Value (US$ Million) Forecast by Machine Type, 2017 to 2032
Table 46: Asia Pacific Market Volume (Units) Forecast by Machine Type, 2017 to 2032
Table 47: Asia Pacific Market Value (US$ Million) Forecast by Machine Speed, 2017 to 2032
Table 48: Asia Pacific Market Volume (Units) Forecast by Machine Speed, 2017 to 2032
Table 49: Asia Pacific Market Value (US$ Million) Forecast by End Use, 2017 to 2032
Table 50: Asia Pacific Market Volume (Units) Forecast by End Use, 2017 to 2032
Table 51: Middle East and Africa Market Value (US$ Million) Forecast by Country, 2017 to 2032
Table 52: Middle East and Africa Market Volume (Units) Forecast by Country, 2017 to 2032
Table 53: Middle East and Africa Market Value (US$ Million) Forecast by Automation Type, 2017 to 2032
Table 54: Middle East and Africa Market Volume (Units) Forecast by Automation Type, 2017 to 2032
Table 55: Middle East and Africa Market Value (US$ Million) Forecast by Machine Type, 2017 to 2032
Table 56: Middle East and Africa Market Volume (Units) Forecast by Machine Type, 2017 to 2032
Table 57: Middle East and Africa Market Value (US$ Million) Forecast by Machine Speed, 2017 to 2032
Table 58: Middle East and Africa Market Volume (Units) Forecast by Machine Speed, 2017 to 2032
Table 59: Middle East and Africa Market Value (US$ Million) Forecast by End Use, 2017 to 2032
Table 60: Middle East and Africa Market Volume (Units) Forecast by End Use, 2017 to 2032
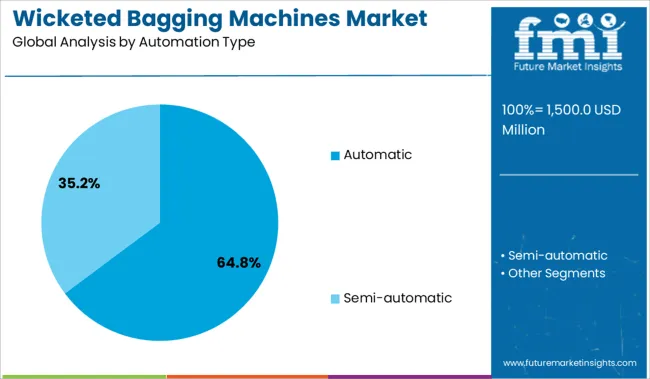
Figure 1: Global Market Value (US$ Million) by Automation Type, 2022 to 2032
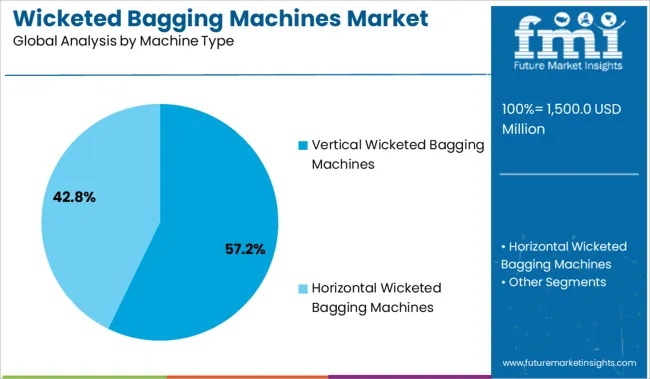
Figure 2: Global Market Value (US$ Million) by Machine Type, 2022 to 2032
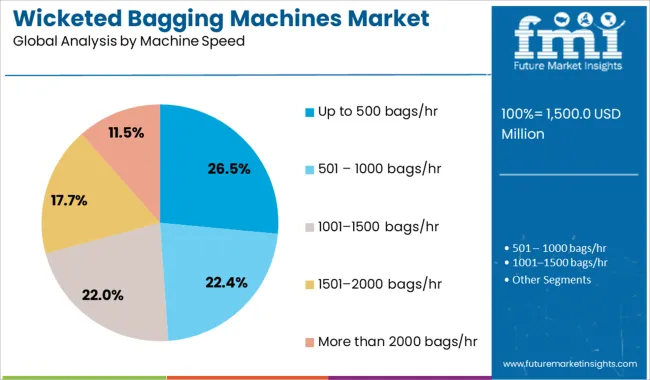
Figure 3: Global Market Value (US$ Million) by Machine Speed, 2022 to 2032
Figure 4: Global Market Value (US$ Million) by End Use, 2022 to 2032
Figure 5: Global Market Value (US$ Million) by Region, 2022 to 2032
Figure 6: Global Market Value (US$ Million) Analysis by Region, 2017 to 2032
Figure 7: Global Market Volume (Units) Analysis by Region, 2017 to 2032
Figure 8: Global Market Value Share (%) and BPS Analysis by Region, 2022 to 2032
Figure 9: Global Market Y-o-Y Growth (%) Projections by Region, 2022 to 2032
Figure 10: Global Market Value (US$ Million) Analysis by Automation Type, 2017 to 2032
Figure 11: Global Market Volume (Units) Analysis by Automation Type, 2017 to 2032
Figure 12: Global Market Value Share (%) and BPS Analysis by Automation Type, 2022 to 2032
Figure 13: Global Market Y-o-Y Growth (%) Projections by Automation Type, 2022 to 2032
Figure 14: Global Market Value (US$ Million) Analysis by Machine Type, 2017 to 2032
Figure 15: Global Market Volume (Units) Analysis by Machine Type, 2017 to 2032
Figure 16: Global Market Value Share (%) and BPS Analysis by Machine Type, 2022 to 2032
Figure 17: Global Market Y-o-Y Growth (%) Projections by Machine Type, 2022 to 2032
Figure 18: Global Market Value (US$ Million) Analysis by Machine Speed, 2017 to 2032
Figure 19: Global Market Volume (Units) Analysis by Machine Speed, 2017 to 2032
Figure 20: Global Market Value Share (%) and BPS Analysis by Machine Speed, 2022 to 2032
Figure 21: Global Market Y-o-Y Growth (%) Projections by Machine Speed, 2022 to 2032
Figure 22: Global Market Value (US$ Million) Analysis by End Use, 2017 to 2032
Figure 23: Global Market Volume (Units) Analysis by End Use, 2017 to 2032
Figure 24: Global Market Value Share (%) and BPS Analysis by End Use, 2022 to 2032
Figure 25: Global Market Y-o-Y Growth (%) Projections by End Use, 2022 to 2032
Figure 26: Global Market Attractiveness by Automation Type, 2022 to 2032
Figure 27: Global Market Attractiveness by Machine Type, 2022 to 2032
Figure 28: Global Market Attractiveness by Machine Speed, 2022 to 2032
Figure 29: Global Market Attractiveness by End Use, 2022 to 2032
Figure 30: Global Market Attractiveness by Region, 2022 to 2032
Figure 31: North America Market Value (US$ Million) by Automation Type, 2022 to 2032
Figure 32: North America Market Value (US$ Million) by Machine Type, 2022 to 2032
Figure 33: North America Market Value (US$ Million) by Machine Speed, 2022 to 2032
Figure 34: North America Market Value (US$ Million) by End Use, 2022 to 2032
Figure 35: North America Market Value (US$ Million) by Country, 2022 to 2032
Figure 36: North America Market Value (US$ Million) Analysis by Country, 2017 to 2032
Figure 37: North America Market Volume (Units) Analysis by Country, 2017 to 2032
Figure 38: North America Market Value Share (%) and BPS Analysis by Country, 2022 to 2032
Figure 39: North America Market Y-o-Y Growth (%) Projections by Country, 2022 to 2032
Figure 40: North America Market Value (US$ Million) Analysis by Automation Type, 2017 to 2032
Figure 41: North America Market Volume (Units) Analysis by Automation Type, 2017 to 2032
Figure 42: North America Market Value Share (%) and BPS Analysis by Automation Type, 2022 to 2032
Figure 43: North America Market Y-o-Y Growth (%) Projections by Automation Type, 2022 to 2032
Figure 44: North America Market Value (US$ Million) Analysis by Machine Type, 2017 to 2032
Figure 45: North America Market Volume (Units) Analysis by Machine Type, 2017 to 2032
Figure 46: North America Market Value Share (%) and BPS Analysis by Machine Type, 2022 to 2032
Figure 47: North America Market Y-o-Y Growth (%) Projections by Machine Type, 2022 to 2032
Figure 48: North America Market Value (US$ Million) Analysis by Machine Speed, 2017 to 2032
Figure 49: North America Market Volume (Units) Analysis by Machine Speed, 2017 to 2032
Figure 50: North America Market Value Share (%) and BPS Analysis by Machine Speed, 2022 to 2032
Figure 51: North America Market Y-o-Y Growth (%) Projections by Machine Speed, 2022 to 2032
Figure 52: North America Market Value (US$ Million) Analysis by End Use, 2017 to 2032
Figure 53: North America Market Volume (Units) Analysis by End Use, 2017 to 2032
Figure 54: North America Market Value Share (%) and BPS Analysis by End Use, 2022 to 2032
Figure 55: North America Market Y-o-Y Growth (%) Projections by End Use, 2022 to 2032
Figure 56: North America Market Attractiveness by Automation Type, 2022 to 2032
Figure 57: North America Market Attractiveness by Machine Type, 2022 to 2032
Figure 58: North America Market Attractiveness by Machine Speed, 2022 to 2032
Figure 59: North America Market Attractiveness by End Use, 2022 to 2032
Figure 60: North America Market Attractiveness by Country, 2022 to 2032
Figure 61: Latin America Market Value (US$ Million) by Automation Type, 2022 to 2032
Figure 62: Latin America Market Value (US$ Million) by Machine Type, 2022 to 2032
Figure 63: Latin America Market Value (US$ Million) by Machine Speed, 2022 to 2032
Figure 64: Latin America Market Value (US$ Million) by End Use, 2022 to 2032
Figure 65: Latin America Market Value (US$ Million) by Country, 2022 to 2032
Figure 66: Latin America Market Value (US$ Million) Analysis by Country, 2017 to 2032
Figure 67: Latin America Market Volume (Units) Analysis by Country, 2017 to 2032
Figure 68: Latin America Market Value Share (%) and BPS Analysis by Country, 2022 to 2032
Figure 69: Latin America Market Y-o-Y Growth (%) Projections by Country, 2022 to 2032
Figure 70: Latin America Market Value (US$ Million) Analysis by Automation Type, 2017 to 2032
Figure 71: Latin America Market Volume (Units) Analysis by Automation Type, 2017 to 2032
Figure 72: Latin America Market Value Share (%) and BPS Analysis by Automation Type, 2022 to 2032
Figure 73: Latin America Market Y-o-Y Growth (%) Projections by Automation Type, 2022 to 2032
Figure 74: Latin America Market Value (US$ Million) Analysis by Machine Type, 2017 to 2032
Figure 75: Latin America Market Volume (Units) Analysis by Machine Type, 2017 to 2032
Figure 76: Latin America Market Value Share (%) and BPS Analysis by Machine Type, 2022 to 2032
Figure 77: Latin America Market Y-o-Y Growth (%) Projections by Machine Type, 2022 to 2032
Figure 78: Latin America Market Value (US$ Million) Analysis by Machine Speed, 2017 to 2032
Figure 79: Latin America Market Volume (Units) Analysis by Machine Speed, 2017 to 2032
Figure 80: Latin America Market Value Share (%) and BPS Analysis by Machine Speed, 2022 to 2032
Figure 81: Latin America Market Y-o-Y Growth (%) Projections by Machine Speed, 2022 to 2032
Figure 82: Latin America Market Value (US$ Million) Analysis by End Use, 2017 to 2032
Figure 83: Latin America Market Volume (Units) Analysis by End Use, 2017 to 2032
Figure 84: Latin America Market Value Share (%) and BPS Analysis by End Use, 2022 to 2032
Figure 85: Latin America Market Y-o-Y Growth (%) Projections by End Use, 2022 to 2032
Figure 86: Latin America Market Attractiveness by Automation Type, 2022 to 2032
Figure 87: Latin America Market Attractiveness by Machine Type, 2022 to 2032
Figure 88: Latin America Market Attractiveness by Machine Speed, 2022 to 2032
Figure 89: Latin America Market Attractiveness by End Use, 2022 to 2032
Figure 90: Latin America Market Attractiveness by Country, 2022 to 2032
Figure 91: Europe Market Value (US$ Million) by Automation Type, 2022 to 2032
Figure 92: Europe Market Value (US$ Million) by Machine Type, 2022 to 2032
Figure 93: Europe Market Value (US$ Million) by Machine Speed, 2022 to 2032
Figure 94: Europe Market Value (US$ Million) by End Use, 2022 to 2032
Figure 95: Europe Market Value (US$ Million) by Country, 2022 to 2032
Figure 96: Europe Market Value (US$ Million) Analysis by Country, 2017 to 2032
Figure 97: Europe Market Volume (Units) Analysis by Country, 2017 to 2032
Figure 98: Europe Market Value Share (%) and BPS Analysis by Country, 2022 to 2032
Figure 99: Europe Market Y-o-Y Growth (%) Projections by Country, 2022 to 2032
Figure 100: Europe Market Value (US$ Million) Analysis by Automation Type, 2017 to 2032
Figure 101: Europe Market Volume (Units) Analysis by Automation Type, 2017 to 2032
Figure 102: Europe Market Value Share (%) and BPS Analysis by Automation Type, 2022 to 2032
Figure 103: Europe Market Y-o-Y Growth (%) Projections by Automation Type, 2022 to 2032
Figure 104: Europe Market Value (US$ Million) Analysis by Machine Type, 2017 to 2032
Figure 105: Europe Market Volume (Units) Analysis by Machine Type, 2017 to 2032
Figure 106: Europe Market Value Share (%) and BPS Analysis by Machine Type, 2022 to 2032
Figure 107: Europe Market Y-o-Y Growth (%) Projections by Machine Type, 2022 to 2032
Figure 108: Europe Market Value (US$ Million) Analysis by Machine Speed, 2017 to 2032
Figure 109: Europe Market Volume (Units) Analysis by Machine Speed, 2017 to 2032
Figure 110: Europe Market Value Share (%) and BPS Analysis by Machine Speed, 2022 to 2032
Figure 111: Europe Market Y-o-Y Growth (%) Projections by Machine Speed, 2022 to 2032
Figure 112: Europe Market Value (US$ Million) Analysis by End Use, 2017 to 2032
Figure 113: Europe Market Volume (Units) Analysis by End Use, 2017 to 2032
Figure 114: Europe Market Value Share (%) and BPS Analysis by End Use, 2022 to 2032
Figure 115: Europe Market Y-o-Y Growth (%) Projections by End Use, 2022 to 2032
Figure 116: Europe Market Attractiveness by Automation Type, 2022 to 2032
Figure 117: Europe Market Attractiveness by Machine Type, 2022 to 2032
Figure 118: Europe Market Attractiveness by Machine Speed, 2022 to 2032
Figure 119: Europe Market Attractiveness by End Use, 2022 to 2032
Figure 120: Europe Market Attractiveness by Country, 2022 to 2032
Figure 121: Asia Pacific Market Value (US$ Million) by Automation Type, 2022 to 2032
Figure 122: Asia Pacific Market Value (US$ Million) by Machine Type, 2022 to 2032
Figure 123: Asia Pacific Market Value (US$ Million) by Machine Speed, 2022 to 2032
Figure 124: Asia Pacific Market Value (US$ Million) by End Use, 2022 to 2032
Figure 125: Asia Pacific Market Value (US$ Million) by Country, 2022 to 2032
Figure 126: Asia Pacific Market Value (US$ Million) Analysis by Country, 2017 to 2032
Figure 127: Asia Pacific Market Volume (Units) Analysis by Country, 2017 to 2032
Figure 128: Asia Pacific Market Value Share (%) and BPS Analysis by Country, 2022 to 2032
Figure 129: Asia Pacific Market Y-o-Y Growth (%) Projections by Country, 2022 to 2032
Figure 130: Asia Pacific Market Value (US$ Million) Analysis by Automation Type, 2017 to 2032
Figure 131: Asia Pacific Market Volume (Units) Analysis by Automation Type, 2017 to 2032
Figure 132: Asia Pacific Market Value Share (%) and BPS Analysis by Automation Type, 2022 to 2032
Figure 133: Asia Pacific Market Y-o-Y Growth (%) Projections by Automation Type, 2022 to 2032
Figure 134: Asia Pacific Market Value (US$ Million) Analysis by Machine Type, 2017 to 2032
Figure 135: Asia Pacific Market Volume (Units) Analysis by Machine Type, 2017 to 2032
Figure 136: Asia Pacific Market Value Share (%) and BPS Analysis by Machine Type, 2022 to 2032
Figure 137: Asia Pacific Market Y-o-Y Growth (%) Projections by Machine Type, 2022 to 2032
Figure 138: Asia Pacific Market Value (US$ Million) Analysis by Machine Speed, 2017 to 2032
Figure 139: Asia Pacific Market Volume (Units) Analysis by Machine Speed, 2017 to 2032
Figure 140: Asia Pacific Market Value Share (%) and BPS Analysis by Machine Speed, 2022 to 2032
Figure 141: Asia Pacific Market Y-o-Y Growth (%) Projections by Machine Speed, 2022 to 2032
Figure 142: Asia Pacific Market Value (US$ Million) Analysis by End Use, 2017 to 2032
Figure 143: Asia Pacific Market Volume (Units) Analysis by End Use, 2017 to 2032
Figure 144: Asia Pacific Market Value Share (%) and BPS Analysis by End Use, 2022 to 2032
Figure 145: Asia Pacific Market Y-o-Y Growth (%) Projections by End Use, 2022 to 2032
Figure 146: Asia Pacific Market Attractiveness by Automation Type, 2022 to 2032
Figure 147: Asia Pacific Market Attractiveness by Machine Type, 2022 to 2032
Figure 148: Asia Pacific Market Attractiveness by Machine Speed, 2022 to 2032
Figure 149: Asia Pacific Market Attractiveness by End Use, 2022 to 2032
Figure 150: Asia Pacific Market Attractiveness by Country, 2022 to 2032
Figure 151: Middle East and Africa Market Value (US$ Million) by Automation Type, 2022 to 2032
Figure 152: Middle East and Africa Market Value (US$ Million) by Machine Type, 2022 to 2032
Figure 153: Middle East and Africa Market Value (US$ Million) by Machine Speed, 2022 to 2032
Figure 154: Middle East and Africa Market Value (US$ Million) by End Use, 2022 to 2032
Figure 155: Middle East and Africa Market Value (US$ Million) by Country, 2022 to 2032
Figure 156: Middle East and Africa Market Value (US$ Million) Analysis by Country, 2017 to 2032
Figure 157: Middle East and Africa Market Volume (Units) Analysis by Country, 2017 to 2032
Figure 158: Middle East and Africa Market Value Share (%) and BPS Analysis by Country, 2022 to 2032
Figure 159: Middle East and Africa Market Y-o-Y Growth (%) Projections by Country, 2022 to 2032
Figure 160: Middle East and Africa Market Value (US$ Million) Analysis by Automation Type, 2017 to 2032
Figure 161: Middle East and Africa Market Volume (Units) Analysis by Automation Type, 2017 to 2032
Figure 162: Middle East and Africa Market Value Share (%) and BPS Analysis by Automation Type, 2022 to 2032
Figure 163: Middle East and Africa Market Y-o-Y Growth (%) Projections by Automation Type, 2022 to 2032
Figure 164: Middle East and Africa Market Value (US$ Million) Analysis by Machine Type, 2017 to 2032
Figure 165: Middle East and Africa Market Volume (Units) Analysis by Machine Type, 2017 to 2032
Figure 166: Middle East and Africa Market Value Share (%) and BPS Analysis by Machine Type, 2022 to 2032
Figure 167: Middle East and Africa Market Y-o-Y Growth (%) Projections by Machine Type, 2022 to 2032
Figure 168: Middle East and Africa Market Value (US$ Million) Analysis by Machine Speed, 2017 to 2032
Figure 169: Middle East and Africa Market Volume (Units) Analysis by Machine Speed, 2017 to 2032
Figure 170: Middle East and Africa Market Value Share (%) and BPS Analysis by Machine Speed, 2022 to 2032
Figure 171: Middle East and Africa Market Y-o-Y Growth (%) Projections by Machine Speed, 2022 to 2032
Figure 172: Middle East and Africa Market Value (US$ Million) Analysis by End Use, 2017 to 2032
Figure 173: Middle East and Africa Market Volume (Units) Analysis by End Use, 2017 to 2032
Figure 174: Middle East and Africa Market Value Share (%) and BPS Analysis by End Use, 2022 to 2032
Figure 175: Middle East and Africa Market Y-o-Y Growth (%) Projections by End Use, 2022 to 2032
Figure 176: Middle East and Africa Market Attractiveness by Automation Type, 2022 to 2032
Figure 177: Middle East and Africa Market Attractiveness by Machine Type, 2022 to 2032
Figure 178: Middle East and Africa Market Attractiveness by Machine Speed, 2022 to 2032
Figure 179: Middle East and Africa Market Attractiveness by End Use, 2022 to 2032
Figure 180: Middle East and Africa Market Attractiveness by Country, 2022 to 2032
FMI projects the sales of wicketed bagging machines in the market are expected to rise at 4% to 5% value CAGR by 2032.
The global wicketed bagging machines market is anticipated to be dominated by South Asia over the forecast period 2022 to 2032.
Euro Machinery ApS, WeighPack Systems Inc., Paxiom Group, Robert Bosch GmbH, M.A. Industria Macchine Automatiche SpA, NEWTEC, and others are some of the leading players in the global wicketed bagging machines market.
Explore Similar Insights
Thank you!
You will receive an email from our Business Development Manager. Please be sure to check your SPAM/JUNK folder too.