Anaesthesia Machines Market
Market Survey on Anaesthesia Machines Market Covering Sales Outlook, Up-to-date Key Trends, Market Size and Forecast, Per Capita Expenditure, Company Share, Brand Share, Regulations, Reimbursement Scenario, Epidemiology, Procedure Numbers, and Pipeline Assessment
An In-depth Market Insights of Anaesthesia Machines Market including Standalone Anaesthesia Machines, and Portable Anaesthesia Machines Covering 30+ Countries like United States, United Kingdom, Germany, France, Norway, Sweden, Saudi Arabia, United Arab Emirates, Japan, Korea, Australia, New Zealand, and Others
Introduction
Anaesthesia machines are used to administrate anaesthesia to patients during medical procedure. These machines are installed in ambulatory surgical centres, hospitals, clinics and other nursing facilities. Anaesthesia machines include various mechanical, computer controlled and electrical components to regulate and control general anaesthesia administration.
Continuous developments have been observed in designing of anaesthesia machines with a view to enhance operating efficiency, patient safety, outcome and convenience. Market players are focusing on new product development and launching of innovative products with additional features and capabilities.
A resourceful research report on global anaesthesia machines market by Future Market Insights reflects the value trajectory of the global market for a period of ten years, from 2017 till 2027. The research report includes value analysis on various segments of the market and their respective scenarios across key regions in the globe.
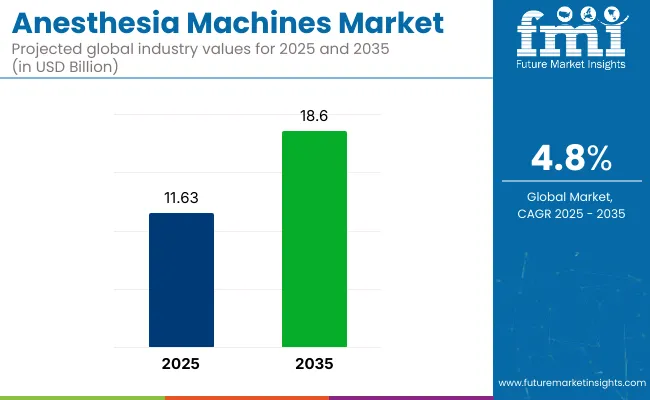
As per this analytical research study, the global market for anaesthesia machines is projected to expand at a CAGR of 5.7% throughout the period of assessment (2017-2027). In 2017, the global anaesthesia machines market was valued at about US$ 1400 Mn and is estimated to reach a valuation of more than US$ 2.4 Bn by the end of the year of assessment (2027).
Don't pay for what you don't need
Customize your report by selecting specific countries or regions and save 30%!
How The Market Progressed Till June 2022?
Particulars | Details |
---|---|
H1, 2021 |
6.35% |
H1, 2022 Projected |
6.53% |
H1, 2022 Outlook |
6.23% |
BPS Change - H1, 2022 (O) – H1, 2022 (P) |
(-) 30 ↓ |
BPS Change – H1, 2022 (O) – H1, 2021 |
(-) 12 ↓ |
The variation between the BPS values observed within this market in H1, 2022 - outlook over H1, 2022 projected reflects a decline of 30 units. A decline in BPS value in H1-2022 over H1-2021 by 12 Basis Point Share (BPS) is demonstrated by the market.
The above variations in BPS change were predicted based on comparative analysis for the dynamics of anaesthesia machines, which are principally subjected to an array of industry, macroeconomic and regulatory variables.
The market for anaesthesia machines is constrained in its expansion by high maintenance and installation costs as well as adverse effects from anaesthetic overdose. An additional barrier to the market is the possibility of contamination brought on by the usage of these devices during surgical procedures due to an increased risk of bacterial infections.
However, continuous developments have been observed in designing of anaesthesia machines with a view to enhance operating efficiency, patient safety, outcome and convenience. Market players are focusing on new product development and launching of innovative products with additional features and capabilities such as integration of technologies to automate management tasks and remote monitoring of cases.
Thus, improving patient care and decreasing financial oversight on the healthcare facilities, ultimately resulting in improved growth prospect of the anaesthesia machines market in the forecast duration.
Reduction in the cost of anaesthesia machines coupled with innovations and development can improve sales
As compared to international players, regional or domestic market players sell their products at a relatively low price. This aspect makes it imperative for market leaders to gauge the pricing scenario in the respective region in order to gain successful penetration in that regional market. Increasing investments in research and development to develop cost effective and at the same time innovative anaesthesia solutions is expected to provide high growth opportunities for players in this market with respect to sales volume of their products in the local as well as international markets.
Anaesthesia machines to witness increased adoption in hospitals in the coming years
Anaesthesia machines are widely used in several healthcare and nursing facilities such as hospitals, ambulatory surgical centres and clinics. Both small and large size hospitals have included advanced anaesthesia machines to deal with day to day surgical procedures. Several manufacturers are targeting hospitals for sale of their devices owing to increasing use of these machines in various surgical procedures. Multi functionality hospitals deal with various surgical procedures every day which increases the use of anaesthesia machines.
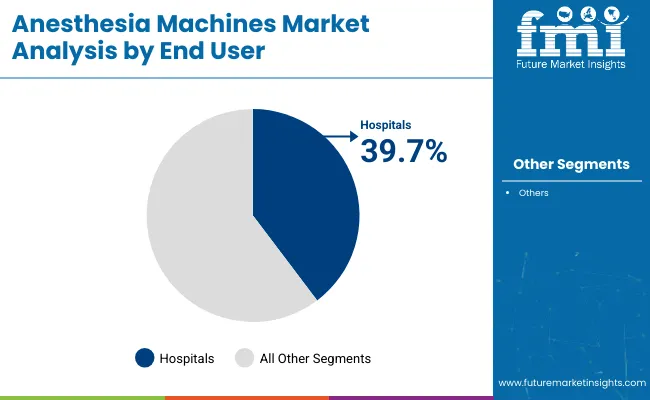
In the end user category, the hospital segment is the most lucrative from sales point of view. This segment led the global market in 2017 and is expected to continue with its dominating streak in the coming years. This fact is backed up with data presented in this research report, which portrays a high growth potential of this segment by the end of the assessment period.
The hospital segment stood at a value a bit under US$ 740 Mn in 2017 and is estimated to reach a valuation high than US$ 1 Bn by the end of the year of assessment. It is projected to expand at the highest rate compared to other end user segments during the forecast period.
Sales of anaesthesia machines in ambulatory surgical centres to reflect a value of around half a billion by 2027 end
Ambulatory surgical centres in the end user category is expected to be the second most attractive segment. This segment is estimated to reach a valuation a bit over US$ 500 Mn by the end of the year of assessment and projected to grow at a robust rate during the forecast period. Ambulatory surgical centres segment is expected to showcase a market attractive index of 0.9 by the end of the year of assessment. Also, the sales of anaesthesia machines in clinics is expected to contribute to the global market revenue.
Key Segments Covered
By Modality
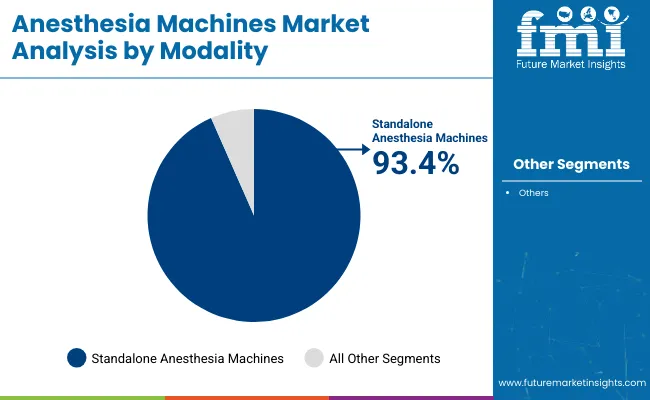
- Standalone Anaesthesia Machines
- Portable Anaesthesia Machines
By End User
- Hospitals
- Surgical Ambulatory Centres
- Clinics
- Nursing Facilities
By Region
- North America
- Latin America
- Western Europe
- Eastern Europe
- Asia Pacific Excluding Japan (APEJ)
- Japan
- Middle East and Africa (MEA)
Get the data you need at a Fraction of the cost
Personalize your report by choosing insights you need
and save 40%!
Table of Content
1. Executive Summary 1.1. Market Overview 1.2. Market Analysis 1.3. FMI Analysis and Recommendations 1.4. Wheel of Fortune 2. Market Introduction 2.1. Market Taxonomy 2.2. Market Definition 3. Market View Point Analysis 3.1. Macro-Economic Factors 3.2. Opportunity Analysis 3.3. Installed Base Scenario 3.4. Reimbursement Landscape 4. North America Market Analysis 2012–2016 and Forecast 2017–2027 4.1. Introduction 4.2. Key Regulations 4.3. Regional Market Dynamics 4.3.1. Drivers 4.3.2. Restraints 4.3.3. Trends 4.4. Historical Market Size (US$ Mn) Analysis By Country, 2012-2016 4.4.1. U.S. 4.4.2. Canada 4.5. Market Size (US$ Mn) Forecast By Country, 2017-2027 4.5.1. U.S. 4.5.2. Canada 4.6. Historical Market Size (US$ Mn) Analysis By Modality, 2012-2016 4.6.1. Standalone Anesthesia Machines 4.6.2. Portable Anesthesia Machines 4.7. Market Size (US$ Mn) Forecast By Modality, 2017-2027 4.7.1. Standalone Anesthesia Machines 4.7.2. Portable Anesthesia Machines 4.8. Historical Market Size (US$ Mn) Analysis By End User, 2012-2016 4.8.1. Hospitals 4.8.2. Ambulatory Surgical Centers 4.8.3. Clinics 4.8.4. Nursing Facilities 4.9. Market Size (US$ Mn) Forecast By End User, 2017-2027 4.9.1. Hospitals 4.9.2. Ambulatory Surgical Centers 4.9.3. Clinics 4.9.4. Nursing Facilities 4.10. Drivers and Restraints: Impact Analysis 4.11. Market Attractiveness Analysis 4.11.1. By Country 4.11.2. By Modality 4.11.3. By End User 4.12. Key Representative Market Participants 4.13. Key Participants Market Presence (Intensity Map) 5. Western Europe Market Analysis 2012–2016 and Forecast 2017–2027 5.1. Introduction 5.2. Key Regulations 5.3. Regional Market Dynamics 5.3.1. Drivers 5.3.2. Restraints 5.3.3. Trends 5.4. Historical Market Size (US$ Mn) Analysis By Country, 2012-2016 5.4.1. Germany 5.4.2. U.K 5.4.3. France 5.4.4. Italy 5.4.5. Spain 5.4.6. Rest of Western Europe 5.5. Market Size (US$ Mn) Forecast By Country, 2017-2027 5.5.1. Germany 5.5.2. U.K 5.5.3. France 5.5.4. Italy 5.5.5. Spain 5.5.6. Rest of Western Europe 5.6. Historical Market Size (US$ Mn) Analysis By Modality, 2012-2016 5.6.1. Standalone Anesthesia Machines 5.6.2. Portable Anesthesia Machines 5.7. Market Size (US$ Mn) Forecast By Modality, 2017-2027 5.7.1. Standalone Anesthesia Machines 5.7.2. Portable Anesthesia Machines 5.8. Historical Market Size (US$ Mn) Analysis By End User, 2012-2016 5.8.1. Hospitals 5.8.2. Ambulatory Surgical Centers 5.8.3. Clinics 5.8.4. Nursing Facilities 5.9. Market Size (US$ Mn) Forecast By End User, 2017-2027 5.9.1. Hospitals 5.9.2. Ambulatory Surgical Centers 5.9.3. Clinics 5.9.4. Nursing Facilities 5.10. Drivers and Restraints: Impact Analysis 5.11. Market Attractiveness Analysis 5.11.1. By Country 5.11.2. By Modality 5.11.3. By End User 5.12. Key Representative Market Participants 5.13. Key Participants Market Presence (Intensity Map) 6. Eastern Europe Market Analysis 2012–2016 and Forecast 2017–2027 6.1. Introduction 6.2. Key Regulations 6.3. Regional Market Dynamics 6.3.1. Drivers 6.3.2. Restraints 6.3.3. Trends 6.4. Historical Market Size (US$ Mn) Analysis By Country, 2012-2016 6.4.1. Russia 6.4.2. Poland 6.4.3. Rest of Eastern Europe 6.5. Market Size (US$ Mn) Forecast By Country, 2017-2027 6.5.1. Russia 6.5.2. Poland 6.5.3. Rest of Eastern Europe 6.6. Historical Market Size (US$ Mn) Analysis By Modality, 2012-2016 6.6.1. Standalone Anesthesia Machines 6.6.2. Portable Anesthesia Machines 6.7. Market Size (US$ Mn) Forecast By Modality, 2017-2027 6.7.1. Standalone Anesthesia Machines 6.7.2. Portable Anesthesia Machines 6.8. Historical Market Size (US$ Mn) Analysis By End User, 2012-2016 6.8.1. Hospitals 6.8.2. Ambulatory Surgical Centers 6.8.3. Clinics 6.8.4. Nursing Facilities 6.9. Market Size (US$ Mn) Forecast By End User, 2017-2027 6.9.1. Hospitals 6.9.2. Ambulatory Surgical Centers 6.9.3. Clinics 6.9.4. Nursing Facilities 6.10. Drivers and Restraints: Impact Analysis 6.11. Market Attractiveness Analysis 6.11.1. By Country 6.11.2. By Modality 6.11.3. By End User 6.12. Key Representative Market Participants 6.13. Key Participants Market Presence (Intensity Map) 7. Latin America Market Analysis 2012–2016 and Forecast 2017–2027 7.1. Introduction 7.2. Key Regulations 7.3. Regional Market Dynamics 7.3.1. Drivers 7.3.2. Restraints 7.3.3. Trends 7.4. Historical Market Size (US$ Mn) Analysis By Country, 2012-2016 7.4.1. Brazil 7.4.2. Mexico 7.4.3. Rest of Latin America 7.5. Market Size (US$ Mn) Forecast By Country, 2017-2027 7.5.1. Brazil 7.5.2. Mexico 7.5.3. Rest of Latin America 7.6. Historical Market Size (US$ Mn) Analysis By Modality, 2012-2016 7.6.1. Standalone Anesthesia Machines 7.6.2. Portable Anesthesia Machines 7.7. Market Size (US$ Mn) Forecast By Modality, 2017-2027 7.7.1. Standalone Anesthesia Machines 7.7.2. Portable Anesthesia Machines 7.8. Historical Market Size (US$ Mn) Analysis By End User, 2012-2016 7.8.1. Hospitals 7.8.2. Ambulatory Surgical Centers 7.8.3. Clinics 7.8.4. Nursing Facilities 7.9. Market Size (US$ Mn) Forecast By End User, 2017-2027 7.9.1. Hospitals 7.9.2. Ambulatory Surgical Centers 7.9.3. Clinics 7.9.4. Nursing Facilities 7.10. Drivers and Restraints: Impact Analysis 7.11. Market Attractiveness Analysis 7.11.1. By Country 7.11.2. By Modality 7.11.3. By End User 7.12. Key Representative Market Participants 7.13. Key Participants Market Presence (Intensity Map) 8. Asia Pacific Excluding Japan Market Analysis 2012–2016 and Forecast 2017–2027 8.1. Introduction 8.2. Key Regulations 8.3. Regional Market Dynamics 8.3.1. Drivers 8.3.2. Restraints 8.3.3. Trends 8.4. Historical Market Size (US$ Mn) Analysis By Country, 2012-2016 8.4.1. China 8.4.2. India 8.4.3. Australia and New Zealand 8.4.4. ASEAN 8.4.5. Rest of APEJ 8.5. Market Size (US$ Mn) Forecast By Country, 2017-2027 8.5.1. China 8.5.2. India 8.5.3. Australia and New Zealand 8.5.4. ASEAN 8.5.5. Rest of APEJ 8.6. Historical Market Size (US$ Mn) Analysis By Modality, 2012-2016 8.6.1. Standalone Anesthesia Machines 8.6.2. Portable Anesthesia Machines 8.7. Market Size (US$ Mn) Forecast By Modality, 2017-2027 8.7.1. Standalone Anesthesia Machines 8.7.2. Portable Anesthesia Machines 8.8. Historical Market Size (US$ Mn) Analysis By End User, 2012-2016 8.8.1. Hospitals 8.8.2. Ambulatory Surgical Centers 8.8.3. Clinics 8.8.4. Nursing Facilities 8.9. Market Size (US$ Mn) Forecast By End User, 2017-2027 8.9.1. Hospitals 8.9.2. Ambulatory Surgical Centers 8.9.3. Clinics 8.9.4. Nursing Facilities 8.10. Drivers and Restraints: Impact Analysis 8.11. Market Attractiveness Analysis 8.11.1. By Country 8.11.2. By Modality 8.11.3. By End User 8.12. Key Representative Market Participants 8.13. Key Participants Market Presence (Intensity Map) 9. Japan Market Analysis 2012–2016 and Forecast 2017–2027 9.1. Introduction 9.2. Key Regulations 9.3. Regional Market Dynamics 9.3.1. Drivers 9.3.2. Restraints 9.3.3. Trends 9.4. Historical Market Size (US$ Mn) Analysis By Modality, 2012-2016 9.4.1. Standalone Anesthesia Machines 9.4.2. Portable Anesthesia Machines 9.5. Market Size (US$ Mn) Forecast By Modality, 2017-2027 9.5.1. Standalone Anesthesia Machines 9.5.2. Portable Anesthesia Machines 9.6. Historical Market Size (US$ Mn) Analysis By End User, 2012-2016 9.6.1. Hospitals 9.6.2. Ambulatory Surgical Centers 9.6.3. Clinics 9.6.4. Nursing Facilities 9.7. Market Size (US$ Mn) Forecast By End User, 2017-2027 9.7.1. Hospitals 9.7.2. Ambulatory Surgical Centers 9.7.3. Clinics 9.7.4. Nursing Facilities 9.8. Drivers and Restraints: Impact Analysis 9.9. Market Attractiveness Analysis 9.9.1. By Modality 9.9.2. By End User 9.10. Key Representative Market Participants 9.11. Key Participants Market Presence (Intensity Map) 10. Middle East and Africa Market Analysis 2012–2016 and Forecast 2017–2027 10.1. Introduction 10.2. Key Regulations 10.3. Regional Market Dynamics 10.3.1. Drivers 10.3.2. Restraints 10.3.3. Trends 10.4. Historical Market Size (US$ Mn) Analysis By Country, 2012-2016 10.4.1. GCC Countries 10.4.2. South Africa 10.4.3. Rest of Middle East and Africa 10.5. Market Size (US$ Mn) Forecast By Country, 2017-2027 10.5.1. GCC Countries 10.5.2. South Africa 10.5.3. Rest of Middle East and Africa 10.6. Historical Market Size (US$ Mn) Analysis By Modality, 2012-2016 10.6.1. Standalone Anesthesia Machines 10.6.2. Portable Anesthesia Machines 10.7. Market Size (US$ Mn) Forecast By Modality, 2017-2027 10.7.1. Standalone Anesthesia Machines 10.7.2. Portable Anesthesia Machines 10.8. Historical Market Size (US$ Mn) Analysis By End User, 2012-2016 10.8.1. Hospitals 10.8.2. Ambulatory Surgical Centers 10.8.3. Clinics 10.8.4. Nursing Facilities 10.9. Market Size (US$ Mn) Forecast By End User, 2017-2027 10.9.1. Hospitals 10.9.2. Ambulatory Surgical Centers 10.9.3. Clinics 10.9.4. Nursing Facilities 10.10. Drivers and Restraints: Impact Analysis 10.11. Market Attractiveness Analysis 10.11.1. By Country 10.11.2. By Modality 10.11.3. By End User 10.12. Key Representative Market Participants 10.13. Key Participants Market Presence (Intensity Map) 11. Forecast Factors: Relevance and Impact 12. Forecast Assumptions 13. Competition Landscape 13.1. Market Structure 13.2. Market Share Analysis 13.3. Competition Dashboard 13.4. Company Profiles (Details – Overview, Financials, Strategy, Recent Developments) 13.4.1. DRE Medical 13.4.2. Maquet Getinge Group 13.4.3. GE Healthcare 13.4.4. Penlon, Inc. 13.4.5. Dragerwerk AG 13.4.6. Mindray Medical International Limited 13.4.7. Spacelabs Healthcare 13.4.8. Philips Healthcare 13.4.9. Narang Medical Limited 13.4.10. Heyer Medical AG 13.4.11. Beijing Yi Shiheng Electronic Technology Co., Ltd. 13.4.12. Beijing Aeonmed Co. Ltd. 13.4.13. Infinium Medical, Inc. 13.4.14. Supera Anesthesia Innovations 13.4.15. Dameca A/S 13.4.16. Comen Medical Instruments Co. Ltd. 13.4.17. Midmark Corp. 13.4.18. Okuman Medical System Ltd. 13.4.19. Chirana Medical a.s. 13.4.20. Lowenstein Medical GmbH & Co. 14. Global Market Analysis 2012–2016 and Forecast 2017–2027 By Region 14.1. Introduction / Key Findings 14.2. Historical Market Size (US$ Mn) Analysis By Region 14.2.1. North America 14.2.2. Western Europe 14.2.3. Eastern Europe 14.2.4. Latin America 14.2.5. Asia Pacific Excluding Japan 14.2.6. Japan 14.2.7. Middle East and Africa 14.3. Market Size (US$ Mn) Forecast By Region 14.3.1. North America 14.3.2. Western Europe 14.3.3. Eastern Europe 14.3.4. Latin America 14.3.5. Asia Pacific Excluding Japan 14.3.6. Japan 14.3.7. Middle East and Africa 14.4. Market Attractiveness Analysis By Region 15. Global Market Analysis 2012–2016 and Forecast 2017–2027, By Modality 15.1. Introduction/Key Finding 15.2. Historical Market Size (US$ Mn) Analysis By Modality, 2012-2016 15.2.1. Standalone Anesthesia Machines 15.2.2. Portable Anesthesia Machines 15.3. Market Size (US$ Mn) Forecast By Modality, 2017-2027 15.3.1. Standalone Anesthesia Machines 15.3.2. Portable Anesthesia Machines 15.4. Key Trends / Developments 15.5. Market Attractiveness Analysis By Modality 16. Global Market Analysis 2012–2016 and Forecast 2017–2027, By End User 16.1. 16.1.Introduction/Key Finding 16.2. 16.2.Historical Market Size (US$ Mn) Analysis By End User, 2012-2016 16.3. 16.2.1. Hospitals 16.4. 16.2.2. Ambulatory Surgical Centers 16.5. 16.2.3. Clinics 16.6. 16.2.4. Nursing Facilities 16.7. 16.3.Market Size (US$ Mn) Forecast By End User, 2017-2027 16.8. 16.3.1. Hospitals 16.9. 16.3.2. Ambulatory Surgical Centers 16.10. 16.3.3. Clinics 16.11. 16.3.4. Nursing Facilities 16.12. 16.4.Market Attractiveness Analysis By Mode of Operation 17. Global Market Analysis 2012–2016 and Forecast 2017–2027 17.1. Market Size and Y-o-Y Growth 17.2. Absolute $ Opportunity 18. Assumptions and Acronyms Used 19. Research Methodology
Don't pay for what you don't need
Customize your report by selecting specific countries or regions and save 30%!
List of Tables
Table 01: North America Market size (US$ Mn) Analysis-2012–2016 and Forecast 2017–2027, By Country Table 02: North America Market size (US$ Mn) Analysis-2012–2016 and Forecast 2017–2027, By Modality Table 03: North America Market Volume (units) Analysis-2012–2016 and Forecast 2017–2027, By Modality Table 04: North America Market size (US$ Mn) Analysis-2012–2016 and Forecast 2017–2027, By End User Table 05: Latin America Market size (US$ Mn) Analysis-2012–2016 and Forecast 2017–2027, By Country Table 06: Latin America Market size (US$ Mn) Analysis-2012–2016 and Forecast 2017–2027, By Modality Table 07: Latin America Market Volume (units) Analysis-2012–2016 and Forecast 2017–2027, By Modality Table 08: Latin America Market size (US$ Mn) Analysis-2012–2016 and Forecast 2017–2027, By End User Table 09: Western Europe Market size (US$ Mn) Analysis-2012–2016 and Forecast 2017–2027, By Country Table 10: Western Europe Market size (US$ Mn) Analysis-2012–2016 and Forecast 2017–2027, By Modality Table 11: Western Europe Market Volume (units) Analysis-2012–2016 and Forecast 2017–2027, By Modality Table 12: Western Europe Market size (US$ Mn) Analysis-2012–2016 and Forecast 2017–2027, By End User Table 13: Eastern Europe Market size (US$ Mn) Analysis-2012–2016 and Forecast 2017–2027, By Country Table 14: Eastern Europe Market size (US$ Mn) Analysis-2012–2016 and Forecast 2017–2027, By Modality Table 15: Eastern Europe Market Volume (units) Analysis-2012–2016 and Forecast 2017–2027, By Modality Table 16: Eastern Europe Market size (US$ Mn) Analysis-2012–2016 and Forecast 2017–2027, By End User Table 17: APEJ Market size (US$ Mn) Analysis-2012–2016 and Forecast 2017–2027, By Country Table 18: APEJ Market size (US$ Mn) Analysis-2012–2016 and Forecast 2017–2027, By Modality Table 19: APEJ Market Volume (units) Analysis-2012–2016 and Forecast 2017–2027, By Modality Table 20: APEJ Market size (US$ Mn) Analysis-2012–2016 and Forecast 2017–2027, By End User Table 21: Japan Market size (US$ Mn) Analysis-2012–2016 and Forecast 2017–2027, By Modality Table 22: Japan Market Volume (units) Analysis-2012–2016 and Forecast 2017–2027, By Modality Table 23: Japan Market size (US$ Mn) Analysis-2012–2016 and Forecast 2017–2027, By End User Table 24: MEA Market size (US$ Mn) Analysis-2012–2016 and Forecast 2017–2027, By Country Table 25: MEA Market size (US$ Mn) Analysis-2012–2016 and Forecast 2017–2027, By Modality Table 26: MEA Market Volume (units) Analysis-2012–2016 and Forecast 2017–2027, By Modality Table 27: MEA Market size (US$ Mn) Analysis-2012–2016 and Forecast 2017–2027, By End User Table 28: Global Market Size (US$ Mn) Forecast By Region, 2012–2017 Table 29: Global Market size Value (US$ Mn) Analysis 2012–2016 and Forecast 2017–2027, By Modality Table 30: Global Market size (US$ Mn) Analysis 2012–2016 and Forecast 2017–2027, By End User Table 31: Japan Market Volume (units) Analysis-2012–2016 and Forecast 2017–2027, By Modality
List of Charts
Figure 01: Global Standalone Anesthesia Machines, Price Difference (US$) By Region, 2016 Figure 02: Global Standalone Anesthesia Machines, Price Difference (US$) By Region, 2027 Figure 03: Global Portable Anesthesia Machine, Price Difference (US$) By Region, 2016 Figure 04: Global Portable Anesthesia Machine, Price Difference (US$) By Region, 2027 Figure 05: North America Market Value Share By Modality (2016) Figure 06: North America Market Value Share By End User (2016) Figure 07: North America Market Value Share By Country (2016) Figure 08: North America Market Size Analysis, 2012–2016 Figure 09: North America Market Forecast & Y-o-Y growth, 2017–2027 Figure 10: U.S. Market Size (US$ Mn) Analysis, 2012–2016 Figure 11: U.S. Market Forecast & Y-o-Y Growth (%), 2017–2025 Figure 12: Canada Market Size (US$ Mn) Analysis, 2012–2016 Figure 13: Canada Market Forecast & Y-o-Y Growth (%), 2017–2025 Figure 14: North America Standalone Market Size (US$ Mn) Analysis, 2012–2016 Figure 15: North America Standalone Market Forecast & Y-o-Y Growth (%), 2017–2025 Figure 16: North America Portable Market Size (US$ Mn) Analysis, 2012–2016 Figure 17: North America Portable Market Forecast & Y-o-Y Growth (%), 2017–2025 Figure 18: North America Market Size (US$ Mn) Analysis by Hospitals End Users Segment, 2012–2016 Figure 19: North America Market Forecast & Y-o-Y Growth (%) by Hospitals End Users Segment, 2017–2025 Figure 20: North America Portable Market Size (US$ Mn) Analysis by Ambulatory Surgical Centers End Users Segment, 2012–2016 Figure 21: North America Portable Market Forecast & Y-o-Y Growth (%) by Ambulatory Surgical Centers End Users Segment, 2017–2025 Figure 22: North America Market Size (US$ Mn) Analysis by Clinics End Users Segment, 2012–2016 Figure 23: North America Market Forecast & Y-o-Y Growth (%) by Clinics End Users Segment, 2017–2025 Figure 24: North America Portable Market Size (US$ Mn) Analysis by Nursing Facilities End Users Segment, 2012–2016 Figure 25: North America Portable Market Forecast & Y-o-Y Growth (%) by Nursing Facilities End Users Segment, 2017–2025 Figure 26: North America Market Attractiveness Analysis By Modality, 2017–2027 Figure 27: North America Market Attractiveness Analysis By End User, 2017–2027 Figure 28: North America Market Attractiveness Analysis By Region, 2017–2027 Figure 29: Latin America Market Value Share By Modality (2016) Figure 30: Latin America Market Value Share By End User (2016) Figure 31: Latin America Market Value Share By Country (2016) Figure 32: Latin America Market Size Analysis, 2012–2016 Figure 33: Latin America Market Forecast & Y-o-Y growth, 2017–2027 Figure 34: Brazil Market Size (US$ Mn) Analysis, 2012–2016 Figure 35: Brazil Market Forecast & Y-o-Y Growth (%), 2017–2027 Figure 36: Mexico Market Size (US$ Mn) Analysis, 2012–2016 Figure 37: Mexico Market Forecast & Y-o-Y Growth (%), 2017–2027 Figure 38: Rest of Latin America Market Size (US$ Mn) Analysis, 2012–2017 Figure 39: Rest of Latin America Market Forecast & Y-o-Y Growth (%), 2017–2027 Figure 40: Latin America Standalone Market Size (US$ Mn) Analysis, 2012–2016 Figure 41: Latin America Standalone Market Forecast & Y-o-Y Growth (%), 2017–2025 Figure 42: Latin America Portable Market Size (US$ Mn) Analysis, 2012–2016 Figure 43: Latin America Portable Market Forecast & Y-o-Y Growth (%), 2017–2025 Figure 44: Latin America Market Size (US$ Mn) Analysis by Hospitals End Users Segment, 2012–2016 Figure 45: Latin America Market Forecast & Y-o-Y Growth (%) by Hospitals End Users Segment, 2017–2025 Figure 46: Latin America Portable Market Size (US$ Mn) Analysis by Ambulatory Surgical Centers End Users Segment, 2012–2016 Figure 47: Latin America Portable Market Forecast & Y-o-Y Growth (%) by Ambulatory Surgical Centers End Users Segment, 2017–2025 Figure 48: Latin America Market Size (US$ Mn) Analysis by Clinics End Users Segment, 2012–2016 Figure 49: Latin America Market Forecast & Y-o-Y Growth (%) by Clinics End Users Segment, 2017–2025 Figure 50: Latin America Portable Market Size (US$ Mn) Analysis by Nursing Facilities End Users Segment, 2012–2016 Figure 51: Latin America Portable Market Forecast & Y-o-Y Growth (%) by Nursing Facilities End Users Segment, 2017–2025 Figure 52: Latin America Market Attractiveness Analysis By Modality, 2017–2027 Figure 53: Latin America Market Attractiveness Analysis By End User, 2017–2027 Figure 54: Latin America Market Attractiveness Analysis By Region, 2017–2027 Figure 55: Western Europe Market Value Share By Modality (2016) Figure 56: Western Europe Market Value Share By End User (2016) Figure 57: Western Europe Market Value Share By Country (2016) Figure 58: Western Europe Market Size Analysis, 2012–2016 Figure 59: Western Europe Market Forecast & Y-o-Y growth, 2017–2027 Figure 60: Germany Market Size (US$ Mn) Analysis, 2012–2016 Figure 61: Germany Market Forecast & Y-o-Y Growth (%), 2017–2027 Figure 62: U.K. Market Size (US$ Mn) Analysis, 2012–2016 Figure 63: U.K. Market Forecast & Y-o-Y Growth (%), 2017–2027 Figure 64: France Market Size (US$ Mn) Analysis, 2012–2016 Figure 65: France Market Forecast & Y-o-Y Growth (%), 2017–2027 Figure 66: Italy Market Size (US$ Mn) Analysis, 2012–2016 Figure 67: Italy Market Forecast & Y-o-Y Growth (%), 2017–2027 Figure 68: Spain Market Size (US$ Mn) Analysis, 2012–2016 Figure 69: Spain Market Forecast & Y-o-Y Growth (%), 2017–2027 Figure 70: NORDIC Region Market Size (US$ Mn) Analysis, 2012–2016 Figure 71: NORDIC Region Market Forecast & Y-o-Y Growth (%), 2017–2027 Figure 72: BENELUX Market Size (US$ Mn) Analysis, 2012–2016 Figure 73: BENELUX Market Forecast & Y-o-Y Growth (%), 2017–2027 Figure 74: Rest of Western Europe Market Size (US$ Mn) Analysis, 2012–2016 Figure 75: Rest of Western Europe Market Forecast & Y-o-Y Growth (%), 2017–2027 Figure 76: Western Europe Standalone Market Size (US$ Mn) Analysis, 2012–2016 Figure 77: Western Europe Standalone Market Forecast & Y-o-Y Growth (%), 2017–2025 Figure 78: Western Europe Portable Market Size (US$ Mn) Analysis, 2012–2016 Figure 79: Western Europe Portable Market Forecast & Y-o-Y Growth (%), 2017–2025 Figure 80: Western Europe Market Size (US$ Mn) Analysis by Hospitals End Users Segment, 2012–2016 Figure 81: Western Europe Market Forecast & Y-o-Y Growth (%) by Hospitals End Users Segment, 2017–2025 Figure 82: Western Europe Portable Market Size (US$ Mn) Analysis by Ambulatory Surgical Centers End Users Segment, 2012–2016 Figure 83: Western Europe Portable Market Forecast & Y-o-Y Growth (%) by Ambulatory Surgical Centers End Users Segment, 2017–2025 Figure 84: Western Europe Market Size (US$ Mn) Analysis by Clinics End Users Segment, 2012–2016 Figure 85: Western Europe Market Forecast & Y-o-Y Growth (%) by Clinics End Users Segment, 2017–2025 Figure 86: Western Europe Portable Market Size (US$ Mn) Analysis by Nursing Facilities End Users Segment, 2012–2016 Figure 87: Western Europe Portable Market Forecast & Y-o-Y Growth (%) by Nursing Facilities End Users Segment, 2017–2025 Figure 88: Western Europe Market Attractiveness Analysis By Modality, 2017–2027 Figure 89: Western Europe Market Attractiveness Analysis By End User, 2017–2027 Figure 90: Western Europe Market Attractiveness Analysis By Region, 2017–2027 Figure 91: Eastern Europe Market Value Share By Modality (2016) Figure 92: Eastern Europe Market Value Share By End User (2016) Figure 93: Eastern Europe Market Value Share By Country (2016) Figure 94: Eastern Europe Market Size Analysis, 2012–2016 Figure 95: Eastern Europe Market Forecast & Y-o-Y growth, 2017–2027 Figure 96: Russia Market Size (US$ Mn) Analysis, 2012–2016 Figure 97: Russia Market Forecast & Y-o-Y Growth (%), 2017–2027 Figure 98: Poland Market Size (US$ Mn) Analysis, 2012–2016 Figure 99: Poland Market Forecast & Y-o-Y Growth (%), 2017–2027 Figure 100: Rest of Eastern Europe Market Size (US$ Mn) Analysis, 2012–2016 Figure 101: Rest of Eastern Europe Market Forecast & Y-o-Y Growth (%), 2017–2027 Figure 102: Eastern Europe Standalone Market Size (US$ Mn) Analysis, 2012–2016 Figure 103: Eastern Europe Standalone Market Forecast & Y-o-Y Growth (%), 2017–2025 Figure 104: Eastern Europe Portable Market Size (US$ Mn) Analysis, 2012–2016 Figure 105: Eastern Europe Portable Market Forecast & Y-o-Y Growth (%), 2017–2025 Figure 106: Eastern Europe Market Size (US$ Mn) Analysis by Hospitals End Users Segment, 2012–2016 Figure 107: Eastern Europe Market Forecast & Y-o-Y Growth (%) by Hospitals End Users Segment, 2017–2025 Figure 108: Eastern Europe Portable Market Size (US$ Mn) Analysis by Ambulatory Surgical Centers End Users Segment, 2012–2016 Figure 109: Eastern Europe Portable Market Forecast & Y-o-Y Growth (%) by Ambulatory Surgical Centers End Users Segment, 2017–2025 Figure 110: Eastern Europe Market Size (US$ Mn) Analysis by Clinics End Users Segment, 2012–2016 Figure 111: Eastern Europe Market Forecast & Y-o-Y Growth (%) by Clinics End Users Segment, 2017–2025 Figure 112: Eastern Europe Portable Market Size (US$ Mn) Analysis by Nursing Facilities End Users Segment, 2012–2016 Figure 113: Eastern Europe Portable Market Forecast & Y-o-Y Growth (%) by Nursing Facilities End Users Segment, 2017–2025 Figure 114: Eastern Europe Market Attractiveness Analysis By Modality, 2017–2027 Figure 115: Eastern Europe Market Attractiveness Analysis By End User, 2017–2027 Figure 116: Eastern Europe Market Attractiveness Analysis By Region, 2017–2027 Figure 117: APEJ Market Value Share By Modality (2016) Figure 118: APEJ Market Value Share By End User (2016) Figure 119: APEJ Market Value Share By Country (2016) Figure 120: APEJ Market Size Analysis, 2012–2016 Figure 121: APEJ Market Forecast & Y-o-Y growth, 2017–2027 Figure 122: China Market Size (US$ Mn) Analysis, 2012–2016 Figure 123: China Market Forecast & Y-o-Y Growth (%), 2017–2027 Figure 124: India Market Size (US$ Mn) Analysis, 2012–2016 Figure 125: India Market Forecast & Y-o-Y Growth (%), 2017–2027 Figure 126: ASEAN Market Size (US$ Mn) Analysis, 2012–2016 Figure 127: ASEAN Market Forecast & Y-o-Y Growth (%), 2017–2027 Figure 128: Australia & New Zealand Market Size (US$ Mn) Analysis, 2012–2016 Figure 129: Australia & New Zealand Market Forecast & Y-o-Y Growth (%), 2017–2027 Figure 130: Rest of APEJ Market Size (US$ Mn) Analysis, 2012–2016 Figure 131: Rest of APEJ Market Forecast & Y-o-Y Growth (%), 2017–2027 Figure 132: APEJ Standalone Market Size (US$ Mn) Analysis, 2012–2016 Figure 133: APEJ Standalone Market Forecast & Y-o-Y Growth (%), 2017–2025 Figure 134: APEJ Portable Market Size (US$ Mn) Analysis, 2012–2016 Figure 135: APEJ Portable Market Forecast & Y-o-Y Growth (%), 2017–2025 Figure 136: APEJ Market Size (US$ Mn) Analysis by Hospitals End Users Segment, 2012–2016 Figure 137: APEJ Market Forecast & Y-o-Y Growth (%) by Hospitals End Users Segment, 2017–2025 Figure 138: APEJ Portable Market Size (US$ Mn) Analysis by Ambulatory Surgical Centers End Users Segment, 2012–2016 Figure 139: APEJ Portable Market Forecast & Y-o-Y Growth (%) by Ambulatory Surgical Centers End Users Segment, 2017–2025 Figure 140: APEJ Market Size (US$ Mn) Analysis by Clinics End Users Segment, 2012–2016 Figure 141: APEJ Market Forecast & Y-o-Y Growth (%) by Clinics End Users Segment, 2017–2025 Figure 142: APEJ Portable Market Size (US$ Mn) Analysis by Nursing Facilities End Users Segment, 2012–2016 Figure 143: APEJ Portable Market Forecast & Y-o-Y Growth (%) by Nursing Facilities End Users Segment, 2017–2025 Figure 144: APEJ Market Attractiveness Analysis By Modality, 2017–2027 Figure 145: APEJ Market Attractiveness Analysis By End User, 2017–2027 Figure 146: APEJ Market Attractiveness Analysis By Region, 2017–2027 Figure 147: Japan Market Value Share By Modality (2016) Figure 148: Japan Market Value Share By End User (2016) Figure 149: Japan Market Size Analysis, 2012–2016 Figure 150: Japan Market Forecast & Y-o-Y growth, 2017–2027 Figure 151: Japan Standalone Market Size (US$ Mn) Analysis, 2012–2016 Figure 152: Japan Standalone Market Forecast & Y-o-Y Growth (%), 2017–2025 Figure 153: Japan Portable Market Size (US$ Mn) Analysis, 2012–2016 Figure 154: Japan Portable Market Forecast & Y-o-Y Growth (%), 2017–2025 Figure 155: Japan Market Size (US$ Mn) Analysis by Hospitals End Users Segment, 2012–2016 Figure 156: Japan Market Forecast & Y-o-Y Growth (%) by Hospitals End Users Segment, 2017–2025 Figure 157: Japan Portable Market Size (US$ Mn) Analysis by Ambulatory Surgical Centers End Users Segment, 2012–2016 Figure 158: Japan Portable Market Forecast & Y-o-Y Growth (%) by Ambulatory Surgical Centers End Users Segment, 2017–2025 Figure 159: Japan Market Size (US$ Mn) Analysis by Clinics End Users Segment, 2012–2016 Figure 160: Japan Market Forecast & Y-o-Y Growth (%) by Clinics End Users Segment, 2017–2025 Figure 161: Japan Portable Market Size (US$ Mn) Analysis by Nursing Facilities End Users Segment, 2012–2016 Figure 162: Japan Portable Market Forecast & Y-o-Y Growth (%) by Nursing Facilities End Users Segment, 2017–2025 Figure 163: Japan Market Attractiveness Analysis By Modality, 2017–2027 Figure 164: Japan Market Attractiveness Analysis By End User, 2017–2027 Figure 165: MEA Market Value Share By Modality (2016) Figure 166: MEA Market Value Share By End User (2016) Figure 167: MEA Market Value Share By Country (2016) Figure 168: MEA Market Size Analysis, 2012–2016 Figure 169: MEA Market Forecast & Y-o-Y growth, 2017–2027 Figure 170: GCC Countries Market Size (US$ Mn) Analysis, 2012–2016 Figure 171: GCC Countries Market Forecast & Y-o-Y Growth (%), 2017–2027 Figure 172: South Africa Market Size (US$ Mn) Analysis, 2012–2016 Figure 173: South Africa Market Forecast & Y-o-Y Growth (%), 2017–2027 Figure 174: Rest of MEA Market Size (US$ Mn) Analysis, 2012–2016 Figure 175: Rest of MEA Market Forecast & Y-o-Y Growth (%), 2017–2027 Figure 176: MEA Standalone Market Size (US$ Mn) Analysis, 2012–2016 Figure 177: MEA Standalone Market Forecast & Y-o-Y Growth (%), 2017–2025 Figure 178: MEA Portable Market Size (US$ Mn) Analysis, 2012–2016 Figure 179: MEA Portable Market Forecast & Y-o-Y Growth (%), 2017–2025 Figure 180: MEA Market Size (US$ Mn) Analysis by Hospitals End Users Segment, 2012–2016 Figure 181: MEA Market Forecast & Y-o-Y Growth (%) by Hospitals End Users Segment, 2017–2025 Figure 182: MEA Portable Market Size (US$ Mn) Analysis by Ambulatory Surgical Centers End Users Segment, 2012–2016 Figure 183: MEA Portable Market Forecast & Y-o-Y Growth (%) by Ambulatory Surgical Centers End Users Segment, 2017–2025 Figure 184: MEA Market Size (US$ Mn) Analysis by Clinics End Users Segment, 2012–2016 Figure 185: MEA Market Forecast & Y-o-Y Growth (%) by Clinics End Users Segment, 2017–2025 Figure 186: MEA Portable Market Size (US$ Mn) Analysis by Nursing Facilities End Users Segment, 2012–2016 Figure 187: MEA Portable Market Forecast & Y-o-Y Growth (%) by Nursing Facilities End Users Segment, 2017–2025 Figure 188: MEA Market Attractiveness Analysis By Modality, 2017–2027 Figure 189: MEA Market Attractiveness Analysis By End User, 2017–2027 Figure 190: MEA Market Attractiveness Analysis By Region, 2017–2027 Figure 191: Global Market Attractiveness Analysis By Region, 2017–2027 Figure 192: Global Market Attractiveness Analysis By Modality, 2017–2027 Figure 193: Global Market Attractiveness Analysis By End User, 2017–2027 Figure 194: Global Market Value Analysis and Forecast, 2016–2027 (US$ Mn) Figure 195: Global Market Absolute $ Opportunity (US$ Mn), 2016–2027 Figure 196: Global Standalone Market Volume (units) Analysis, 2012–2016 Figure 197: Global Standalone Market Volume (units) Forecast & Y-o-Y growth, 2017–2027 Figure 198: Global Portable Market Volume (units) Analysis, 2012–2016 Figure 199: Global Portable Market Volume (units) Forecast & Y-o-Y growth, 2017–2027
Explore Healthcare Insights
View Reports