Twist Tie Machines Market
Market Insights on Twist Tie Machines covering sales outlook, demand forecast & up-to-date key trends
Twist Tie Machines Market by Machine Type, Operating Speed, Application & Region - Forecast 2022 – 2032
Twist Tie Machines Market Snapshot (2022-2032)
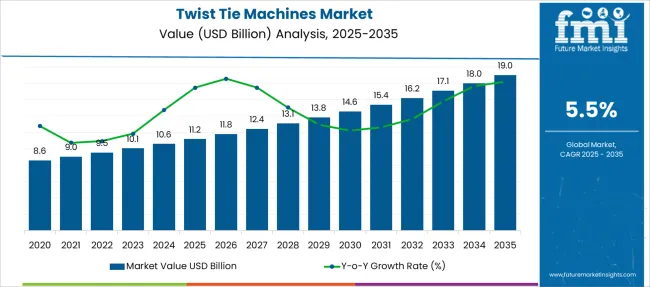
[308 Pages Report] The global twist tie machines market size is expected to reach US$ 16.3 Billion in 2032. The twist tie machines market is growing rapidly.
As per FMI Analysts, the global twist tie machines market is estimated to be valued at US$ 9.54 Billion in 2022 and is projected to increase at a CAGR of 5.45% in the forecast period from 2022 to 2032.
Report Attribute |
Details |
Twist tie machines Market Estimated Base Year Value (2021) |
US$ 9.04 Billion |
Twist tie machines Market Expected Market Value (2022) |
US$ 9.54 Billion |
Twist tie machines Market Anticipated Forecast Value (2032) |
US$ 16.3 Billion |
Twist tie machines Market Projected Growth Rate (2022-2032) |
5.45% CAGR |
There are many types of twist tie machines, including automatic or semi-automatic types, depending on the requirements of the customer. Almost all supermarkets globally accept twist tie machines to improve productivity. These machines can be used in various applications, including food, bakery, confectionery, wire harness assembly, and industrial.
The advent of technological innovation in-store or online, coupled with consumers' shifting demands, is reshaping the future packaging industry. In supermarkets and grocery stores, the demand for twist tie machines is rising; the widespread sale of food, including cereals, grains, beans and others, is impacting the twist tie machine demand.
Furthermore, twist tie machines come with adjustable ribbon length, ensuring the economical use of ribbons. These twist tie machines operate at different speeds based on the requirements. Upon receipt of these factors, the global twist tie machines market will grow steadily during the forecast period.
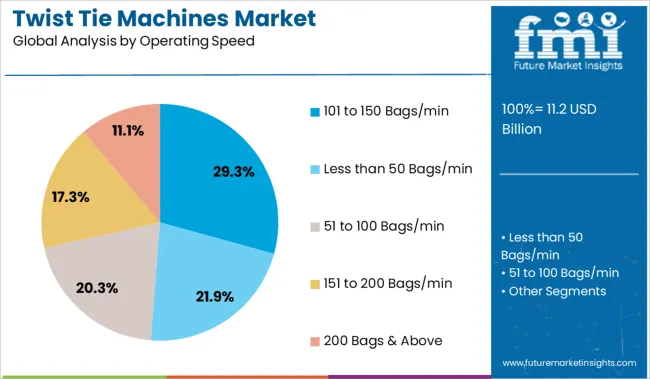
Known for their high operating speeds between 50 and 200 bags per minute, twist tie machines are continuously in demand due to the increasing establishment of grocery stores in supermarkets across the globe. All these factors will support the growth of the global twist tie machines market during the forecast period.
There are twist tie machines that will clinch a variety of sized packages. Twist tie machines are also manufactured for the food industry and warehouses that do large amounts of packaging.
European and North American countries are both regions that have a high installed base of twist tie machines because of the large number of shopping complexes, hypermarkets, and supermarkets within these regions. The U.S., Canada, Germany, Italy, France, the U.K., and Benelux are some of the countries with a high installed base of twist tie machines.
For the global twist tie machines market, the MEA region is likely to experience above-average demand in the forecast period.
Let us know your requirement to get
100% FREE customization
What are the Various Factors Driving the Twist Tie Machines Market?
The twist tie machines market has received a lot of traction in the industry.
As a result, these factors are expected to drive the global twist tie machines market during the forecast period; additionally, twist tie machines come with diverse ribbon lengths, ensuring the most economical use of ribbons. Finally, twist tie machines come with various operating speeds depending on the requirement; thus, they are expected to drive the global twist tie machines market during the forecast period.
One of the main reasons for the increasing use of twist ties in the global market is how much time it saves across a conveyor. An employee who does not utilize the twist tie machine in a production line is much less efficient than an employee who uses the twist tie machine for twisting off the ties.
Consumers' shifting demands combined with technological innovations in-store or online are reshaping the future of the twist tie machines market. In supermarkets and grocery stores, twist tie machines are in high demand, and the widespread shopping of food, including cereals, grains, beans and others, is driving the demand for twist tie machines globally.
There are twist tie machines that simplify the process of tying a knot of packages. These machines have been accepted by almost all supermarket chains to improve productivity & can be used in many different industries, including food, bakery, confectionery, wire harness & assembly, and industrial & they can also be automatic or semi-automatic, depending on the customer's preferences.
For tying different-sized packages, twist tie machines are manufactured in different diameters. Twist tie machines are manufactured not only for supermarkets or grocery stores but also for the food industries and warehouses where large volumes of packaging are done.
What is Regional Analysis of Twist Tie Machines Market Share?
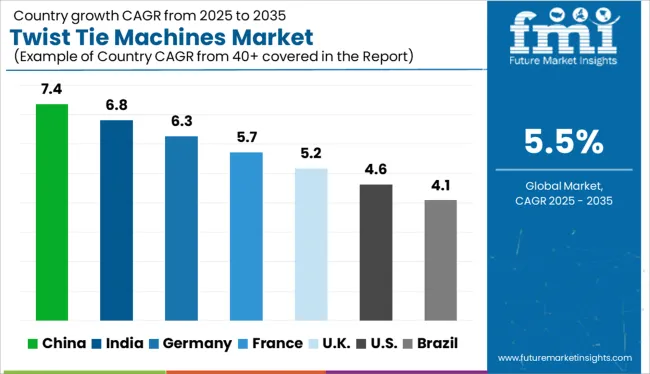
Asian countries, including India, China, Thailand, Malaysia, Singapore, and Indonesia, are undergoing rapid industrialization and globalization. The twist tie machines market is expected to grow significantly during the forecast period. This is due to the establishment of supermarkets, malls, shopping centres, and grocery stores throughout the region.
In terms of speed, Europe and North America are closely followed by Asia. The countries in these two regions are technologically advanced, and they are among the first to adopt twist tie machines. The U.S., Canada, Germany, Italy, France, the U.K., and Benelux are among the nations with a large installed base of twist tie machines, attributed to the high number of shopping malls, hypermarkets, and supermarkets in these regions.
It is forecast that the demand for global twist tie machines is likely to be above average during the forecast period in the MEA region.
Find your sweet spots for generating winning opportunities in this market.
Talk to AnalystWhat is the Competition Landscape in the Twist Tie Machines Market?
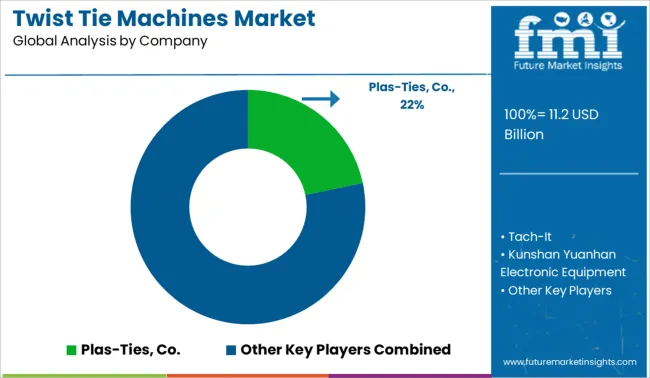
Some of the leading companies operating in the global twist tie machines market include Plas-Ties, Co., Tach-It, Zhenjiang Hongda Commodity, Kunshan Yuanhan Electronic Equipment, Hughes Enterprises, IPS Packaging, International Plastics Inc.
In-store and online technological advances combined with changing consumer preferences are reshaping the future horticulture film market. The availability of twist tie machines in supermarkets and grocery stores is rising exponentially. The prevalence of cereals, grains, beans and many other food items is driving the popularity of twist tie machines globally.
Twist tie machines can be ordered in various diameters to meet the different sizing needs of different packages. These machines are not only manufactured for supermarkets and grocery stores, but also for food industries and warehouses where large quantities of packaging are done.
Due to increasing establishment of supermarkets, grocery stores across the globe, demand for twist tie machines has steadily been rising, fueling market growth during the forecast period. Their operating speed ranges from 50-60 bags per minute.
Report Scope
Report Attribute |
Details |
Growth Rate |
CAGR of 5.45% from 2022 to 2032 |
Base Year for Estimation |
2021 |
Historical Data |
2015-2021 |
Forecast Period |
2022-2032 |
Quantitative Units |
Revenue in USD Billion, Volume in Kilotons and CAGR from 2022-2032 |
Report Coverage |
Revenue Forecast, Volume Forecast, Company Ranking, Competitive Landscape, Growth Factors, Trends and Pricing Analysis |
Segments Covered |
|
Regions Covered |
|
Key Countries Profiled |
|
Key Companies Profiled |
|
Customization |
Available Upon Request |

An unified Market Research Subscription Platform, built for today’s disparate research needs.
Key Segments Profiled in the Twist Tie Machines Market
By Machine Type:
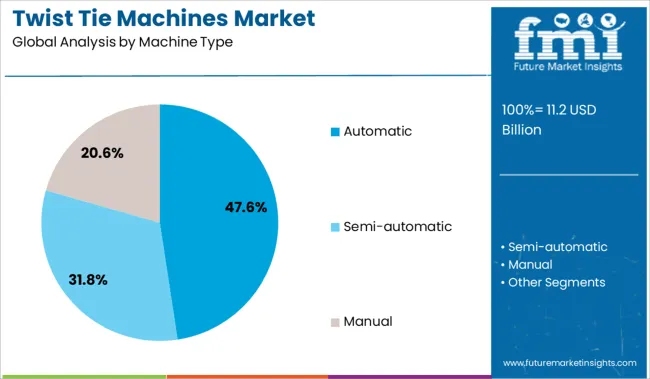
- Automatic
- Semi-automatic
- Manual
By Operating Speed:
- Less than 50 bags/min
- 51 to 100 bags/min
- 101 to 150 bags/min
- 151 to 200 bags/min
- 200 bags & above
By Application:
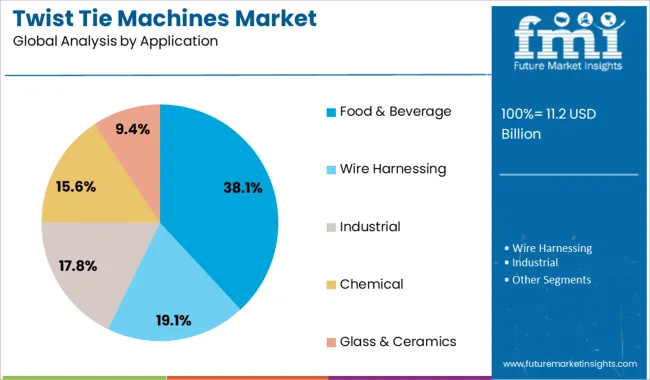
- Food & Beverage
- Wire Harnessing
- Industrial
- Chemical
- Glass & Ceramics
By Region:
- North America
- Latin America
- Europe
- East Asia
- South Asia
- Oceania
- Middle East and Africa
Frequently Asked Questions
The global twist tie machines market is set to grow at a CAGR of 5.45% through 2032.
The U.S. is projected to lead the twist tie machines market in the forecast period.
Koninklijke DSM N.V., BASF SE, Danone SA, and Genova Diagnostics, Inc. are some of the renowned companies in the twist tie machines market.
1. Executive Summary
1.1. Global Market Outlook
1.2. Demand-side Trends
1.3. Supply-side Trends
1.4. Technology Roadmap Analysis
1.5. Analysis and Recommendations
2. Market Overview
2.1. Market Coverage / Taxonomy
2.2. Market Definition / Scope / Limitations
3. Market Background
3.1. Market Dynamics
3.1.1. Drivers
3.1.2. Restraints
3.1.3. Opportunity
3.1.4. Trends
3.2. Scenario Forecast
3.2.1. Demand in Optimistic Scenario
3.2.2. Demand in Likely Scenario
3.2.3. Demand in Conservative Scenario
3.3. Opportunity Map Analysis
3.4. Product Life Cycle Analysis
3.5. Supply Chain Analysis
3.5.1. Supply Side Participants and their Roles
3.5.1.1. Producers
3.5.1.2. Mid-Level Participants (Traders/ Agents/ Brokers)
3.5.1.3. Wholesalers and Distributors
3.5.2. Value Added and Value Created at Node in the Supply Chain
3.5.3. List of Raw Material Suppliers
3.5.4. List of Existing and Potential Buyer’s
3.6. Investment Feasibility Matrix
3.7. Value Chain Analysis
3.7.1. Profit Margin Analysis
3.7.2. Wholesalers and Distributors
3.7.3. Retailers
3.8. PESTLE and Porter’s Analysis
3.9. Regulatory Landscape
3.9.1. By Key Regions
3.9.2. By Key Countries
3.10. Regional Parent Market Outlook
3.11. Production and Consumption Statistics
3.12. Import and Export Statistics
4. Global Twist Tie Machines Market Analysis 2017-2021 and Forecast, 2022-2032
4.1. Historical Market Size Value (US$ Mn) & Volume (Units) Analysis, 2017-2021
4.2. Current and Future Market Size Value (US$ Mn) & Volume (Units) Projections, 2022-2032
4.2.1. Y-o-Y Growth Trend Analysis
4.2.2. Absolute $ Opportunity Analysis
5. Global Twist Tie Machines Market Analysis 2017-2021 and Forecast 2022-2032, By Machine Type
5.1. Introduction / Key Findings
5.2. Historical Market Size Value (US$ Mn) & Volume (Units) Analysis By Machine Type, 2017-2021
5.3. Current and Future Market Size Value (US$ Mn) & Volume (Units) Analysis and Forecast By Machine Type, 2022-2032
5.3.1. Automatic
5.3.2. Semi-automatic
5.3.3. Manual
5.4. Y-o-Y Growth Trend Analysis By Machine Type, 2017-2021
5.5. Absolute $ Opportunity Analysis By Machine Type, 2022-2032
6. Global Twist Tie Machines Market Analysis 2017-2021 and Forecast 2022-2032, By Operating Speed
6.1. Introduction / Key Findings
6.2. Historical Market Size Value (US$ Mn) & Volume (Units) Analysis By Operating Speed, 2017-2021
6.3. Current and Future Market Size Value (US$ Mn) & Volume (Units) Analysis and Forecast By Operating Speed, 2022-2032
6.3.1. Less than 50 Bags/min
6.3.2. 51 to 100 Bags/min
6.3.3. 101 to 150 Bags/min
6.3.4. 151 to 200 Bags/min
6.3.5. 200 Bags & Above
6.4. Y-o-Y Growth Trend Analysis By Operating Speed, 2017-2021
6.5. Absolute $ Opportunity Analysis By Operating Speed, 2022-2032
7. Global Twist Tie Machines Market Analysis 2017-2021 and Forecast 2022-2032, By Application
7.1. Introduction / Key Findings
7.2. Historical Market Size Value (US$ Mn) & Volume (Units) Analysis By Application, 2017-2021
7.3. Current and Future Market Size Value (US$ Mn) & Volume (Units) Analysis and Forecast By Application, 2022-2032
7.3.1. Food & Beverage
7.3.2. Wire Harnessing
7.3.3. Industrial
7.3.4. Chemical
7.3.5. Glass & Ceramics
7.4. Y-o-Y Growth Trend Analysis By Application, 2017-2021
7.5. Absolute $ Opportunity Analysis By Application, 2022-2032
8. Global Twist Tie Machines Market Analysis 2017-2021 and Forecast 2022-2032, By Region
8.1. Introduction
8.2. Historical Market Size Value (US$ Mn) & Volume (Units) Analysis By Region, 2017-2021
8.3. Current Market Size Value (US$ Mn) & Volume (Units) Analysis and Forecast By Region, 2022-2032
8.3.1. North America
8.3.2. Latin America
8.3.3. Europe
8.3.4. East Asia
8.3.5. South Asia & Pacific
8.3.6. MEA
8.4. Market Attractiveness Analysis By Region
9. North America Twist Tie Machines Market Analysis 2017-2021 and Forecast 2022-2032, By Country
9.1. Historical Market Size Value (US$ Mn) & Volume (Units) Trend Analysis By Market Taxonomy, 2017-2021
9.2. Market Size Value (US$ Mn) & Volume (Units) Forecast By Market Taxonomy, 2022-2032
9.2.1. By Country
9.2.1.1. U.S.
9.2.1.2. Canada
9.2.2. By Machine Type
9.2.3. By Operating Speed
9.2.4. By Application
9.3. Market Attractiveness Analysis
9.3.1. By Country
9.3.2. By Machine Type
9.3.3. By Operating Speed
9.3.4. By Application
9.4. Key Takeaways
10. Latin America Twist Tie Machines Market Analysis 2017-2021 and Forecast 2022-2032, By Country
10.1. Historical Market Size Value (US$ Mn) & Volume (Units) Trend Analysis By Market Taxonomy, 2017-2021
10.2. Market Size Value (US$ Mn) & Volume (Units) Forecast By Market Taxonomy, 2022-2032
10.2.1. By Country
10.2.1.1. Mexico
10.2.1.2. Brazil
10.2.1.3. Rest of Latin America
10.2.2. By Machine Type
10.2.3. By Operating Speed
10.2.4. By Application
10.3. Market Attractiveness Analysis
10.3.1. By Country
10.3.2. By Machine Type
10.3.3. By Operating Speed
10.3.4. By Application
10.4. Key Takeaways
11. Europe Twist Tie Machines Market Analysis 2017-2021 and Forecast 2022-2032, By Country
11.1. Historical Market Size Value (US$ Mn) & Volume (Units) Trend Analysis By Market Taxonomy, 2017-2021
11.2. Market Size Value (US$ Mn) & Volume (Units) Forecast By Market Taxonomy, 2022-2032
11.2.1. By Country
11.2.1.1. Germany
11.2.1.2. Italy
11.2.1.3. France
11.2.1.4. U.K.
11.2.1.5. Spain
11.2.1.6. BENELUX
11.2.1.7. Russia
11.2.1.8. Rest of Europe
11.2.2. By Machine Type
11.2.3. By Operating Speed
11.2.4. By Application
11.3. Market Attractiveness Analysis
11.3.1. By Country
11.3.2. By Machine Type
11.3.3. By Operating Speed
11.3.4. By Application
11.4. Key Takeaways
12. East Asia Twist Tie Machines Market Analysis 2017-2021 and Forecast 2022-2032, By Country
12.1. Historical Market Size Value (US$ Mn) & Volume (Units) Trend Analysis By Market Taxonomy, 2017-2021
12.2. Market Size Value (US$ Mn) & Volume (Units) Forecast By Market Taxonomy, 2022-2032
12.2.1. By Country
12.2.1.1. China
12.2.1.2. Japan
12.2.1.3. South Korea
12.2.2. By Machine Type
12.2.3. By Operating Speed
12.2.4. By Application
12.3. Market Attractiveness Analysis
12.3.1. By Country
12.3.2. By Machine Type
12.3.3. By Operating Speed
12.3.4. By Application
12.4. Key Takeaways
13. South Asia & Pacific Twist Tie Machines Market Analysis 2017-2021 and Forecast 2022-2032, By Country
13.1. Historical Market Size Value (US$ Mn) & Volume (Units) Trend Analysis By Market Taxonomy, 2017-2021
13.2. Market Size Value (US$ Mn) & Volume (Units) Forecast By Market Taxonomy, 2022-2032
13.2.1. By Country
13.2.1.1. India
13.2.1.2. ASEAN
13.2.1.3. Australia and New Zealand
13.2.1.4. Rest of South Asia & Pacific
13.2.2. By Machine Type
13.2.3. By Operating Speed
13.2.4. By Application
13.3. Market Attractiveness Analysis
13.3.1. By Country
13.3.2. By Machine Type
13.3.3. By Operating Speed
13.3.4. By Application
13.4. Key Takeaways
14. MEA Twist Tie Machines Market Analysis 2017-2021 and Forecast 2022-2032, By Country
14.1. Historical Market Size Value (US$ Mn) & Volume (Units) Trend Analysis By Market Taxonomy, 2017-2021
14.2. Market Size Value (US$ Mn) & Volume (Units) Forecast By Market Taxonomy, 2022-2032
14.2.1. By Country
14.2.1.1. GCC Countries
14.2.1.2. Turkey
14.2.1.3. South Africa
14.2.1.4. Rest of MEA
14.2.2. By Machine Type
14.2.3. By Operating Speed
14.2.4. By Application
14.3. Market Attractiveness Analysis
14.3.1. By Country
14.3.2. By Machine Type
14.3.3. By Operating Speed
14.3.4. By Application
14.4. Key Takeaways
15. Key Countries Twist Tie Machines Market Analysis
15.1. U.S.
15.1.1. Pricing Analysis
15.1.2. Market Share Analysis, 2021
15.1.2.1. By Machine Type
15.1.2.2. By Operating Speed
15.1.2.3. By Application
15.2. Canada
15.2.1. Pricing Analysis
15.2.2. Market Share Analysis, 2021
15.2.2.1. By Machine Type
15.2.2.2. By Operating Speed
15.2.2.3. By Application
15.3. Mexico
15.3.1. Pricing Analysis
15.3.2. Market Share Analysis, 2021
15.3.2.1. By Machine Type
15.3.2.2. By Operating Speed
15.3.2.3. By Application
15.4. Brazil
15.4.1. Pricing Analysis
15.4.2. Market Share Analysis, 2021
15.4.2.1. By Machine Type
15.4.2.2. By Operating Speed
15.4.2.3. By Application
15.5. Germany
15.5.1. Pricing Analysis
15.5.2. Market Share Analysis, 2021
15.5.2.1. By Machine Type
15.5.2.2. By Operating Speed
15.5.2.3. By Application
15.6. Italy
15.6.1. Pricing Analysis
15.6.2. Market Share Analysis, 2021
15.6.2.1. By Machine Type
15.6.2.2. By Operating Speed
15.6.2.3. By Application
15.7. France
15.7.1. Pricing Analysis
15.7.2. Market Share Analysis, 2021
15.7.2.1. By Machine Type
15.7.2.2. By Operating Speed
15.7.2.3. By Application
15.8. U.K.
15.8.1. Pricing Analysis
15.8.2. Market Share Analysis, 2021
15.8.2.1. By Machine Type
15.8.2.2. By Operating Speed
15.8.2.3. By Application
15.9. Spain
15.9.1. Pricing Analysis
15.9.2. Market Share Analysis, 2021
15.9.2.1. By Machine Type
15.9.2.2. By Operating Speed
15.9.2.3. By Application
15.10. BENELUX
15.10.1. Pricing Analysis
15.10.2. Market Share Analysis, 2021
15.10.2.1. By Machine Type
15.10.2.2. By Operating Speed
15.10.2.3. By Application
15.11. Russia
15.11.1. Pricing Analysis
15.11.2. Market Share Analysis, 2021
15.11.2.1. By Machine Type
15.11.2.2. By Operating Speed
15.11.2.3. By Application
15.12. China
15.12.1. Pricing Analysis
15.12.2. Market Share Analysis, 2021
15.12.2.1. By Machine Type
15.12.2.2. By Operating Speed
15.12.2.3. By Application
15.13. Japan
15.13.1. Pricing Analysis
15.13.2. Market Share Analysis, 2021
15.13.2.1. By Machine Type
15.13.2.2. By Operating Speed
15.13.2.3. By Application
15.14. South Korea
15.14.1. Pricing Analysis
15.14.2. Market Share Analysis, 2021
15.14.2.1. By Machine Type
15.14.2.2. By Operating Speed
15.14.2.3. By Application
15.15. India
15.15.1. Pricing Analysis
15.15.2. Market Share Analysis, 2021
15.15.2.1. By Machine Type
15.15.2.2. By Operating Speed
15.15.2.3. By Application
15.16. ASEAN
15.16.1. Pricing Analysis
15.16.2. Market Share Analysis, 2021
15.16.2.1. By Machine Type
15.16.2.2. By Operating Speed
15.16.2.3. By Application
15.17. Australia and New Zealand
15.17.1. Pricing Analysis
15.17.2. Market Share Analysis, 2021
15.17.2.1. By Machine Type
15.17.2.2. By Operating Speed
15.17.2.3. By Application
15.18. GCC Countries
15.18.1. Pricing Analysis
15.18.2. Market Share Analysis, 2021
15.18.2.1. By Machine Type
15.18.2.2. By Operating Speed
15.18.2.3. By Application
15.19. Turkey
15.19.1. Pricing Analysis
15.19.2. Market Share Analysis, 2021
15.19.2.1. By Machine Type
15.19.2.2. By Operating Speed
15.19.2.3. By Application
15.20. South Africa
15.20.1. Pricing Analysis
15.20.2. Market Share Analysis, 2021
15.20.2.1. By Machine Type
15.20.2.2. By Operating Speed
15.20.2.3. By Application
16. Market Structure Analysis
16.1. Competition Dashboard
16.2. Competition Benchmarking
16.3. Market Share Analysis of Top Players
16.3.1. By Regional
16.3.2. By Machine Type
16.3.3. By Operating Speed
16.3.4. By Application
17. Competition Analysis
17.1. Competition Deep Dive
17.1.1. Plas-Ties, Co.
17.1.1.1. Overview
17.1.1.2. Product Portfolio
17.1.1.3. Profitability by Market Segments
17.1.1.4. Sales Footprint
17.1.1.5. Strategy Overview
17.1.1.5.1. Marketing Strategy
17.1.1.5.2. Product Strategy
17.1.1.5.3. Channel Strategy
17.1.2. Tach-It
17.1.2.1. Overview
17.1.2.2. Product Portfolio
17.1.2.3. Profitability by Market Segments
17.1.2.4. Sales Footprint
17.1.2.5. Strategy Overview
17.1.2.5.1. Marketing Strategy
17.1.2.5.2. Product Strategy
17.1.2.5.3. Channel Strategy
17.1.3. Kunshan Yuanhan Electronic Equipment
17.1.3.1. Overview
17.1.3.2. Product Portfolio
17.1.3.3. Profitability by Market Segments
17.1.3.4. Sales Footprint
17.1.3.5. Strategy Overview
17.1.3.5.1. Marketing Strategy
17.1.3.5.2. Product Strategy
17.1.3.5.3. Channel Strategy
17.1.4. Hughes Enterprises
17.1.4.1. Overview
17.1.4.2. Product Portfolio
17.1.4.3. Profitability by Market Segments
17.1.4.4. Sales Footprint
17.1.4.5. Strategy Overview
17.1.4.5.1. Marketing Strategy
17.1.4.5.2. Product Strategy
17.1.4.5.3. Channel Strategy
17.1.5. IPS Packaging
17.1.5.1. Overview
17.1.5.2. Product Portfolio
17.1.5.3. Profitability by Market Segments
17.1.5.4. Sales Footprint
17.1.5.5. Strategy Overview
17.1.5.5.1. Marketing Strategy
17.1.5.5.2. Product Strategy
17.1.5.5.3. Channel Strategy
17.1.6. International Plastics Inc.
17.1.6.1. Overview
17.1.6.2. Product Portfolio
17.1.6.3. Profitability by Market Segments
17.1.6.4. Sales Footprint
17.1.6.5. Strategy Overview
17.1.6.5.1. Marketing Strategy
17.1.6.5.2. Product Strategy
17.1.6.5.3. Channel Strategy
18. Assumptions & Acronyms Used
19. Research Methodology
Let us know your requirement to get
100% FREE customization
Table 1: Global Twist Tie Machines Market Value (US$ Mn) Forecast by Region, 2017-2032
Table 2: Global Twist Tie Machines Market Volume (Units) Forecast by Region, 2017-2032
Table 3: Global Twist Tie Machines Market Value (US$ Mn) Forecast by Machine Type, 2017-2032
Table 4: Global Twist Tie Machines Market Volume (Units) Forecast by Machine Type, 2017-2032
Table 5: Global Twist Tie Machines Market Value (US$ Mn) Forecast by Operating Speed, 2017-2032
Table 6: Global Twist Tie Machines Market Volume (Units) Forecast by Operating Speed, 2017-2032
Table 7: Global Twist Tie Machines Market Value (US$ Mn) Forecast by Application, 2017-2032
Table 8: Global Twist Tie Machines Market Volume (Units) Forecast by Application, 2017-2032
Table 9: North America Twist Tie Machines Market Value (US$ Mn) Forecast by Country, 2017-2032
Table 10: North America Twist Tie Machines Market Volume (Units) Forecast by Country, 2017-2032
Table 11: North America Twist Tie Machines Market Value (US$ Mn) Forecast by Machine Type, 2017-2032
Table 12: North America Twist Tie Machines Market Volume (Units) Forecast by Machine Type, 2017-2032
Table 13: North America Twist Tie Machines Market Value (US$ Mn) Forecast by Operating Speed, 2017-2032
Table 14: North America Twist Tie Machines Market Volume (Units) Forecast by Operating Speed, 2017-2032
Table 15: North America Twist Tie Machines Market Value (US$ Mn) Forecast by Application, 2017-2032
Table 16: North America Twist Tie Machines Market Volume (Units) Forecast by Application, 2017-2032
Table 17: Latin America Twist Tie Machines Market Value (US$ Mn) Forecast by Country, 2017-2032
Table 18: Latin America Twist Tie Machines Market Volume (Units) Forecast by Country, 2017-2032
Table 19: Latin America Twist Tie Machines Market Value (US$ Mn) Forecast by Machine Type, 2017-2032
Table 20: Latin America Twist Tie Machines Market Volume (Units) Forecast by Machine Type, 2017-2032
Table 21: Latin America Twist Tie Machines Market Value (US$ Mn) Forecast by Operating Speed, 2017-2032
Table 22: Latin America Twist Tie Machines Market Volume (Units) Forecast by Operating Speed, 2017-2032
Table 23: Latin America Twist Tie Machines Market Value (US$ Mn) Forecast by Application, 2017-2032
Table 24: Latin America Twist Tie Machines Market Volume (Units) Forecast by Application, 2017-2032
Table 25: Europe Twist Tie Machines Market Value (US$ Mn) Forecast by Country, 2017-2032
Table 26: Europe Twist Tie Machines Market Volume (Units) Forecast by Country, 2017-2032
Table 27: Europe Twist Tie Machines Market Value (US$ Mn) Forecast by Machine Type, 2017-2032
Table 28: Europe Twist Tie Machines Market Volume (Units) Forecast by Machine Type, 2017-2032
Table 29: Europe Twist Tie Machines Market Value (US$ Mn) Forecast by Operating Speed, 2017-2032
Table 30: Europe Twist Tie Machines Market Volume (Units) Forecast by Operating Speed, 2017-2032
Table 31: Europe Twist Tie Machines Market Value (US$ Mn) Forecast by Application, 2017-2032
Table 32: Europe Twist Tie Machines Market Volume (Units) Forecast by Application, 2017-2032
Table 33: East Asia Twist Tie Machines Market Value (US$ Mn) Forecast by Country, 2017-2032
Table 34: East Asia Twist Tie Machines Market Volume (Units) Forecast by Country, 2017-2032
Table 35: East Asia Twist Tie Machines Market Value (US$ Mn) Forecast by Machine Type, 2017-2032
Table 36: East Asia Twist Tie Machines Market Volume (Units) Forecast by Machine Type, 2017-2032
Table 37: East Asia Twist Tie Machines Market Value (US$ Mn) Forecast by Operating Speed, 2017-2032
Table 38: East Asia Twist Tie Machines Market Volume (Units) Forecast by Operating Speed, 2017-2032
Table 39: East Asia Twist Tie Machines Market Value (US$ Mn) Forecast by Application, 2017-2032
Table 40: East Asia Twist Tie Machines Market Volume (Units) Forecast by Application, 2017-2032
Table 41: South Asia & Pacific Twist Tie Machines Market Value (US$ Mn) Forecast by Country, 2017-2032
Table 42: South Asia & Pacific Twist Tie Machines Market Volume (Units) Forecast by Country, 2017-2032
Table 43: South Asia & Pacific Twist Tie Machines Market Value (US$ Mn) Forecast by Machine Type, 2017-2032
Table 44: South Asia & Pacific Twist Tie Machines Market Volume (Units) Forecast by Machine Type, 2017-2032
Table 45: South Asia & Pacific Twist Tie Machines Market Value (US$ Mn) Forecast by Operating Speed, 2017-2032
Table 46: South Asia & Pacific Twist Tie Machines Market Volume (Units) Forecast by Operating Speed, 2017-2032
Table 47: South Asia & Pacific Twist Tie Machines Market Value (US$ Mn) Forecast by Application, 2017-2032
Table 48: South Asia & Pacific Twist Tie Machines Market Volume (Units) Forecast by Application, 2017-2032
Table 49: MEA Twist Tie Machines Market Value (US$ Mn) Forecast by Country, 2017-2032
Table 50: MEA Twist Tie Machines Market Volume (Units) Forecast by Country, 2017-2032
Table 51: MEA Twist Tie Machines Market Value (US$ Mn) Forecast by Machine Type, 2017-2032
Table 52: MEA Twist Tie Machines Market Volume (Units) Forecast by Machine Type, 2017-2032
Table 53: MEA Twist Tie Machines Market Value (US$ Mn) Forecast by Operating Speed, 2017-2032
Table 54: MEA Twist Tie Machines Market Volume (Units) Forecast by Operating Speed, 2017-2032
Table 55: MEA Twist Tie Machines Market Value (US$ Mn) Forecast by Application, 2017-2032
Table 56: MEA Twist Tie Machines Market Volume (Units) Forecast by Application, 2017-2032
Find your sweet spots for generating winning opportunities in this market.
Talk to AnalystFigure 1: Global Twist Tie Machines Market Value (US$ Mn) by Machine Type, 2022-2032
Figure 2: Global Twist Tie Machines Market Value (US$ Mn) by Operating Speed, 2022-2032
Figure 3: Global Twist Tie Machines Market Value (US$ Mn) by Application, 2022-2032
Figure 4: Global Twist Tie Machines Market Value (US$ Mn) by Region, 2022-2032
Figure 5: Global Twist Tie Machines Market Value (US$ Mn) Analysis by Region, 2017-2032
Figure 6: Global Twist Tie Machines Market Volume (Units) Analysis by Region, 2017-2032
Figure 7: Global Twist Tie Machines Market Value Share (%) and BPS Analysis by Region, 2022-2032
Figure 8: Global Twist Tie Machines Market Y-o-Y Growth (%) Projections by Region, 2022-2032
Figure 9: Global Twist Tie Machines Market Value (US$ Mn) Analysis by Machine Type, 2017-2032
Figure 10: Global Twist Tie Machines Market Volume (Units) Analysis by Machine Type, 2017-2032
Figure 11: Global Twist Tie Machines Market Value Share (%) and BPS Analysis by Machine Type, 2022-2032
Figure 12: Global Twist Tie Machines Market Y-o-Y Growth (%) Projections by Machine Type, 2022-2032
Figure 13: Global Twist Tie Machines Market Value (US$ Mn) Analysis by Operating Speed, 2017-2032
Figure 14: Global Twist Tie Machines Market Volume (Units) Analysis by Operating Speed, 2017-2032
Figure 15: Global Twist Tie Machines Market Value Share (%) and BPS Analysis by Operating Speed, 2022-2032
Figure 16: Global Twist Tie Machines Market Y-o-Y Growth (%) Projections by Operating Speed, 2022-2032
Figure 17: Global Twist Tie Machines Market Value (US$ Mn) Analysis by Application, 2017-2032
Figure 18: Global Twist Tie Machines Market Volume (Units) Analysis by Application, 2017-2032
Figure 19: Global Twist Tie Machines Market Value Share (%) and BPS Analysis by Application, 2022-2032
Figure 20: Global Twist Tie Machines Market Y-o-Y Growth (%) Projections by Application, 2022-2032
Figure 21: Global Twist Tie Machines Market Attractiveness by Machine Type, 2022-2032
Figure 22: Global Twist Tie Machines Market Attractiveness by Operating Speed, 2022-2032
Figure 23: Global Twist Tie Machines Market Attractiveness by Application, 2022-2032
Figure 24: Global Twist Tie Machines Market Attractiveness by Region, 2022-2032
Figure 25: North America Twist Tie Machines Market Value (US$ Mn) by Machine Type, 2022-2032
Figure 26: North America Twist Tie Machines Market Value (US$ Mn) by Operating Speed, 2022-2032
Figure 27: North America Twist Tie Machines Market Value (US$ Mn) by Application, 2022-2032
Figure 28: North America Twist Tie Machines Market Value (US$ Mn) by Country, 2022-2032
Figure 29: North America Twist Tie Machines Market Value (US$ Mn) Analysis by Country, 2017-2032
Figure 30: North America Twist Tie Machines Market Volume (Units) Analysis by Country, 2017-2032
Figure 31: North America Twist Tie Machines Market Value Share (%) and BPS Analysis by Country, 2022-2032
Figure 32: North America Twist Tie Machines Market Y-o-Y Growth (%) Projections by Country, 2022-2032
Figure 33: North America Twist Tie Machines Market Value (US$ Mn) Analysis by Machine Type, 2017-2032
Figure 34: North America Twist Tie Machines Market Volume (Units) Analysis by Machine Type, 2017-2032
Figure 35: North America Twist Tie Machines Market Value Share (%) and BPS Analysis by Machine Type, 2022-2032
Figure 36: North America Twist Tie Machines Market Y-o-Y Growth (%) Projections by Machine Type, 2022-2032
Figure 37: North America Twist Tie Machines Market Value (US$ Mn) Analysis by Operating Speed, 2017-2032
Figure 38: North America Twist Tie Machines Market Volume (Units) Analysis by Operating Speed, 2017-2032
Figure 39: North America Twist Tie Machines Market Value Share (%) and BPS Analysis by Operating Speed, 2022-2032
Figure 40: North America Twist Tie Machines Market Y-o-Y Growth (%) Projections by Operating Speed, 2022-2032
Figure 41: North America Twist Tie Machines Market Value (US$ Mn) Analysis by Application, 2017-2032
Figure 42: North America Twist Tie Machines Market Volume (Units) Analysis by Application, 2017-2032
Figure 43: North America Twist Tie Machines Market Value Share (%) and BPS Analysis by Application, 2022-2032
Figure 44: North America Twist Tie Machines Market Y-o-Y Growth (%) Projections by Application, 2022-2032
Figure 45: North America Twist Tie Machines Market Attractiveness by Machine Type, 2022-2032
Figure 46: North America Twist Tie Machines Market Attractiveness by Operating Speed, 2022-2032
Figure 47: North America Twist Tie Machines Market Attractiveness by Application, 2022-2032
Figure 48: North America Twist Tie Machines Market Attractiveness by Country, 2022-2032
Figure 49: Latin America Twist Tie Machines Market Value (US$ Mn) by Machine Type, 2022-2032
Figure 50: Latin America Twist Tie Machines Market Value (US$ Mn) by Operating Speed, 2022-2032
Figure 51: Latin America Twist Tie Machines Market Value (US$ Mn) by Application, 2022-2032
Figure 52: Latin America Twist Tie Machines Market Value (US$ Mn) by Country, 2022-2032
Figure 53: Latin America Twist Tie Machines Market Value (US$ Mn) Analysis by Country, 2017-2032
Figure 54: Latin America Twist Tie Machines Market Volume (Units) Analysis by Country, 2017-2032
Figure 55: Latin America Twist Tie Machines Market Value Share (%) and BPS Analysis by Country, 2022-2032
Figure 56: Latin America Twist Tie Machines Market Y-o-Y Growth (%) Projections by Country, 2022-2032
Figure 57: Latin America Twist Tie Machines Market Value (US$ Mn) Analysis by Machine Type, 2017-2032
Figure 58: Latin America Twist Tie Machines Market Volume (Units) Analysis by Machine Type, 2017-2032
Figure 59: Latin America Twist Tie Machines Market Value Share (%) and BPS Analysis by Machine Type, 2022-2032
Figure 60: Latin America Twist Tie Machines Market Y-o-Y Growth (%) Projections by Machine Type, 2022-2032
Figure 61: Latin America Twist Tie Machines Market Value (US$ Mn) Analysis by Operating Speed, 2017-2032
Figure 62: Latin America Twist Tie Machines Market Volume (Units) Analysis by Operating Speed, 2017-2032
Figure 63: Latin America Twist Tie Machines Market Value Share (%) and BPS Analysis by Operating Speed, 2022-2032
Figure 64: Latin America Twist Tie Machines Market Y-o-Y Growth (%) Projections by Operating Speed, 2022-2032
Figure 65: Latin America Twist Tie Machines Market Value (US$ Mn) Analysis by Application, 2017-2032
Figure 66: Latin America Twist Tie Machines Market Volume (Units) Analysis by Application, 2017-2032
Figure 67: Latin America Twist Tie Machines Market Value Share (%) and BPS Analysis by Application, 2022-2032
Figure 68: Latin America Twist Tie Machines Market Y-o-Y Growth (%) Projections by Application, 2022-2032
Figure 69: Latin America Twist Tie Machines Market Attractiveness by Machine Type, 2022-2032
Figure 70: Latin America Twist Tie Machines Market Attractiveness by Operating Speed, 2022-2032
Figure 71: Latin America Twist Tie Machines Market Attractiveness by Application, 2022-2032
Figure 72: Latin America Twist Tie Machines Market Attractiveness by Country, 2022-2032
Figure 73: Europe Twist Tie Machines Market Value (US$ Mn) by Machine Type, 2022-2032
Figure 74: Europe Twist Tie Machines Market Value (US$ Mn) by Operating Speed, 2022-2032
Figure 75: Europe Twist Tie Machines Market Value (US$ Mn) by Application, 2022-2032
Figure 76: Europe Twist Tie Machines Market Value (US$ Mn) by Country, 2022-2032
Figure 77: Europe Twist Tie Machines Market Value (US$ Mn) Analysis by Country, 2017-2032
Figure 78: Europe Twist Tie Machines Market Volume (Units) Analysis by Country, 2017-2032
Figure 79: Europe Twist Tie Machines Market Value Share (%) and BPS Analysis by Country, 2022-2032
Figure 80: Europe Twist Tie Machines Market Y-o-Y Growth (%) Projections by Country, 2022-2032
Figure 81: Europe Twist Tie Machines Market Value (US$ Mn) Analysis by Machine Type, 2017-2032
Figure 82: Europe Twist Tie Machines Market Volume (Units) Analysis by Machine Type, 2017-2032
Figure 83: Europe Twist Tie Machines Market Value Share (%) and BPS Analysis by Machine Type, 2022-2032
Figure 84: Europe Twist Tie Machines Market Y-o-Y Growth (%) Projections by Machine Type, 2022-2032
Figure 85: Europe Twist Tie Machines Market Value (US$ Mn) Analysis by Operating Speed, 2017-2032
Figure 86: Europe Twist Tie Machines Market Volume (Units) Analysis by Operating Speed, 2017-2032
Figure 87: Europe Twist Tie Machines Market Value Share (%) and BPS Analysis by Operating Speed, 2022-2032
Figure 88: Europe Twist Tie Machines Market Y-o-Y Growth (%) Projections by Operating Speed, 2022-2032
Figure 89: Europe Twist Tie Machines Market Value (US$ Mn) Analysis by Application, 2017-2032
Figure 90: Europe Twist Tie Machines Market Volume (Units) Analysis by Application, 2017-2032
Figure 91: Europe Twist Tie Machines Market Value Share (%) and BPS Analysis by Application, 2022-2032
Figure 92: Europe Twist Tie Machines Market Y-o-Y Growth (%) Projections by Application, 2022-2032
Figure 93: Europe Twist Tie Machines Market Attractiveness by Machine Type, 2022-2032
Figure 94: Europe Twist Tie Machines Market Attractiveness by Operating Speed, 2022-2032
Figure 95: Europe Twist Tie Machines Market Attractiveness by Application, 2022-2032
Figure 96: Europe Twist Tie Machines Market Attractiveness by Country, 2022-2032
Figure 97: East Asia Twist Tie Machines Market Value (US$ Mn) by Machine Type, 2022-2032
Figure 98: East Asia Twist Tie Machines Market Value (US$ Mn) by Operating Speed, 2022-2032
Figure 99: East Asia Twist Tie Machines Market Value (US$ Mn) by Application, 2022-2032
Figure 100: East Asia Twist Tie Machines Market Value (US$ Mn) by Country, 2022-2032
Figure 101: East Asia Twist Tie Machines Market Value (US$ Mn) Analysis by Country, 2017-2032
Figure 102: East Asia Twist Tie Machines Market Volume (Units) Analysis by Country, 2017-2032
Figure 103: East Asia Twist Tie Machines Market Value Share (%) and BPS Analysis by Country, 2022-2032
Figure 104: East Asia Twist Tie Machines Market Y-o-Y Growth (%) Projections by Country, 2022-2032
Figure 105: East Asia Twist Tie Machines Market Value (US$ Mn) Analysis by Machine Type, 2017-2032
Figure 106: East Asia Twist Tie Machines Market Volume (Units) Analysis by Machine Type, 2017-2032
Figure 107: East Asia Twist Tie Machines Market Value Share (%) and BPS Analysis by Machine Type, 2022-2032
Figure 108: East Asia Twist Tie Machines Market Y-o-Y Growth (%) Projections by Machine Type, 2022-2032
Figure 109: East Asia Twist Tie Machines Market Value (US$ Mn) Analysis by Operating Speed, 2017-2032
Figure 110: East Asia Twist Tie Machines Market Volume (Units) Analysis by Operating Speed, 2017-2032
Figure 111: East Asia Twist Tie Machines Market Value Share (%) and BPS Analysis by Operating Speed, 2022-2032
Figure 112: East Asia Twist Tie Machines Market Y-o-Y Growth (%) Projections by Operating Speed, 2022-2032
Figure 113: East Asia Twist Tie Machines Market Value (US$ Mn) Analysis by Application, 2017-2032
Figure 114: East Asia Twist Tie Machines Market Volume (Units) Analysis by Application, 2017-2032
Figure 115: East Asia Twist Tie Machines Market Value Share (%) and BPS Analysis by Application, 2022-2032
Figure 116: East Asia Twist Tie Machines Market Y-o-Y Growth (%) Projections by Application, 2022-2032
Figure 117: East Asia Twist Tie Machines Market Attractiveness by Machine Type, 2022-2032
Figure 118: East Asia Twist Tie Machines Market Attractiveness by Operating Speed, 2022-2032
Figure 119: East Asia Twist Tie Machines Market Attractiveness by Application, 2022-2032
Figure 120: East Asia Twist Tie Machines Market Attractiveness by Country, 2022-2032
Figure 121: South Asia & Pacific Twist Tie Machines Market Value (US$ Mn) by Machine Type, 2022-2032
Figure 122: South Asia & Pacific Twist Tie Machines Market Value (US$ Mn) by Operating Speed, 2022-2032
Figure 123: South Asia & Pacific Twist Tie Machines Market Value (US$ Mn) by Application, 2022-2032
Figure 124: South Asia & Pacific Twist Tie Machines Market Value (US$ Mn) by Country, 2022-2032
Figure 125: South Asia & Pacific Twist Tie Machines Market Value (US$ Mn) Analysis by Country, 2017-2032
Figure 126: South Asia & Pacific Twist Tie Machines Market Volume (Units) Analysis by Country, 2017-2032
Figure 127: South Asia & Pacific Twist Tie Machines Market Value Share (%) and BPS Analysis by Country, 2022-2032
Figure 128: South Asia & Pacific Twist Tie Machines Market Y-o-Y Growth (%) Projections by Country, 2022-2032
Figure 129: South Asia & Pacific Twist Tie Machines Market Value (US$ Mn) Analysis by Machine Type, 2017-2032
Figure 130: South Asia & Pacific Twist Tie Machines Market Volume (Units) Analysis by Machine Type, 2017-2032
Figure 131: South Asia & Pacific Twist Tie Machines Market Value Share (%) and BPS Analysis by Machine Type, 2022-2032
Figure 132: South Asia & Pacific Twist Tie Machines Market Y-o-Y Growth (%) Projections by Machine Type, 2022-2032
Figure 133: South Asia & Pacific Twist Tie Machines Market Value (US$ Mn) Analysis by Operating Speed, 2017-2032
Figure 134: South Asia & Pacific Twist Tie Machines Market Volume (Units) Analysis by Operating Speed, 2017-2032
Figure 135: South Asia & Pacific Twist Tie Machines Market Value Share (%) and BPS Analysis by Operating Speed, 2022-2032
Figure 136: South Asia & Pacific Twist Tie Machines Market Y-o-Y Growth (%) Projections by Operating Speed, 2022-2032
Figure 137: South Asia & Pacific Twist Tie Machines Market Value (US$ Mn) Analysis by Application, 2017-2032
Figure 138: South Asia & Pacific Twist Tie Machines Market Volume (Units) Analysis by Application, 2017-2032
Figure 139: South Asia & Pacific Twist Tie Machines Market Value Share (%) and BPS Analysis by Application, 2022-2032
Figure 140: South Asia & Pacific Twist Tie Machines Market Y-o-Y Growth (%) Projections by Application, 2022-2032
Figure 141: South Asia & Pacific Twist Tie Machines Market Attractiveness by Machine Type, 2022-2032
Figure 142: South Asia & Pacific Twist Tie Machines Market Attractiveness by Operating Speed, 2022-2032
Figure 143: South Asia & Pacific Twist Tie Machines Market Attractiveness by Application, 2022-2032
Figure 144: South Asia & Pacific Twist Tie Machines Market Attractiveness by Country, 2022-2032
Figure 145: MEA Twist Tie Machines Market Value (US$ Mn) by Machine Type, 2022-2032
Figure 146: MEA Twist Tie Machines Market Value (US$ Mn) by Operating Speed, 2022-2032
Figure 147: MEA Twist Tie Machines Market Value (US$ Mn) by Application, 2022-2032
Figure 148: MEA Twist Tie Machines Market Value (US$ Mn) by Country, 2022-2032
Figure 149: MEA Twist Tie Machines Market Value (US$ Mn) Analysis by Country, 2017-2032
Figure 150: MEA Twist Tie Machines Market Volume (Units) Analysis by Country, 2017-2032
Figure 151: MEA Twist Tie Machines Market Value Share (%) and BPS Analysis by Country, 2022-2032
Figure 152: MEA Twist Tie Machines Market Y-o-Y Growth (%) Projections by Country, 2022-2032
Figure 153: MEA Twist Tie Machines Market Value (US$ Mn) Analysis by Machine Type, 2017-2032
Figure 154: MEA Twist Tie Machines Market Volume (Units) Analysis by Machine Type, 2017-2032
Figure 155: MEA Twist Tie Machines Market Value Share (%) and BPS Analysis by Machine Type, 2022-2032
Figure 156: MEA Twist Tie Machines Market Y-o-Y Growth (%) Projections by Machine Type, 2022-2032
Figure 157: MEA Twist Tie Machines Market Value (US$ Mn) Analysis by Operating Speed, 2017-2032
Figure 158: MEA Twist Tie Machines Market Volume (Units) Analysis by Operating Speed, 2017-2032
Figure 159: MEA Twist Tie Machines Market Value Share (%) and BPS Analysis by Operating Speed, 2022-2032
Figure 160: MEA Twist Tie Machines Market Y-o-Y Growth (%) Projections by Operating Speed, 2022-2032
Figure 161: MEA Twist Tie Machines Market Value (US$ Mn) Analysis by Application, 2017-2032
Figure 162: MEA Twist Tie Machines Market Volume (Units) Analysis by Application, 2017-2032
Figure 163: MEA Twist Tie Machines Market Value Share (%) and BPS Analysis by Application, 2022-2032
Figure 164: MEA Twist Tie Machines Market Y-o-Y Growth (%) Projections by Application, 2022-2032
Figure 165: MEA Twist Tie Machines Market Attractiveness by Machine Type, 2022-2032
Figure 166: MEA Twist Tie Machines Market Attractiveness by Operating Speed, 2022-2032
Figure 167: MEA Twist Tie Machines Market Attractiveness by Application, 2022-2032
Figure 168: MEA Twist Tie Machines Market Attractiveness by Country, 2022-2032
Need specific information?
Request CustomizationExplore Packaging Insights
View Reports