Reports

- Global Locations -

Headquarters

Future Market Insights, Inc.

Christiana Corporate, 200
Continental Drive, Suite 401,
Newark, Delaware - 19713,
United States

T: +1-845-579-5705

Americas

Future Market Insights, Inc.

616 Corporate Way, Suite 2-9018,
Valley Cottage, NY 10989, United States

T: +1-347-918-3531

MEA

Future Market Insights

1602-6 Jumeirah Bay X2 Tower, Plot No: JLT-PH2-X2A,
Jumeirah Lakes Towers, Dubai,
United Arab Emirates

Europe

Future Market Insights

3rd Floor, 207 Regent Street,
W1B 3HH London
United Kingdom

T: + 44 (0) 20 8123 9659
D: +44 (0) 20 3287 4268

Asia Pacific

Future Market Insights

IndiaLand Global Tech Park, Unit UG-1, Behind Grand HighStreet, Phase 1, Hinjawadi, MH, Pune – 411057, India

Antiepileptic Drugs Market Snapshot (2022 to 2032)

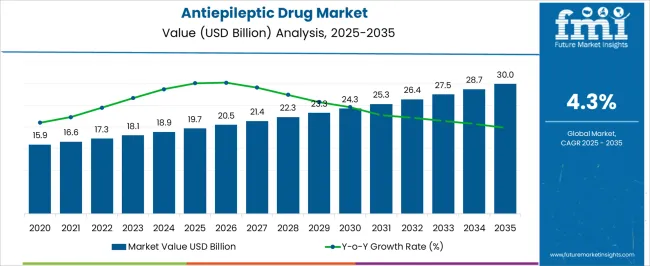
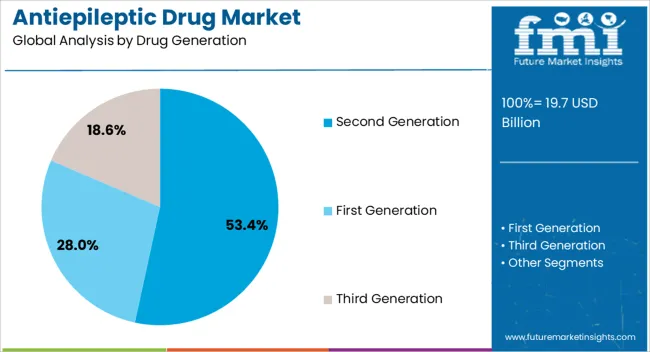
[263 Pages Report] The global antiepileptic drugs market is expected to enjoy a valuation of US$ 17.3 Billion by the end of the year 2022, and further expand at a CAGR of 4.3% to reach a valuation of ~US$ 26.2 Billion by the year 2032. According to a recent, study by Future Market Insights, second-generation drugs are leading the market with a share of about 53.4% in the year 2021, within the global market.

Market Outlook:

Data Points Market Insights
Market Value 2022 US$ 17.3 Billion
Market Value 2032 US$ 26.2 Billion
CAGR 2022-2032 4.3%
Market Share of Top 5 Countries 59.5%
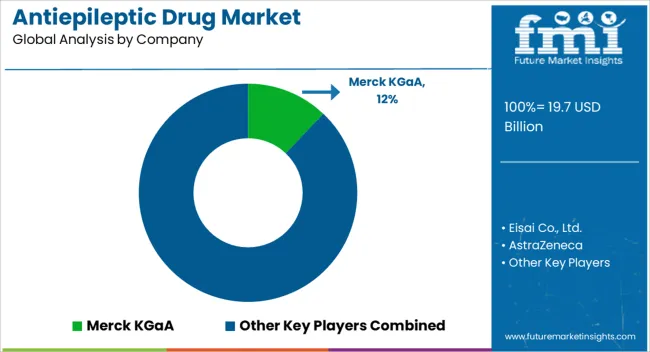
Key Market Players Merck KGaA, Eisai Co., Ltd., AstraZeneca, Novartis AG, Abbott, Teva Pharmaceutical Industries Ltd., Pfizer Inc., GlaxoSmithKline plc, Sanofi, Johnson & Johnson Service, Inc., and Dr. Reddy's Laboratories Ltd.

Epilepsy is a widespread neurological disorder that affects over 70 million individuals worldwide. While there are many different forms of epileptic seizures, including non-convulsive, convulsive, focal, and generalized seizures, epilepsy is not a single disease or syndrome. Rather, it is a diverse group of conditions. Antiepileptic drug (AED) therapy is the main treatment for this disorder, which is characterized by recurrent seizures. If epilepsy is properly identified and treated, around two-thirds of people can manage their seizures.

Don't pay for what you don't need

Customize your report by selecting specific countries or regions and save 30%!

Sales Analysis of Antiepileptic Drugs Market from 2012 to 2021 Vs Market Outlook for 2022 to 2032

The market value for antiepileptic drugs was approximately 20.8% of the overall ~US$ 79.4 Billion of the global neurological disorder drugs market in 2021.

The sale of antiepileptic drugs expanded at a CAGR of 4.4% from 2012 to 2021.

The growth of the global market for anti-epileptic medications is anticipated to be fuelled by the rising number of drugs that regulatory bodies are approving. Over the projection period, it is anticipated that rising epilepsy prevalence would fuel market expansion in regions such as Europe.

For example, the European Journal of Neurology reported in 2015 that there were an estimated 0.9 million children and adolescents with active epilepsy, with a prevalence of 4.5-5.0 per 1,000, and that there were an estimated 130,000 new cases of epilepsy among children and adolescents in Europe each year, with an incidence rate of 70 per 100,000.

Furthermore, the market is anticipated to increase over the forecast period due to the rise in the number of inorganic growth strategies, such as partnerships by major firms.

Thus, owing to the aforementioned factors, the global antiepileptic drugs market is expected to grow at a CAGR of 4.3% during the forecast period from 2022 to 2032.

Antiepileptic Drugs Market

What are the Key Opportunities for the Antiepileptic Drugs Manufacturers?

The International League Against Epilepsy (ILAE) refers to patients who do not respond to the combination of two carefully selected and administered anti-seizure medications (ASMs) as being "drug-resistant," which describes over 30% of epileptics who do not respond to widely known anti-seizure medications (ASMs).

In order to improve patient symptoms and their quality of life (QoL), as well as that of the caregivers, there is a great deal of responsibility placed on the research and development of novel pharmacological and non-pharmacological therapies with a focused approach.

A large clinical pipeline, as well as investigational studies for the development of novel antiepileptic drugs for pediatric and geriatric patients, will set the course for the opportunistic expansion of the overall antiepileptic drugs market.

Sabyasachi Ghosh
Sabyasachi Ghosh

Principal Consultant

Talk to Analyst

Find your sweet spots for generating winning opportunities in this market.

What are the Factors Restraining Demand for Antiepileptic Drugs?

The management of patients with epilepsy is hampered by the cognitive adverse effects of the medicine, disease, pharmacodynamics, and pharmacokinetics of antiepileptic drugs, all of which increase the likelihood of drug therapy complications in epileptic patients.

The majority of epileptic seizures can be controlled by making the most effective use of the AEDs that are currently available on the market. However, even with adequate therapy, roughly one-third of the cases remain uncontrolled. Because AEDs are complicated and epilepsy is a complex disease, drug therapy complications are frequent in people with epilepsy.

Patients who use AEDs may experience more drug interactions and drug toxicity due to the complexity of their medical conditions and prescriptions, which increases their chance of experiencing issues with their drug therapy and impairs their ability to control their seizures.

A drug therapy problem is an occurrence connected to medicine therapy that conflicts with the desired health outcome, either directly or indirectly. Drug therapy problems in patients with epilepsy are one of the major elements that influence the effectiveness of treatment and the reliability of medical care, thus hindering the market's overall growth.

Country-wise Insights

What Makes the US a Large Market for Antiepileptic Drugs?

The U.S. dominates the North American region with a total market share of about 76.7% in 2021 and is expected to continue to experience the same growth throughout the forecast period. This is owed to the presence of an advanced healthcare structure within the country, as well as the high prevalence of patients with epilepsy and related mood disorders.

What Makes China a Highly Lucrative Market for Antiepileptic Drugs?

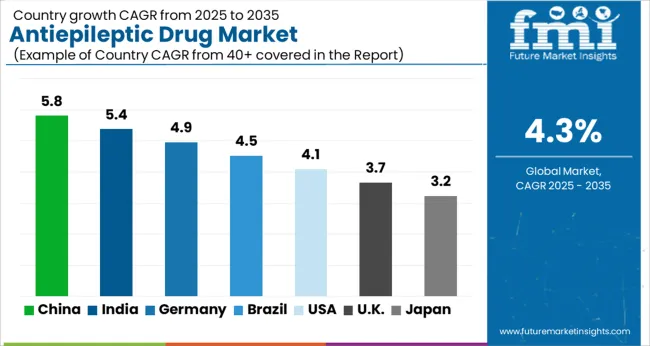
China holds approximately 64.6% share of the East Asia market in 2021 and is projected to display growth at a lucrative CAGR of 5.3% during the forecast period. There are around 10 million epileptics in China. There is a significant "epilepsy treatment gap" in China, which is mostly a result of societal discrimination brought on by cultural views on epilepsy and shortcomings in healthcare delivery. This factor brings about an opportunity for expansion within the country, by the key players in the antiepileptic drugs market, over the forecast period.

What is the Outlook of Germany in the Antiepileptic Drugs Market?

Germany is set to exhibit growth at a CAGR of nearly 4.1% in the global antiepileptic drugs market during the forecast period. The majority of adult patients with focal epilepsies in a real-world clinical context in Germany take antiepileptic medications as monotherapy, according to the German Society for Epileptology. A significant factor influencing the growth of the nation's overall market for antiepileptic drugs is the high adoption of these drugs.

Get the data you need at a Fraction of the cost

Personalize your report by choosing insights you need
and save 40%!

Category-wise Insights

Which Generation of Antiepileptic Drugs is Driving Market Growth?

Second-generation antiepileptic drugs are expected to present high growth at a CAGR of 3.9% throughout the forecast period. According to a number of clinical trials, the use of second-generation AEDs reduces the number of epilepsy-related inpatient visits with patients with far more comorbidities. Neurologists and physicians near epilepsy centers prescribe second-generation antiepileptic drugs more frequently than primary care physicians, giving this segment traction in terms of growth.

What is the Preferred Route of Administration for Antiepileptic Drugs?

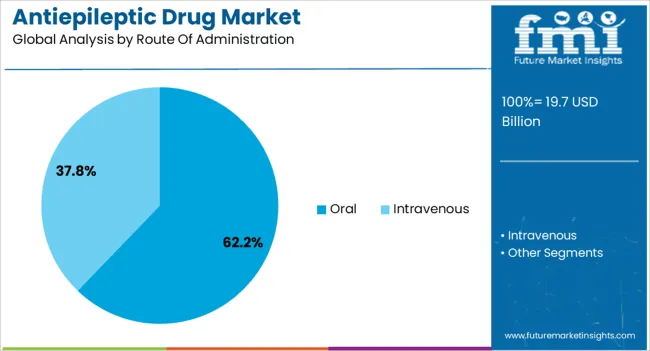
The oral route of administration holds a share of around 62.2% in 2021, and this segment is expected to display gradual growth over the forecast period. For the chronic treatment of epilepsy, antiepileptic medications are frequently administered orally. Epilepsy therapy calls for the administration of drugs for both acute and chronic conditions using a variety of formulations.

How have Retail Pharmacies Emerged as a Major Distribution Channel for Antiepileptic Drugs?

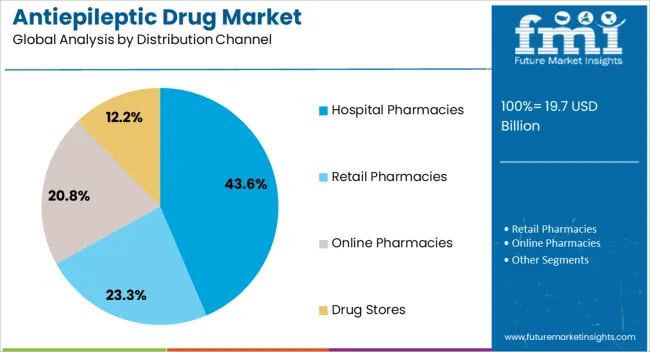
Retail pharmacies hold the highest market share value of 46.1% during the year 2021. With increased penetration of the products into the market, the availability of antiepileptic drugs in retail pharmacies has further propelled the sales growth of the overall market. Moreover, with the growing worldwide prevalence of epilepsy, the retail pharmacies segment is set to expand at a lucrative CAGR of 4.6% throughout the forecast period.

Competitive Landscape

The market is composed of a wide range of companies that are effectively competing for an increase in market share. They are either working with other businesses to achieve this goal or they are obtaining authorization from the government bodies to distribute the recently developed therapies to increase their geographic coverage.

  • In order to gain exclusive access to a library of early-stage small compounds that target the KCC2 transporter, including OV350 - the leading candidate - Ovid Therapeutics collaborated with AstraZeneca in January 2022.
  • In January 2019, the US Food and Drug Administration (FDA) approved the first generic version of Teva Pharmaceutical Industries' Sabril (vigabatrin) tablets for treating complex partial seizures as adjunctive therapy in patients aged 10 years and older who had not reacted well to various alternative treatments.

Similarly, recent developments related to companies manufacturing antiepileptic drugs have been tracked by the team at Future Market Insights, which are available in the full report.

Report Scope as per Antiepileptic Drugs Industry Analysis

Attribute Details
Historical Data Available for 2012 to 2021
Forecast Period 2022 to 2032
Market Analysis US$ Million for Value
Key Regions Covered North America, Latin America, Europe, South Asia, East Asia, Oceania, and Middle East & Africa
Key Countries Covered USA, Canada, Brazil, Mexico, Argentina, UK, Germany, Italy, Russia, Spain, France, BENELUX, India, Thailand, Indonesia, Malaysia, Japan, China, South Korea, Australia, New Zealand, Turkey, GCC Countries, North Africa, and South Africa
Key Market Segments Covered Drug Generation, Route of Administration, Distribution Channel, and Region
Key Companies Profiled
  • Merck KGaA
  • Eisai Co., Ltd.
  • AstraZeneca
  • Novartis AG
  • Abbott
  • Teva Pharmaceutical Industries Ltd.
  • Pfizer Inc.
  • GlaxoSmithKline plc
  • Sanofi
  • Johnson & Johnson Service, Inc.
  • Dr. Reddy's Laboratories Ltd.
Pricing Available upon Request

Key Market Segments Covered in Antiepileptic Drugs Industry Research

By Drug Generation:

  • First Generation
  • Second Generation
  • Third Generation

By Route of Administration:

  • Oral
  • Intravenous

By Distribution Channel:

  • Hospital Pharmacies
  • Retail Pharmacies
  • Online Pharmacies
  • Drug Stores

By Region:

  • North America
  • Latin America
  • Europe
  • South Asia
  • East Asia
  • Oceania
  • Middle East and Africa (MEA)

Frequently Asked Questions

How much is the antiepileptic drugs market estimated to be worth in 2022?

The global antiepileptic drugs market is set to reach a valuation of US$ 17.3 Bn in 2022 and is set to expand 1.5X over the next ten years.

What is the sales forecast for antiepileptic drugs through 2032?

The antiepileptic drugs market is expected to reach US$ 26.2 Bn by end of 2032 at a CAGR of 4.3%.

What are the trends driving the demand outlook of the global antiepileptic drugs market?

The growing geriatric population, rising burden of neurological diseases, and growing regulatory approvals for new products are some of the key trends in this market.

Which region has the highest market share in the global antiepileptic drugs market?

By region, North America holds the highest market share of around 43.6% by value, in 2021, in the global antiepileptic drugs market.

How likely is the antiepileptic drugs market to grow in Europe?

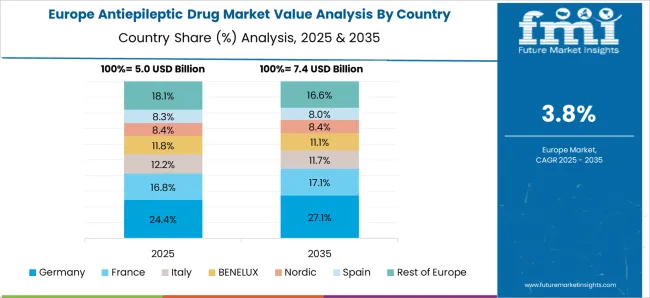
Europe accounts for about 23.4% of the global antiepileptic drugs market in 2021 and is projected to grow with a CAGR of 4.2% during the forecast period.

Which are the top five countries driving demand for antiepileptic drugs market?

The US, China, Japan, India, and Germany are the top five countries, which are expected to drive demand in the antiepileptic drugs market.

Who are the key manufacturers in the antiepileptic drugs market?

Merck KGaA, Eisai Co., Ltd., AstraZeneca, Novartis AG, Abbott, Teva Pharmaceutical Industries Ltd., Pfizer Inc., GlaxoSmithKline plc, Sanofi, Johnson & Johnson Service, Inc., and Dr. Reddy's Laboratories Ltd, are some of the key players in the antiepileptic drugs industry.

What was the last 9 years’ CAGR value growth for the antiepileptic drugs market?

From 2012 to 2021, the market for antiepileptic drugs expanded at the rate of 4.4%.

What are the key market statistics for South Asia in the antiepileptic drugs market?

The antiepileptic drugs market in South Asia is expected to grow at 4.9% CAGR during the forecast period.

What is the outlook of East Asia in the antiepileptic drugs market?

East Asia is set to present lucrative growth at a CAGR of 5.1% during the forecasted years.

Table of Content

1. Executive Summary | Antiepileptic Drugs Market

    1.1. Global Market Outlook

    1.2. Demand Side Trends

    1.3. Supply Side Trends

    1.4. Analysis and Recommendations

2. Market Overview

    2.1. Market Coverage / Taxonomy

    2.2. Market Definition / Scope / Limitations

    2.3. Inclusions and Exclusions

3. Key Market Trends

    3.1. Key Trends Impacting the Market

    3.2. Product Innovation / Development Trends

4. Key Success Factors

    4.1. Disease Epidemiology, by Region

    4.2. Pipeline Assessment

    4.3. Regulatory Landscape

    4.4. Novel Drug Approvals

    4.5. Patent Landscape

    4.6. PESTEL Analysis

    4.7. Porter’s Analysis

5. Market Background

    5.1. Macro-Economic Factors

        5.1.1. Global GDP Growth Outlook

        5.1.2. Global Healthcare Outlook

        5.1.3. Global Pharmaceutical Industry Outlook

    5.2. Forecast Factors - Relevance & Impact

        5.2.1. Rising Incidence of Mood Disorders

        5.2.2. High Prevalence of Epilepsy

        5.2.3. Growing Antiepileptic Drug Discovery and Development Activities

        5.2.4. Drug Generation Licensing and Commercialization

        5.2.5. Patent Protection

        5.2.6. Regulatory Scenario

        5.2.7. Reimbursement Scenario

        5.2.8. Adoption of Antiepileptic Drugs by Hospital Pharmacies

    5.3. Market Dynamics

        5.3.1. Drivers

        5.3.2. Restraints

        5.3.3. Opportunity Analysis

6. COVID-19 Crisis Analysis

    6.1. COVID-19 and Impact Analysis

        6.1.1. By Drug Generation

        6.1.2. By Route of Administration

        6.1.3. By Distribution Channel

        6.1.4. By Country

    6.2. 2021 Market Scenario

7. Global Market Demand (in Value or Size in US$ Million) Analysis 2012 to 2021 and Forecast, 2022 to 2032

    7.1. Historical Market Value (US$ Million) Analysis, 2012 to 2021

    7.2. Current and Future Market Value (US$ Million) Projections, 2022 to 2032

        7.2.1. Y-o-Y Growth Trend Analysis

        7.2.2. Absolute $ Opportunity Analysis

8. Global Market Analysis By Drug Generation 

    8.1. Introduction / Key Findings

    8.2. Historical Market Size (US$ Million) Analysis By Drug Generation, 2012 to 2021

    8.3. Current and Future Market Size (US$ Million) Analysis and Forecast By Drug Generation, 2022 to 2032

        8.3.1. First Generation

        8.3.2. Second Generation

        8.3.3. Third Generation

    8.4. Market Attractiveness Analysis By Drug Generation

9. Global Market Analysis By Route of Administration

    9.1. Introduction / Key Findings

    9.2. Historical Market Size (US$ Million) Analysis, By Route of Administration, 2012 to 2021

    9.3. Current and Future Market Size (US$ Million) Analysis and Forecast By Route of Administration, 2022 to 2032

        9.3.1. Oral

        9.3.2. Intravenous

    9.4. Market Attractiveness Analysis By Route of Administration

10. Global Market Analysis By Distribution Channel 

    10.1. Introduction / Key Findings

    10.2. Historical Market Size (US$ Million) Analysis, By Distribution Channel, 2012 to 2021

    10.3. Current and Future Market Size (US$ Million) Analysis and Forecast By Distribution Channel, 2022 to 2032

        10.3.1. Hospital Pharmacies

        10.3.2. Retail Pharmacies

        10.3.3. Online Pharmacies

        10.3.4. Drug Stores

    10.4. Market Attractiveness Analysis By Distribution Channel

11. Global Market Analysis By Region

    11.1. Introduction

    11.2. Historical Market Size (US$ Million) Analysis By Region, 2012 to 2021

    11.3. Current and Future Market Value (US$ Million) Analysis and Forecast, By Region 2022 to 2032

        11.3.1. North America

        11.3.2. Latin America

        11.3.3. Europe

        11.3.4. East Asia

        11.3.5. South Asia

        11.3.6. Oceania

        11.3.7. Middle East and Africa (MEA)

    11.4. Market Attractiveness Analysis By Region

12. North America Market Analysis 

    12.1. Introduction

    12.2. Historical Market Size (US$ Million) Trend Analysis By Market Taxonomy, 2012 to 2021

    12.3. Current and Future Market Value (US$ Million) Analysis and Forecast, By Market Taxonomy, 2022 to 2032

        12.3.1. By Country

            12.3.1.1. The USA

            12.3.1.2. Canada

        12.3.2. By Drug Generation

        12.3.3. By Route of Administration

        12.3.4. By Distribution Channel

    12.4. Market Attractiveness Analysis

        12.4.1. By Country

        12.4.2. By Drug Generation

        12.4.3. By Route of Administration

        12.4.4. By Distribution Channel

    12.5. Market Trends

    12.6. Drivers and Restraints - Impact Analysis

    12.7. Country-Level Analysis & Forecast

        12.7.1. U.S. Market Analysis

            12.7.1.1. Introduction

            12.7.1.2. Market Analysis and Forecast by Market Taxonomy

                12.7.1.2.1. By Drug Generation

                12.7.1.2.2. By Route of Administration

                12.7.1.2.3. By Distribution Channel

        12.7.2. Canada Market Analysis

            12.7.2.1. Introduction

            12.7.2.2. Market Analysis and Forecast by Market Taxonomy

                12.7.2.2.1. By Drug Generation

                12.7.2.2.2. By Route of Administration

                12.7.2.2.3. By Distribution Channel

13. Latin America Market Analysis 

    13.1. Introduction

    13.2. Historical Market Size (US$ Million) Trend Analysis By Market Taxonomy, 2012 to 2021

    13.3. Current and Future Market Value (US$ Million) Analysis and Forecast, By Market Taxonomy, 2022 to 2032

        13.3.1. By Country

            13.3.1.1. Mexico

            13.3.1.2. Brazil

            13.3.1.3. Argentina

            13.3.1.4. Rest of Latin America

        13.3.2. By Drug Generation

        13.3.3. By Route of Administration

        13.3.4. By Distribution Channel

    13.4. Market Attractiveness Analysis

        13.4.1. By Country

        13.4.2. By Drug Generation

        13.4.3. By Route of Administration

        13.4.4. By Distribution Channel

    13.5. Market Trends

    13.6. Drivers and Restraints - Impact Analysis

    13.7. Country-Level Analysis & Forecast

        13.7.1. Mexico Market Analysis

            13.7.1.1. Introduction

            13.7.1.2. Market Analysis and Forecast by Market Taxonomy

                13.7.1.2.1. By Drug Generation

                13.7.1.2.2. By Route of Administration

                13.7.1.2.3. By Distribution Channel

        13.7.2. Brazil Market Analysis

            13.7.2.1. Introduction

            13.7.2.2. Market Analysis and Forecast by Market Taxonomy

                13.7.2.2.1. By Drug Generation

                13.7.2.2.2. By Route of Administration

                13.7.2.2.3. By Distribution Channel

        13.7.3. Argentina Market Analysis

            13.7.3.1. Introduction

            13.7.3.2. Market Analysis and Forecast by Market Taxonomy

                13.7.3.2.1. By Drug Generation

                13.7.3.2.2. By Route of Administration

                13.7.3.2.3. By Distribution Channel

14. Europe Market Analysis 

    14.1. Introduction

    14.2. Historical Market Size (US$ Million) Trend Analysis By Market Taxonomy, 2012 to 2021

    14.3. Current and Future Market Value (US$ Million) Analysis and Forecast, By Market Taxonomy, 2022 to 2032

        14.3.1. By Country

            14.3.1.1. Germany

            14.3.1.2. Italy

            14.3.1.3. France

            14.3.1.4. The UK

            14.3.1.5. Spain

            14.3.1.6. BENELUX

            14.3.1.7. Russia

            14.3.1.8. Rest of Europe

        14.3.2. By Drug Generation

        14.3.3. By Route of Administration

        14.3.4. By Distribution Channel

    14.4. Market Attractiveness Analysis

        14.4.1. By Country

        14.4.2. By Drug Generation

        14.4.3. By Route of Administration

        14.4.4. By Distribution Channel

    14.5. Market Trends

    14.6. Drivers and Restraints - Impact Analysis

    14.7. Country-Level Analysis & Forecast

        14.7.1. Germany Market Analysis

            14.7.1.1. Introduction

            14.7.1.2. Market Analysis and Forecast by Market Taxonomy

                14.7.1.2.1. By Drug Generation

                14.7.1.2.2. By Route of Administration

                14.7.1.2.3. By Distribution Channel

        14.7.2. Italy Market Analysis

            14.7.2.1. Introduction

            14.7.2.2. Market Analysis and Forecast by Market Taxonomy

                14.7.2.2.1. By Drug Generation

                14.7.2.2.2. By Route of Administration

                14.7.2.2.3. By Distribution Channel

        14.7.3. France Market Analysis

            14.7.3.1. Introduction

            14.7.3.2. Market Analysis and Forecast by Market Taxonomy

                14.7.3.2.1. By Drug Generation

                14.7.3.2.2. By Route of Administration

                14.7.3.2.3. By Distribution Channel

        14.7.4. The UK Market Analysis

            14.7.4.1. Introduction

            14.7.4.2. Market Analysis and Forecast by Market Taxonomy

                14.7.4.2.1. By Drug Generation

                14.7.4.2.2. By Route of Administration

                14.7.4.2.3. By Distribution Channel

        14.7.5. Spain Market Analysis

            14.7.5.1. Introduction

            14.7.5.2. Market Analysis and Forecast by Market Taxonomy

                14.7.5.2.1. By Drug Generation

                14.7.5.2.2. By Route of Administration

                14.7.5.2.3. By Distribution Channel

        14.7.6. BENELUX Market Analysis

            14.7.6.1. Introduction

            14.7.6.2. Market Analysis and Forecast by Market Taxonomy

                14.7.6.2.1. By Drug Generation

                14.7.6.2.2. By Route of Administration

                14.7.6.2.3. By Distribution Channel

        14.7.7. Russia Market Analysis

            14.7.7.1. Introduction

            14.7.7.2. Market Analysis and Forecast by Market Taxonomy

                14.7.7.2.1. By Drug Generation

                14.7.7.2.2. By Route of Administration

                14.7.7.2.3. By Distribution Channel

15. East Asia Market Analysis 

    15.1. Introduction

    15.2. Historical Market Size (US$ Million) Trend Analysis By Market Taxonomy, 2012 to 2021

    15.3. Current and Future Market Value (US$ Million) Analysis and Forecast, By Market Taxonomy, 2022 to 2032

        15.3.1. By Country

            15.3.1.1. China

            15.3.1.2. Japan

            15.3.1.3. South Korea

        15.3.2. By Drug Generation

        15.3.3. By Route of Administration

        15.3.4. By Distribution Channel

    15.4. Market Attractiveness Analysis

        15.4.1. By Country

        15.4.2. By Drug Generation

        15.4.3. By Route of Administration

        15.4.4. By Distribution Channel

    15.5. Market Trends

    15.6. Drivers and Restraints - Impact Analysis

    15.7. Country-Level Analysis & Forecast

        15.7.1. China Market Analysis

            15.7.1.1. Introduction

            15.7.1.2. Market Analysis and Forecast by Market Taxonomy

                15.7.1.2.1. By Drug Generation

                15.7.1.2.2. By Route of Administration

                15.7.1.2.3. By Distribution Channel

        15.7.2. Japan Market Analysis

            15.7.2.1. Introduction

            15.7.2.2. Market Analysis and Forecast by Market Taxonomy

                15.7.2.2.1. By Drug Generation

                15.7.2.2.2. By Route of Administration

                15.7.2.2.3. By Distribution Channel

        15.7.3. South Korea Market Analysis

            15.7.3.1. Introduction

            15.7.3.2. Market Analysis and Forecast by Market Taxonomy

                15.7.3.2.1. By Drug Generation

                15.7.3.2.2. By Route of Administration

                15.7.3.2.3. By Distribution Channel

16. South Asia Market Analysis 

    16.1. Introduction

    16.2. Historical Market Size (US$ Million) Trend Analysis By Market Taxonomy, 2012 to 2021

    16.3. Current and Future Market Value (US$ Million) Analysis and Forecast, By Market Taxonomy, 2022 to 2032

        16.3.1. By Country

            16.3.1.1. India

            16.3.1.2. Indonesia

            16.3.1.3. Malaysia

            16.3.1.4. Thailand

            16.3.1.5. Rest of South Asia

        16.3.2. By Drug Generation

        16.3.3. By Route of Administration

        16.3.4. By Distribution Channel

    16.4. Market Attractiveness Analysis

        16.4.1. By Country

        16.4.2. By Drug Generation

        16.4.3. By Route of Administration

        16.4.4. By Distribution Channel

    16.5. Market Trends

    16.6. Drivers and Restraints - Impact Analysis

    16.7. Country-Level Analysis & Forecast

        16.7.1. India Market Analysis

            16.7.1.1. Introduction

            16.7.1.2. Market Analysis and Forecast by Market Taxonomy

                16.7.1.2.1. By Drug Generation

                16.7.1.2.2. By Route of Administration

                16.7.1.2.3. By Distribution Channel

        16.7.2. Indonesia Market Analysis

            16.7.2.1. Introduction

            16.7.2.2. Market Analysis and Forecast by Market Taxonomy

                16.7.2.2.1. By Drug Generation

                16.7.2.2.2. By Route of Administration

                16.7.2.2.3. By Distribution Channel

        16.7.3. Malaysia Market Analysis

            16.7.3.1. Introduction

            16.7.3.2. Market Analysis and Forecast by Market Taxonomy

                16.7.3.2.1. By Drug Generation

                16.7.3.2.2. By Route of Administration

                16.7.3.2.3. By Distribution Channel

        16.7.4. Thailand Market Analysis

            16.7.4.1. Introduction

            16.7.4.2. Market Analysis and Forecast by Market Taxonomy

                16.7.4.2.1. By Drug Generation

                16.7.4.2.2. By Route of Administration

                16.7.4.2.3. By Distribution Channel

17. Oceania Market Analysis 

    17.1. Introduction

    17.2. Historical Market Size (US$ Million) Trend Analysis By Market Taxonomy, 2012 to 2021

    17.3. Current and Future Market Value (US$ Million) Analysis and Forecast, By Market Taxonomy, 2022 to 2032

        17.3.1. By Country

            17.3.1.1. Australia

            17.3.1.2. New Zealand

        17.3.2. By Drug Generation

        17.3.3. By Route of Administration

        17.3.4. By Distribution Channel

    17.4. Market Attractiveness Analysis

        17.4.1. By Country

        17.4.2. By Drug Generation

        17.4.3. By Route of Administration

        17.4.4. By Distribution Channel

    17.5. Key Market Participants - Intensity Mapping

    17.6. Drivers and Restraints - Impact Analysis

    17.7. Country-Level Analysis & Forecast

        17.7.1. Australia Market Analysis

            17.7.1.1. Introduction

            17.7.1.2. Market Analysis and Forecast by Market Taxonomy

                17.7.1.2.1. By Drug Generation

                17.7.1.2.2. By Route of Administration

                17.7.1.2.3. By Distribution Channel

        17.7.2. New Zealand Market Analysis

            17.7.2.1. Introduction

            17.7.2.2. Market Analysis and Forecast by Market Taxonomy

                17.7.2.2.1. By Drug Generation

                17.7.2.2.2. By Route of Administration

                17.7.2.2.3. By Distribution Channel

18. Middle East and Africa (MEA) Market Analysis 

    18.1. Introduction

    18.2. Historical Market Size (US$ Million) Trend Analysis By Market Taxonomy, 2012 to 2021

    18.3. Current and Future Market Value (US$ Million) Analysis and Forecast, By Market Taxonomy, 2022 to 2032

        18.3.1. By Country

            18.3.1.1. GCC Countries

            18.3.1.2. Turkey

            18.3.1.3. North Africa

            18.3.1.4. South Africa

            18.3.1.5. Rest of Middle East and Africa

        18.3.2. By Drug Generation

        18.3.3. By Route of Administration

        18.3.4. By Distribution Channel

    18.4. Market Attractiveness Analysis

        18.4.1. By Country

        18.4.2. By Drug Generation

        18.4.3. By Route of Administration

        18.4.4. By Distribution Channel

    18.5. Market Trends

    18.6. Drivers and Restraints - Impact Analysis

    18.7. Country-Level Analysis & Forecast

        18.7.1. GCC Countries Market Analysis

            18.7.1.1. Introduction

            18.7.1.2. Market Analysis and Forecast by Market Taxonomy

                18.7.1.2.1. By Drug Generation

                18.7.1.2.2. By Route of Administration

                18.7.1.2.3. By Distribution Channel

        18.7.2. Turkey Market Analysis

            18.7.2.1. Introduction

            18.7.2.2. Market Analysis and Forecast by Market Taxonomy

                18.7.2.2.1. By Drug Generation

                18.7.2.2.2. By Route of Administration

                18.7.2.2.3. By Distribution Channel

        18.7.3. South Africa Market Analysis

            18.7.3.1. Introduction

            18.7.3.2. Market Analysis and Forecast by Market Taxonomy

                18.7.3.2.1. By Drug Generation

                18.7.3.2.2. By Route of Administration

                18.7.3.2.3. By Distribution Channel

        18.7.4. North Africa Market Analysis

            18.7.4.1. Introduction

            18.7.4.2. Market Analysis and Forecast by Market Taxonomy

                18.7.4.2.1. By Drug Generation

                18.7.4.2.2. By Route of Administration

                18.7.4.2.3. By Distribution Channel

19. Market Structure Analysis

    19.1. Market Analysis by Tier of Companies

    19.2. Market Share Analysis of Top Players

    19.3. Market Presence Analysis

20. Competition Analysis

    20.1. Competition Dashboard

    20.2. Competition Benchmarking

    20.3. Competition Deep Dive

        20.3.1. Merck KGaA

            20.3.1.1. Overview

            20.3.1.2. Product Portfolio

            20.3.1.3. Sales Footprint

            20.3.1.4. Key Financials

            20.3.1.5. SWOT Analysis

            20.3.1.6. Strategy Overview

        20.3.2. Eisai Co., Ltd.

            20.3.2.1. Overview

            20.3.2.2. Product Portfolio

            20.3.2.3. Sales Footprint

            20.3.2.4. Key Financials

            20.3.2.5. SWOT Analysis

            20.3.2.6. Strategy Overview

        20.3.3. AstraZeneca

            20.3.3.1. Overview

            20.3.3.2. Product Portfolio

            20.3.3.3. Sales Footprint

            20.3.3.4. Key Financials

            20.3.3.5. SWOT Analysis

            20.3.3.6. Strategy Overview

        20.3.4. Novartis AG

            20.3.4.1. Overview

            20.3.4.2. Product Portfolio

            20.3.4.3. Sales Footprint

            20.3.4.4. Key Financials

            20.3.4.5. SWOT Analysis

            20.3.4.6. Strategy Overview

        20.3.5. Abbott

            20.3.5.1. Overview

            20.3.5.2. Product Portfolio

            20.3.5.3. Sales Footprint

            20.3.5.4. Key Financials

            20.3.5.5. SWOT Analysis

            20.3.5.6. Strategy Overview

        20.3.6. Teva Pharmaceutical Industries Ltd.

            20.3.6.1. Overview

            20.3.6.2. Product Portfolio

            20.3.6.3. Sales Footprint

            20.3.6.4. Key Financials

            20.3.6.5. SWOT Analysis

            20.3.6.6. Strategy Overview

        20.3.7. Pfizer Inc.

            20.3.7.1. Overview

            20.3.7.2. Product Portfolio

            20.3.7.3. Sales Footprint

            20.3.7.4. Key Financials

            20.3.7.5. SWOT Analysis

            20.3.7.6. Strategy Overview

        20.3.8. GlaxoSmithKline plc

            20.3.8.1. Overview

            20.3.8.2. Product Portfolio

            20.3.8.3. Sales Footprint

            20.3.8.4. Key Financials

            20.3.8.5. SWOT Analysis

            20.3.8.6. Strategy Overview

        20.3.9. Sanofi

            20.3.9.1. Overview

            20.3.9.2. Product Portfolio

            20.3.9.3. Sales Footprint

            20.3.9.4. Key Financials

            20.3.9.5. SWOT Analysis

            20.3.9.6. Strategy Overview

        20.3.10. Johnson & Johnson Service, Inc.

            20.3.10.1. Overview

            20.3.10.2. Product Portfolio

            20.3.10.3. Sales Footprint

            20.3.10.4. Key Financials

            20.3.10.5. SWOT Analysis

            20.3.10.6. Strategy Overview

        20.3.11. Dr. Reddy's Laboratories Ltd.

            20.3.11.1. Overview

            20.3.11.2. Product Portfolio

            20.3.11.3. Sales Footprint

            20.3.11.4. Key Financials

            20.3.11.5. SWOT Analysis

            20.3.11.6. Strategy Overview

21. Assumptions and Acronyms Used

22. Research Methodology

Don't pay for what you don't need

Customize your report by selecting specific countries or regions and save 30%!

List of Tables

Table 01: Global Market Analysis 2012 to 2021 and Forecast 2022 to 2032, by Drug Generation

Table 02: Global Market Analysis 2012 to 2021 and Forecast 2022 to 2032 by Route of Administration

Table 03: Global Market Analysis 2012 to 2021 and Forecast 2022 to 2032, by Distribution Channel

Table 04: Global Market Analysis 2012 to 2021 and Forecast 2022 to 2032, by Region

Table 05: North America Market Value (US$ Million) Analysis 2012 to 2021 and Forecast 2022 to 2032, by Country

Table 06: North America Market Value (US$ Million) Analysis 2012 to 2021 and Forecast 2022 to 2032, by Drug Generation

Table 07: North America Market Value (US$ Million) Analysis 2012 to 2021 and Forecast 2022 to 2032, by Route of Administration

Table 08: North America Market Value (US$ Million) Analysis 2012 to 2021 and Forecast 2022 to 2032, by Distribution Channel

Table 09: Latin America Market Value (US$ Million) Analysis 2012 to 2021 and Forecast 2022 to 2032, by Country

Table 10: Latin America Market Value (US$ Million) Analysis 2012 to 2021 and Forecast 2022 to 2032, by Drug Generation

Table 11: Latin America Market Value (US$ Million) Analysis 2012 to 2021 and Forecast 2022 to 2032, by Route of Administration

Table 12: Latin America Market Value (US$ Million) Analysis 2012 to 2021 and Forecast 2022 to 2032, by Distribution Channel

Table 13: Europe Market Value (US$ Million) Analysis 2012 to 2021 and Forecast 2022 to 2032, by Country

Table 14: Europe Market Value (US$ Million) Analysis 2012 to 2021 and Forecast 2022 to 2032, by Drug Generation

Table 15: Europe Market Analysis 2012 to 2021 and Forecast 2022 to 2032by Route of Administration

Table 16: Europe Market Value (US$ Million) Analysis 2012 to 2021 and Forecast 2022 to 2032, by Distribution Channel

Table 17: East Asia Market Value (US$ Million) Analysis 2012 to 2021 and Forecast 2022 to 2032, by Country

Table 18: East Asia Market Value (US$ Million) Analysis 2012 to 2021 and Forecast 2022 to 2032, by Drug Generation

Table 19: East Asia Market Value (US$ Million) Analysis 2012 to 2021 and Forecast 2022 to 2032, by Route of Administration

Table 20: East Asia Market Value (US$ Million) Analysis 2012 to 2021 and Forecast 2022 to 2032, by Distribution Channel

Table 21: South Asia Market Value (US$ Million) Analysis 2012 to 2021 and Forecast 2022 to 2032, by Country

Table 22: South Asia Market Value (US$ Million) Analysis 2012 to 2021 and Forecast 2022 to 2032, by Drug Generation

Table 23: South Asia Market Value (US$ Million) Analysis 2012 to 2021 and Forecast 2022 to 2032, by Route of Administration

Table 24: South Asia Market Value (US$ Million) Analysis 2012 to 2021 and Forecast 2022 to 2032, by Distribution Channel

Table 25: Oceania Market Value (US$ Million) Analysis 2012 to 2021 and Forecast 2022 to 2032, by Country

Table 26: Oceania Market Value (US$ Million) Analysis 2012 to 2021 and Forecast 2022 to 2032, by Drug Generation

Table 27: Oceania Market Analysis 2012 to 2021 and Forecast 2022 to 2032by Route of Administration

Table 28: Oceania Market Value (US$ Million) Analysis 2012 to 2021 and Forecast 2022 to 2032, by Distribution Channel

Table 29: Middle East & Africa Market Value (US$ Million) Analysis 2012 to 2021 and Forecast 2022 to 2032, by Country

Table 30: Middle East & Africa Market Value (US$ Million) Analysis 2012 to 2021 and Forecast 2022 to 2032, by Drug Generation

Table 31: Middle East & Africa Market Analysis 2012 to 2021 and Forecast 2022 to 2032by Route of Administration

Table 32: Middle East & Africa Market Value (US$ Million) Analysis 2012 to 2021 and Forecast 2022 to 2032, by Distribution Channel
Sabyasachi Ghosh
Sabyasachi Ghosh

Principal Consultant

Talk to Analyst

Find your sweet spots for generating winning opportunities in this market.

List of Charts

Figure 01: Global Market Value (US$ Million) Analysis, 2012 to 2021

Figure 02: Global Market Forecast & Y-o-Y Growth, 2022 to 2032

Figure 03: Global Market Absolute $ Opportunity (US$ Million) Analysis, 2021 to 2032

Figure 04: Global Market Value Share (%) Analysis 2022 and 2032, by Drug Generation

Figure 05: Global Market Y-o-Y Growth (%) Analysis 2021-2032, by Drug Generation

Figure 06: Global Market Attractiveness Analysis 2022 to 2032, by Drug Generation

Figure 07: Global Market Value Share (%) Analysis 2022 and 2032, by Route of Administration

Figure 08: Global Market Y-o-Y Growth (%) Analysis 2021-2032, by Route of Administration

Figure 09: Global Market Attractiveness Analysis 2022 to 2032, by Route of Administration

Figure 10: Global Market Value Share (%) Analysis 2022 and 2032, by Distribution Channel

Figure 11: Global Market Y-o-Y Growth (%) Analysis 2021-2032, by Distribution Channel

Figure 12: Global Market Attractiveness Analysis 2022 to 2032, by Distribution Channel

Figure 13: Global Market Value Share (%) Analysis 2022 and 2032, by Region

Figure 14: Global Market Y-o-Y Growth (%) Analysis 2021-2032, by Region

Figure 15: Global Market Attractiveness Analysis 2022 to 2032, by Region

Figure 16: North America Market Value (US$ Million) Analysis, 2012 to 2021

Figure 17: North America Market Value (US$ Million) Forecast, 2022-2032

Figure 18: North America Market Value Share, by Drug Generation (2022 E)

Figure 19: North America Market Value Share, by Route of Administration (2022 E)

Figure 20: North America Market Value Share, by Distribution Channel (2022 E)

Figure 21: North America Market Value Share, by Country (2022 E)

Figure 22: North America Market Attractiveness Analysis by Drug Generation, 2022 to 2032

Figure 23: North America Market Attractiveness Analysis by Route of Administration, 2022 to 2032

Figure 24: North America Market Attractiveness Analysis by Distribution Channel, 2022 to 2032

Figure 25: North America Market Attractiveness Analysis by Country, 2022 to 2032

Figure 26: U.S. Market Value Proportion Analysis, 2021

Figure 27: Global Vs. U.S. Growth Comparison

Figure 28: U.S. Market Share Analysis (%) by Drug Generation, 2021 to 2032

Figure 29: U.S. Market Share Analysis (%) by Route of Administration, 2021 to 2032

Figure 30: U.S. Market Share Analysis (%) by Distribution Channel, 2021 to 2032

Figure 31: Canada Market Value Proportion Analysis, 2021

Figure 32: Global Vs. Canada. Growth Comparison

Figure 33: Canada Market Share Analysis (%) by Drug Generation, 2021 to 2032

Figure 34: Canada Market Share Analysis (%) by Route of Administration, 2021 to 2032

Figure 35: Canada Market Share Analysis (%) by Distribution Channel, 2021 to 2032

Figure 36: Latin America Market Value (US$ Million) Analysis, 2012 to 2021

Figure 37: Latin America Market Value (US$ Million) Forecast, 2022-2032

Figure 38: Latin America Market Value Share, by Drug Generation (2022 E)

Figure 39: Latin America Market Value Share, by Route of Administration (2022 E)

Figure 40: Latin America Market Value Share, by Distribution Channel (2022 E)

Figure 41: Latin America Market Value Share, by Country (2022 E)

Figure 42: Latin America Market Attractiveness Analysis by Drug Generation, 2022 to 2032

Figure 43: Latin America Market Attractiveness Analysis by Route of Administration, 2022 to 2032

Figure 44: Latin America Market Attractiveness Analysis by Distribution Channel, 2022 to 2032

Figure 45: Latin America Market Attractiveness Analysis by Country, 2022 to 2032

Figure 46: Mexico Market Value Proportion Analysis, 2021

Figure 47: Global Vs Mexico Growth Comparison

Figure 48: Mexico Market Share Analysis (%) by Drug Generation, 2021 to 2032

Figure 49: Mexico Market Share Analysis (%) by Route of Administration, 2021 to 2032

Figure 50: Mexico Market Share Analysis (%) by Distribution Channel, 2021 to 2032

Figure 51: Brazil Market Value Proportion Analysis, 2021

Figure 52: Global Vs. Brazil. Growth Comparison

Figure 53: Brazil Market Share Analysis (%) by Drug Generation, 2021 to 2032

Figure 54: Brazil Market Share Analysis (%) by Route of Administration, 2021 to 2032

Figure 55: Brazil Market Share Analysis (%) by Distribution Channel, 2021 to 2032

Figure 56: Argentina Market Value Proportion Analysis, 2021

Figure 57: Global Vs Argentina Growth Comparison

Figure 58: Argentina Market Share Analysis (%) by Drug Generation, 2021 to 2032

Figure 59: Argentina Market Share Analysis (%) by Route of Administration, 2021 to 2032

Figure 60: Argentina Market Share Analysis (%) by Distribution Channel, 2021 to 2032

Figure 61: Europe Market Value (US$ Million) Analysis, 2012 to 2021

Figure 62: Europe Market Value (US$ Million) Forecast, 2022-2032

Figure 63: Europe Market Value Share, by Drug Generation (2022 E)

Figure 64: Europe Market Value Share, by Route of Administration (2022 E)

Figure 65: Europe Market Value Share, by Distribution Channel (2022 E)

Figure 66: Europe Market Value Share, by Country (2022 E)

Figure 67: Europe Market Attractiveness Analysis by Drug Generation, 2022 to 2032

Figure 68: Europe Market Attractiveness Analysis by Route of Administration, 2022 to 2032

Figure 69: Europe Market Attractiveness Analysis by Distribution Channel, 2022 to 2032

Figure 70: Europe Market Attractiveness Analysis by Country, 2022 to 2032

Figure 71: UK Market Value Proportion Analysis, 2021

Figure 72: Global Vs. UK Growth Comparison

Figure 73: UK Market Share Analysis (%) by Drug Generation, 2021 to 2032

Figure 74: UK Market Share Analysis (%) by Route of Administration, 2021 to 2032

Figure 75: UK Market Share Analysis (%) by Distribution Channel, 2021 to 2032

Figure 76: Germany Market Value Proportion Analysis, 2021

Figure 77: Global Vs. Germany Growth Comparison

Figure 78: Germany Market Share Analysis (%) by Drug Generation, 2021 to 2032

Figure 79: Germany Market Share Analysis (%) by Route of Administration, 2021 to 2032

Figure 80: Germany Market Share Analysis (%) by Distribution Channel, 2021 to 2032

Figure 81: Italy Market Value Proportion Analysis, 2021

Figure 82: Global Vs. Italy Growth Comparison

Figure 83: Italy Market Share Analysis (%) by Drug Generation, 2021 to 2032

Figure 84: Italy Market Share Analysis (%) by Route of Administration, 2021 to 2032

Figure 85: Italy Market Share Analysis (%) by Distribution Channel, 2021 to 2032

Figure 86: France Market Value Proportion Analysis, 2021

Figure 87: Global Vs France Growth Comparison

Figure 88: France Market Share Analysis (%) by Drug Generation, 2021 to 2032

Figure 89: France Market Share Analysis (%) by Route of Administration, 2021 to 2032

Figure 90: France Market Share Analysis (%) by Distribution Channel, 2021 to 2032

Figure 91: Spain Market Value Proportion Analysis, 2021

Figure 92: Global Vs Spain Growth Comparison

Figure 93: Spain Market Share Analysis (%) by Drug Generation, 2021 to 2032

Figure 94: Spain Market Share Analysis (%) by Route of Administration, 2021 to 2032

Figure 95: Spain Market Share Analysis (%) by Distribution Channel, 2021 to 2032

Figure 96: Russia Market Value Proportion Analysis, 2021

Figure 97: Global Vs Russia Growth Comparison

Figure 98: Russia Market Share Analysis (%) by Drug Generation, 2021 to 2032

Figure 99: Russia Market Share Analysis (%) by Route of Administration, 2021 to 2032

Figure 100: Russia Market Share Analysis (%) by Distribution Channel, 2021 to 2032

Figure 101: BENELUX Market Value Proportion Analysis, 2021

Figure 102: Global Vs BENELUX Growth Comparison

Figure 103: BENELUX Market Share Analysis (%) by Drug Generation, 2021 to 2032

Figure 104: BENELUX Market Share Analysis (%) by Route of Administration, 2021 to 2032

Figure 105: BENELUX Market Share Analysis (%) by Distribution Channel, 2021 to 2032

Figure 106: East Asia Market Value (US$ Million) Analysis, 2012 to 2021

Figure 107: East Asia Market Value (US$ Million) Forecast, 2022-2032

Figure 108: East Asia Market Value Share, by Drug Generation (2022 E)

Figure 109: East Asia Market Value Share, by Route of Administration (2022 E)

Figure 110: East Asia Market Value Share, by Distribution Channel (2022 E)

Figure 111: East Asia Market Value Share, by Country (2022 E)

Figure 112: East Asia Market Attractiveness Analysis by Drug Generation, 2022 to 2032

Figure 113: East Asia Market Attractiveness Analysis by Route of Administration, 2022 to 2032

Figure 114: East Asia Market Attractiveness Analysis by Distribution Channel, 2022 to 2032

Figure 115: East Asia Market Attractiveness Analysis by Country, 2022 to 2032

Figure 116: China Market Value Proportion Analysis, 2021

Figure 117: Global Vs. China Growth Comparison

Figure 118: China Market Share Analysis (%) by Drug Generation, 2021 to 2032

Figure 119: China Market Share Analysis (%) by Route of Administration, 2021 to 2032

Figure 120: China Market Share Analysis (%) by Distribution Channel, 2021 to 2032

Figure 121: Japan Market Value Proportion Analysis, 2021

Figure 122: Global Vs. Japan Growth Comparison

Figure 123: Japan Market Share Analysis (%) by Drug Generation, 2021 to 2032

Figure 124: Japan Market Share Analysis (%) by Route of Administration, 2021 to 2032

Figure 125: Japan Market Share Analysis (%) by Distribution Channel, 2021 to 2032

Figure 126: South Korea Market Value Proportion Analysis, 2021

Figure 127: Global Vs South Korea Growth Comparison

Figure 128: South Korea Market Share Analysis (%) by Drug Generation, 2021 to 2032

Figure 129: South Korea Market Share Analysis (%) by Route of Administration, 2021 to 2032

Figure 130: South Korea Market Share Analysis (%) by Distribution Channel, 2021 to 2032

Figure 131: South Asia Market Value (US$ Million) Analysis, 2012 to 2021

Figure 132: South Asia Market Value (US$ Million) Forecast, 2022-2032

Figure 133: South Asia Market Value Share, by Drug Generation (2022 E)

Figure 134: South Asia Market Value Share, by Route of Administration (2022 E)

Figure 135: South Asia Market Value Share, by Distribution Channel (2022 E)

Figure 136: South Asia Market Value Share, by Country (2022 E)

Figure 137: South Asia Market Attractiveness Analysis by Drug Generation, 2022 to 2032

Figure 138: South Asia Market Attractiveness Analysis by Route of Administration, 2022 to 2032

Figure 139: South Asia Market Attractiveness Analysis by Distribution Channel, 2022 to 2032

Figure 140: South Asia Market Attractiveness Analysis by Country, 2022 to 2032

Figure 141: India Market Value Proportion Analysis, 2021

Figure 142: Global Vs. India Growth Comparison

Figure 143: India Market Share Analysis (%) by Drug Generation, 2021 to 2032

Figure 144: India Market Share Analysis (%) by Route of Administration, 2021 to 2032

Figure 145: India Market Share Analysis (%) by Distribution Channel, 2021 to 2032

Figure 146: Indonesia Market Value Proportion Analysis, 2021

Figure 147: Global Vs. Indonesia Growth Comparison

Figure 148: Indonesia Market Share Analysis (%) by Drug Generation, 2021 to 2032

Figure 149: Indonesia Market Share Analysis (%) by Route of Administration, 2021 to 2032

Figure 150: Indonesia Market Share Analysis (%) by Distribution Channel, 2021 to 2032

Figure 151: Malaysia Market Value Proportion Analysis, 2021

Figure 152: Global Vs. Malaysia Growth Comparison

Figure 153: Malaysia Market Share Analysis (%) by Drug Generation, 2021 to 2032

Figure 154: Malaysia Market Share Analysis (%) by Route of Administration, 2021 to 2032

Figure 155: Malaysia Market Share Analysis (%) by Distribution Channel, 2021 to 2032

Figure 156: Thailand Market Value Proportion Analysis, 2021

Figure 157: Global Vs. Thailand Growth Comparison

Figure 158: Thailand Market Share Analysis (%) by Drug Generation, 2021 to 2032

Figure 159: Thailand Market Share Analysis (%) by Route of Administration, 2021 to 2032

Figure 160: Thailand Market Share Analysis (%) by Distribution Channel, 2021 to 2032

Figure 161: Oceania Market Value (US$ Million) Analysis, 2012 to 2021

Figure 162: Oceania Market Value (US$ Million) Forecast, 2022-2032

Figure 163: Oceania Market Value Share, by Drug Generation (2022 E)

Figure 164: Oceania Market Value Share, by Route of Administration (2022 E)

Figure 165: Oceania Market Value Share, by Distribution Channel (2022 E)

Figure 166: Oceania Market Value Share, by Country (2022 E)

Figure 167: Oceania Market Attractiveness Analysis by Drug Generation, 2022 to 2032

Figure 168: Oceania Market Attractiveness Analysis by Route of Administration, 2022 to 2032

Figure 169: Oceania Market Attractiveness Analysis by Distribution Channel, 2022 to 2032

Figure 170: Oceania Market Attractiveness Analysis by Country, 2022 to 2032

Figure 171: Australia Market Value Proportion Analysis, 2021

Figure 172: Global Vs. Australia Growth Comparison

Figure 173: Australia Market Share Analysis (%) by Drug Generation, 2021 to 2032

Figure 174: Australia Market Share Analysis (%) by Route of Administration, 2021 to 2032

Figure 175: Australia Market Share Analysis (%) by Distribution Channel, 2021 to 2032

Figure 176: New Zealand Market Value Proportion Analysis, 2021

Figure 177: Global Vs New Zealand Growth Comparison

Figure 178: New Zealand Market Share Analysis (%) by Drug Generation, 2021 to 2032

Figure 179: New Zealand Market Share Analysis (%) by Route of Administration, 2021 to 2032

Figure 180: New Zealand Market Share Analysis (%) by Distribution Channel, 2021 to 2032

Figure 181: Middle East & Africa Market Value (US$ Million) Analysis, 2012 to 2021

Figure 182: Middle East & Africa Market Value (US$ Million) Forecast, 2022-2032

Figure 183: Middle East & Africa Market Value Share, by Drug Generation (2022 E)

Figure 184: Middle East & Africa Market Value Share, by Route of Administration (2022 E)

Figure 185: Middle East & Africa Market Value Share, by Distribution Channel (2022 E)

Figure 186: Middle East & Africa Market Value Share, by Country (2022 E)

Figure 187: Middle East & Africa Market Attractiveness Analysis by Drug Generation, 2022 to 2032

Figure 188: Middle East & Africa Market Attractiveness Analysis by Route of Administration, 2022 to 2032

Figure 189: Middle East & Africa Market Attractiveness Analysis by Distribution Channel, 2022 to 2032

Figure 190: Middle East & Africa Market Attractiveness Analysis by Country, 2022 to 2032

Figure 191: GCC Countries Market Value Proportion Analysis, 2021

Figure 192: Global Vs GCC Countries Growth Comparison

Figure 193: GCC Countries Market Share Analysis (%) by Drug Generation, 2021 to 2032

Figure 194: GCC Countries Market Share Analysis (%) by Route of Administration, 2021 to 2032

Figure 195: GCC Countries Market Share Analysis (%) by Distribution Channel, 2021 to 2032

Figure 196: Turkey Market Value Proportion Analysis, 2021

Figure 197: Global Vs. Turkey Growth Comparison

Figure 198: Turkey Market Share Analysis (%) by Drug Generation, 2021 to 2032

Figure 199: Turkey Market Share Analysis (%) by Route of Administration, 2021 to 2032

Figure 200: Turkey Market Share Analysis (%) by Distribution Channel, 2021 to 2032

Figure 201: South Africa Market Value Proportion Analysis, 2021

Figure 202: Global Vs. South Africa Growth Comparison

Figure 203: South Africa Market Share Analysis (%) by Drug Generation, 2021 to 2032

Figure 204: South Africa Market Share Analysis (%) by Route of Administration, 2021 to 2032

Figure 205: South Africa Market Share Analysis (%) by Distribution Channel, 2021 to 2032

Figure 206: North Africa Market Value Proportion Analysis, 2021

Figure 207: Global Vs North Africa Growth Comparison

Figure 208: North Africa Market Share Analysis (%) by Drug Generation, 2021 to 2032

Figure 209: North Africa Market Share Analysis (%) by Route of Administration, 2021 to 2032

Figure 210: North Africa Market Share Analysis (%) by Distribution Channel, 2021 to 2032

Recommendations

Healthcare

Neurointerventional Device Market

Published : October 2023

Healthcare

Epilepsy Monitoring Devices Market

Published : April 2023

Healthcare

Neurodegenerative Disease Market

Published : June 2022

Explore Healthcare Insights

View Reports

Antiepileptic Drugs Market