Twist-to-Activate Tubes Market Size and Share Forecast Outlook 2025 to 2035

The twist-to-activate tubes market is projected to reach a valuation of USD 2.9 billion in 2025 and is expected to grow to USD 3.9 billion by 2035, reflecting a net addition of USD 1.0 billion over the ten-year period. This equates to a 34.5% total increase, with a compound annual growth rate (CAGR) of 3.1%. The market expands by a 1.3 multiple over the forecast timeline.
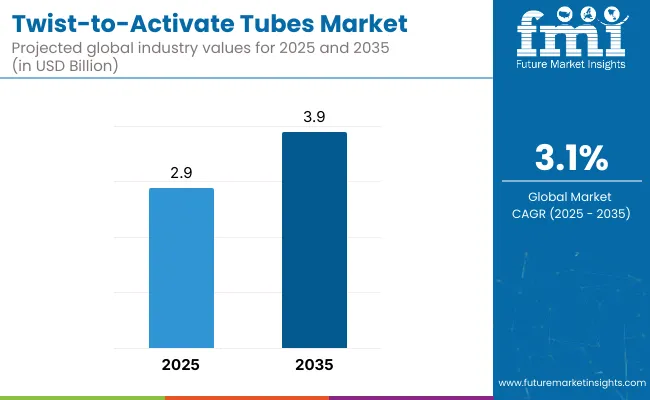
Quick Stats for Twist-to-Activate Tubes Market

  • Market Value (2025): USD 2.9 billion
  • Market Forecast Value (2035): USD 3.9 billion
  • Market Forecast CAGR: 3.1%
  • Leading Segment in 2025: Plastic (61.3%)
  • Key Growth Regions: Asia Pacific (Indiais the fastest-growing market with 6.5% CAGR)
  • Top Key Players: Neopac, C. L. Smith, Albéa, Kaufman Container, Berry Global, Rose Plastics, Alltub, Kansai Tube Co., LTD, TAKEMOTO, GuangZhouHuaXin Plastic Product Co., Ltd.

Twist To Activate Tubes Market

Metric Value
Industry Size (2025E) USD 2.9 billion
Industry Value (2035F) USD 3.9 billion
CAGR (2025 to 2035) 3.1%

During the initial five-year phase from 2025 to 2030, the market rises from USD 2.9 billion to USD 3.3 billion, adding USD 0.4 billion, which represents 40.2% of the overall decade growth. Growth in this stage is driven by demand for unit-dose delivery formats in personal care, cosmetics, and topical pharmaceuticals. Convenience, hygiene, and accurate dispensing play a pivotal role, especially for serums, gels, and travel-sized medical ointments.

In the latter half from 2030 to 2035, the market climbs from USD 3.3 billion to USD 3.9 billion, contributing USD 0.6 billion, or 60.0% of the decade’s growth. The surge in premium packaging innovations, along with expansion into emerging markets and adoption for functional nutraceutical creams and active skincare, fuels this upward shift. Recyclable and bio-based polymer tubes with integrated activation mechanisms also gain popularity, aligning with sustainability trends and regulatory shifts.

From 2020 to 2024, the twist-to-activate tubes market grew from USD 410 million to USD 690 million, driven by hardware-centric adoption in personal care, cosmetics, pharmaceutical, and OTC product packaging. During this period, the competitive landscape was dominated by tube and closure manufacturers controlling nearly 70% of revenue, with leaders such as Neopac, Albéa, Berry Global, and Alltub focusing on precision-engineered tube systems that enable user-controlled dispensing and enhanced product protection.

Competitive differentiation relied on tamper-evidence, controlled flow, and barrier integrity, while smart dispensing mechanisms were bundled as an auxiliary offering rather than a core revenue stream. Service-based models had limited uptake, contributing less than 10% of the total market value, as manufacturers emphasized functionality and shelf appeal over post-sale engagement.

Demand for twist-to-activate tubes will expand to USD 3.3 billion in 2030, and the revenue mix will shift as integrated dispensing technologies and design services grow to over 40.2% share. Traditional tube manufacturers face rising competition from digital-first packaging innovators offering smart closures, dosage-tracking components, and sustainability-focused modular solutions. Major hardware vendors are pivoting to hybrid models, integrating recyclable materials, twist-lock safety mechanisms, and personalization-ready features to retain relevance.

Emerging entrants such as C. L. Smith, Kaufman Container, Kansai Tube Co., LTD, TAKEMOTO, and GuangZhouHuaXin Plastic Product Co., Ltd are gaining share by specializing in recyclable mono-material tubes, airless dispensing variants, and application-specific twist formats. The competitive advantage is moving away from static design innovation to full-system customization, sustainability leadership, and recurring value-added service streams.

Why the Twist-to-Activate Tubes Market is growing?

Demand for convenient, hygienic, and single-use packaging formats in cosmetics, pharmaceuticals, and personal care products is driving the growth of the twist-to-activate tubes market. These tubes allow consumers to activate and dispense a formula such as gels, creams, or serums by a simple twist mechanism, ensuring precise application and minimizing product contamination. Increasing focus on user-friendly dispensing solutions and premium packaging aesthetics is accelerating adoption across both mass and luxury brands.

Dual-compartment twist-to-activate formats have gained popularity due to their ability to keep ingredients separate until use, preserving product potency and extending shelf life. These tubes are especially effective for active formulations like vitamin C, retinol, or hair colorants that require activation at the point of application. The combination of ease-of-use and portion control supports consumer satisfaction and brand differentiation in competitive markets.

Industries such as dermocosmetics, clinical skincare, OTC pharmaceuticals, and wellness are driving demand for packaging that ensures dosing precision, tamper-resistance, and intuitive use. These tubes support evolving consumer preferences for experiential packaging and enhance compliance in daily skincare or treatment regimens.

Segment growth is expected to be led by dual-chamber tube formats, personal care applications in end-use segments, and recyclable or biodegradable materials due to sustainability demands, functional integrity, and alignment with premium brand positioning.

Segmental Analysis

The market is segmented by material type, tube capacity, application, and region. Material type includes plastic (PE, PP, PET, HDPE, LDPE), aluminum, laminated (plastic + aluminum), and biodegradable/compostable materials, each offering specific benefits in terms of barrier protection, recyclability, and sustainability.

Tube capacity segmentation consists of less than 5 ml, 5 ml to 15 ml, 16 ml to 30 ml, 31 ml to 50 ml, and above 50 ml, accommodating various dosage and usage frequency preferences. Application areas cover pharmaceuticals (ointments, topical drugs, gels), cosmetics & personal care (serums, lotions, anti-aging creams), and oral care (whitening gels, fluoride gels), reflecting growing demand for hygienic, single-use, and travel-friendly packaging formats. Regionally, the market is divided into North America, Europe, Asia-Pacific, Latin America, and the Middle East & Africa.
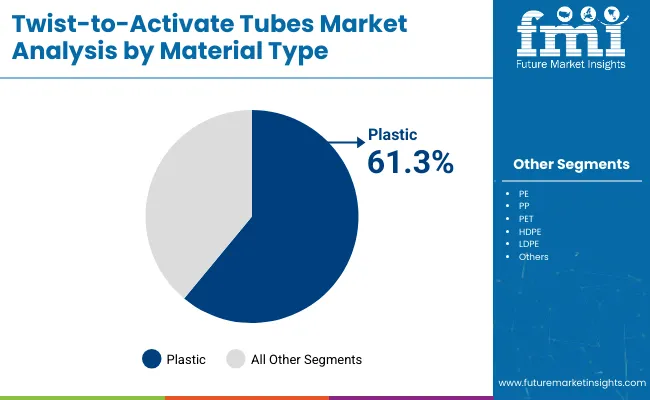
Plastic Segment Dominates Owing to Lightweight Flexibility and Barrier Integrity

Twist To Activate Tubes Market By Material

The plastic segment is anticipated to account for the largest share of 61.3% in the twist-to-activate tubes Market by 2025. This dominance stems from the material's versatility, moldability, and compatibility with twist-dispensing mechanisms. Plastics such as polyethylene (PE) and polypropylene (PP) are extensively used due to their excellent barrier properties, low cost, and ease of customization. These materials enable precise formulation delivery, especially for multi-compartment and dual-dispensing tube formats that require flexibility and structural stability.

the increasing demand for portable, tamper-proof, and single-dose packaging has made plastic the material of choice for manufacturers aiming to offer convenience and extended shelf life. With ongoing innovations in recyclable and biodegradable plastic tubes, sustainability concerns are also being addressed without compromising on performance. As a result, plastic continues to maintain dominance in this segment by supporting both functional and eco-friendly packaging objectives.
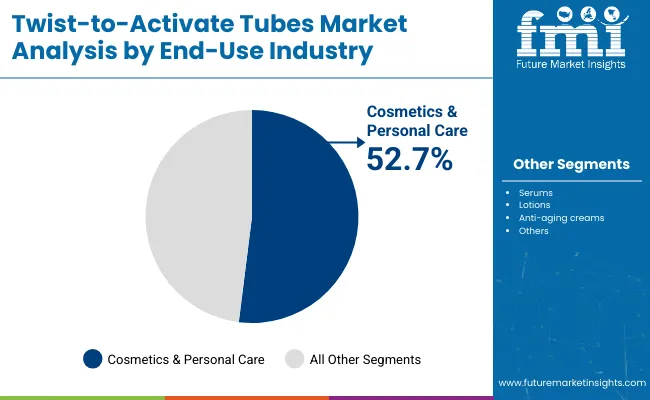
Cosmetics & Personal Care Segment Leads as Precision Dispensing Meets Luxury Skincare Trends

Twist To Activate Tubes Market By End Use

The cosmetics & personal care segment is projected to lead the application category in the twist-to-activate tubes market with a 52.7% share in 2025. This leadership is driven by a surge in consumer demand for hygienic, single-touch, and time-release dispensing systems across skincare, haircare, and cosmeceuticals. Twist-to-activate tubes are particularly favored for products requiring dual-phase activation, such as vitamin-infused serums, whitening creams, and anti-aging gels.

Brands are increasingly utilizing this packaging to enhance consumer experience and differentiate their premium offerings. The format supports active ingredient preservation and on-demand formulation mixing, which appeals to modern consumers seeking fresh and potent applications. the rise in travel-size and e-commerce beauty formats has further boosted adoption of twist-activated solutions. With growing focus on skincare precision and luxury functionality, this application category is expected to continue its dominance throughout the forecast period.
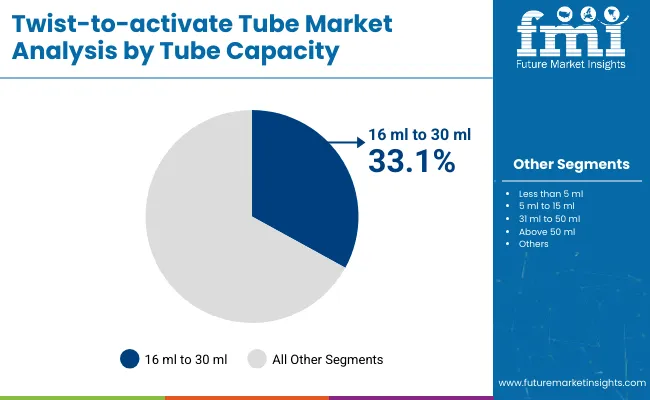
16 ml to 30 ml Capacity Segment to Lead Due to Ideal Portability and Controlled Dispensing in Skincare and Pharma

Twist To Activate Tube Market By Tube Capacity

The 16 ml to 30 ml segment is expected to account for the highest share of 33.1% in 2025 in the twist-to-activate tubes market. This segment's dominance stems from its optimal size range for single-use and travel-size applications, particularly in premium skincare, topical pharmaceuticals, and specialty cosmetics. Tubes in this capacity provide a balance between portability and adequate volume for targeted treatments or limited-duration regimens.

Consumers increasingly prefer compact, tamper-evident formats that align with on-the-go lifestyles, and twist-to-activate tubes in this range meet that need with precision dosing and minimal contamination risk.

What are the Drivers, Restraints, and Key Trends of the Twist-to-Activate Tubes Market?

Production cost variation and sealing complexities limit twist-to-activate tube scalability, even as demand grows in skincare, pharmaceuticals, and food applications for on-the-go, user-controlled dispensing and precise multi-phase product activation.

User-controlled Dispensing and Growing Demand for Multi-Phase Formulations

Twist-to-activate tubes are gaining rapid traction in cosmetics, personal care, pharmaceutical, and food sectors due to their convenience, hygiene, and controlled dispensing mechanisms. These packaging solutions allow two-component or multi-phase products such as serums and actives, or gels and powders to remain isolated until activation, preserving efficacy and shelf life.

In skincare and dermatological treatments, consumer demand for customizable regimens and freshness assurance is driving adoption. The twist mechanism offers a tamper-evident seal, portability, and a single-use format, all of which enhance safety and reduce contamination risks. The format’s intuitive functionality aligns with premium and clinical-grade product positioning in both retail and professional channels.

Complexity in Material Compatibility and High Manufacturing Overhead

Despite their functional benefits, twist-to-activate tubes face challenges associated with intricate design requirements, especially around barrier compatibility and precision engineering. These tubes require multiple compartments, tight rotational tolerances, and robust sealing to prevent premature activation or leakage.

As a result, tooling, molding, and quality testing processes are significantly more demanding than standard tubes, leading to higher production costs and longer lead times. the compatibility of actives with materials like plastics or laminates must be carefully validated, especially for pharmaceuticals and nutraceuticals. These technical and regulatory challenges can deter low-volume brands or those without dedicated packaging R&D capabilities.

Innovation in Active Packaging and Sustainable Tube Construction

A major trend in the twist-to-activate tubes market is the convergence of active packaging with eco-conscious design. Manufacturers are increasingly developing recyclable mono-material tubes and integrating biopolymers to meet sustainability benchmarks without compromising product integrity. Simultaneously, twist-based activation is being enhanced with audible clicks, visible indicators, or pressure-controlled release systems to elevate user engagement and dosing accuracy.

These innovations are particularly appealing in high-end beauty, functional foods, and wellness-focused pharmaceuticals. As clean-label demands grow and consumers seek smarter, minimal-contact formats, twist-to-activate tubes are emerging as a premium solution balancing convenience, innovation, and environmental responsibility.
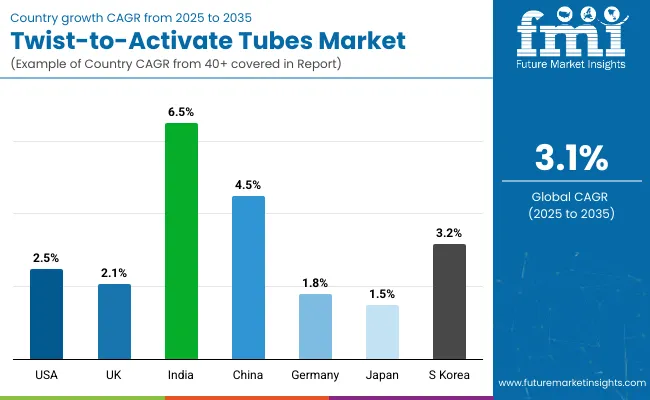
Analysis of Twist-to-Activate Tubes Market by Key Countries

Twist To Activate Tubes Market By Country

The global twist-to-activate tubes market is experiencing modest yet positive growth, driven by demand for precise dosage control, enhanced product shelf life, and consumer convenience in active ingredient delivery. This packaging format is gaining steady traction in dermo-cosmetics, medicated topicals, and specialty personal care products.

Europe and North America remain stable growth hubs, supported by OTC pharmaceutical launches and premium skincare formulations requiring compartmentalized activation. South Korea is leading growth globally, supported by K-beauty innovation and rising demand for single-use, fresh-dispense packaging.

Sales Outlook for Twist-to-Activate Tubes in the United States

The twist-to-activate tubes market in the United States is forecast to grow at a CAGR of 2.5% from 2025 to 2035. Steady adoption is observed in derma-cosmeceuticals, prescription creams, and OTC pain relief gels that benefit from dual-compartment separation. Brands are deploying twist-to-activate formats to preserve ingredient efficacy and provide on-demand activation. Demand is also supported by seniors and patients seeking single-handed, intuitive dispensing formats.

  • Pharmaceutical brands are using twist formats to separate actives until point-of-use.
  • Anti-aging and acne care products are leveraging this format for freshness and efficacy.
  • OTC brands are marketing twist tubes for arthritis, muscle gels, and dual-action creams.

Growth and Expansion Outlook for Twist-to-Activate Tubes in the United Kingdom

The twist-to-activate tubes market in the United Kingdom is projected to grow at a CAGR of 2.1%, supported by premium skincare, cosmeceuticals, and pharmacy chains offering value-added packaging. With a strong trend toward efficacy-focused beauty, British brands are launching serums and boosters that require precise ingredient blending at the point of use. Shelf differentiation and packaging novelty continue to support niche brand adoption across retail and e-commerce.

  • Premium skincare SKUs are introducing twist-to-activate formats for vitamin C and retinol blends.
  • Online brands are leveraging the format to build shelf appeal and post-use engagement.
  • Pharmacy retailers are expanding listings for twist tubes in the cosmeceutical segment.

Growth and Expansion Outlook for Twist-to-Activate Tubes in India

India’s twist-to-activate tubes market is expected to grow at a slow CAGR of 6.5%, constrained by high cost-per-unit and limited consumer awareness. The market is highly price-sensitive, and most domestic skincare and pharmaceutical brands prefer mono-dose or conventional squeeze tubes. However, some adoption is seen in high-end skincare imported via D2C platforms and among urban consumers experimenting with Korean and Japanese routines.

  • High-end imported brands are offering twist tubes for niche serum delivery.
  • Domestic brands are cautious due to tooling costs and low mass-market appeal.
  • Limited recycling infrastructure for multi-component tubes is hindering large-scale deployment.

Sales Outlook for Twist-to-Activate Tubes in China

The twist-to-activate tubes market in China is forecast to grow at a CAGR of 4.5%, driven by premium beauty, dermo-cosmetics, and localized innovation in packaging for fresh-mix serums and clinical skincare. Urban consumers are becoming increasingly ingredient-savvy, favoring precise, activation-based formats. Domestic OEMs are developing low-cost, twist-to-release mechanisms for volume manufacturing.

  • C-beauty brands are integrating twist-to-activate packaging in whitening and brightening regimens.
  • OEMs are customizing multi-compartment tubes for herbal actives and sensitive skin solutions.
  • E-commerce platforms are promoting functional dispensing formats in influencer-backed launches.

In-depth Analysis of Twist-to-Activate Tubes in Germany

The twist-to-activate tubes market in Germany is projected to grow at a CAGR of 1.8%, supported by strong demand from dermaceuticals, pharmacy-backed skincare, and OTC creams. German manufacturers are integrating precision dispensing and hygienic single-use caps to meet medical-grade requirements. Twist formats are preferred in products where actives degrade quickly or require mechanical mixing prior to application.

  • Dermo-cosmetic brands are using twist formats for post-procedure recovery creams.
  • Tube manufacturers are designing compact, tamper-proof formats for pharmacy distribution.
  • Brands are focusing on single-use activation formats to ensure stability and compliance.

Growth Outlook for Twist-to-Activate Tubes in Japan

The twist-to-activate tubes market in Japan is forecast to grow at a CAGR of 1.5%, shaped by minimalist beauty trends and limited market penetration for multi-chamber packaging. Although Japan leads in compact, travel-friendly dispensers, the twist-to-activate format remains niche due to cost sensitivity and strong preference for foil or pump tubes. Nonetheless, select applications in medical skincare and hybrid cosmetics are emerging.

  • Minimalist beauty brands are selectively trialing twist formats for sensitive skin formulations.
  • Pharmaceutical makers are deploying twist tubes in dual-phase anti-inflammatory gels.
  • Japanese packaging firms are experimenting with smaller twist mechanisms to reduce plastic use.

Opportunity Analysis of South Korea Twist-to-Activate Tubes Market

The twist-to-activate tubes market in South Korea is projected to grow at a CAGR of 3.2%, the highest among major countries. This growth is propelled by K-beauty’s emphasis on skin-first, ingredient-fresh delivery systems. Twist-to-activate tubes are popular for ampoules, boosters, and clinical serums where active ingredients must be mixed just before use. The packaging trend is also driven by social media visibility, with consumers attracted to the transformation process.

  • K-beauty brands are launching twist-to-activate ampoules with antioxidant-rich concentrates.
  • Social media influencers are boosting demand for interactive, application-driven packaging.
  • OEMs are investing in twist-enabled capsule tubes for single-use or weekly treatment packs.

Competitive Landscape of Twist-to-Activate Tubes Market

The twist-to-activate tubes market is moderately fragmented, with global packaging giants, regional converters, and niche functional specialists competing across skincare, pharmaceuticals, adhesives, and nutraceuticals. Global players such as Neopac, Albéa, and Berry Global command notable market share, driven by ergonomic tube designs, multi-compartment precision dosing, and active ingredient protection. Their strategies increasingly emphasize barrier-laminated materials, tamper-evident activation features, and sustainability integration for premium healthcare and cosmetic formulations.

Established mid-sized players, including C. L. Smith, Kaufman Container, and Kansai Tube Co., LTD, serve mid-volume brands with customizable twist-to-dispense tube formats. These companies are expanding adoption by offering dual-component formulations, wide viscosity compatibility, and region-specific compliance (e.g., FDA, REACH) across beauty, industrial, and veterinary care products.

Specialized providers such as TAKEMOTO, Alltub, Rose Plastics, and GuangZhouHuaXin Plastic Product Co., Ltd. focus on price-sensitive, application-specific solutions for regional cosmetics, OTC drugs, and personal wellness. Their strength lies in compact tube formats, low-MOQ manufacturing, and ODM capabilities tailored for emerging markets and fast-evolving product lines.

Competitive differentiation is shifting away from standard squeeze-tube models toward patented twist-based delivery systems that offer dosing accuracy, compartmentalized stability, and single-use hygienic dispensing aligned with rising consumer safety and convenience preferences.

Key Development

  • May 2024, Neopac debuted its Polyfoil® Sensation Hybrid Barrier Tube at Luxe Pack New York, showcasing twist-to-activate capability with high-barrier enhancement for cosmetic applications.
  • February 12, 2025, Hoffmann Neopac entered into a binding agreement to sell its metal packaging division to Massilly Group.

Key Companies

  • Neopac
  • C. L. Smith
  • Albéa
  • Kaufman Container
  • Berry Global
  • Rose Plastics
  • Alltub
  • Kansai Tube Co., LTD
  • TAKEMOTO
  • GuangZhouHuaXin Plastic Product co.,ltd

Segmentation

By Material Type:

  • Plastic
  • PE
  • PP
  • PET
  • HDPE
  • LDPE
  • Aluminum
  • Laminated
  • Biodegradable/Compostable Materials

By Tube Capacity:

  • Less than 5 ml
  • 5 ml to 15 ml
  • 16 ml to 30 ml
  • 31 ml to 50 ml
  • Above 50 ml

By Application:

  • Pharmaceuticals
  • Ointments
  • Topical Drugs
  • Gels
  • Cosmetics & Personal Care
  • Serums
  • Lotions
  • Anti-aging creams
  • Oral Care
  • Whitening Gels
  • Fluoride Gels

By Region:

  • North America
  • Europe
  • Asia-Pacific
  • Latin America
  • Middle East & Africa

Table of Content

  1. Executive Summary
    • Global Market Outlook
    • Demand-side Trends
    • Supply-side Trends
    • Technology Roadmap Analysis
    • Analysis and Recommendations
  2. Market Overview
    • Market Coverage / Taxonomy
    • Market Definition / Scope / Limitations
  3. Market Background
    • Market Dynamics
      • Drivers
      • Restraints
      • Opportunity
      • Trends
    • Scenario Forecast
      • Demand in Optimistic Scenario
      • Demand in Likely Scenario
      • Demand in Conservative Scenario
    • Opportunity Map Analysis
    • Product Life Cycle Analysis
    • Supply Chain Analysis
      • Supply Side Participants and their Roles
        • Producers
        • Mid-Level Participants (Traders/ Agents/ Brokers)
        • Wholesalers and Distributors
      • Value Added and Value Created at Node in the Supply Chain
      • List of Raw Material Suppliers
      • List of Existing and Potential Buyer’s
    • Investment Feasibility Matrix
    • Value Chain Analysis
      • Profit Margin Analysis
      • Wholesalers and Distributors
      • Retailers
    • PESTLE and Porter’s Analysis
    • Regulatory Landscape
      • By Key Regions
      • By Key Countries
    • Regional Parent Market Outlook
    • Production and Consumption Statistics
    • Import and Export Statistics
  4. Global Analysis 2020 to 2024 and Forecast, 2025 to 2035
    • Historical Market Size Value (USD Million) & Volume (Units) Analysis, 2020 to 2024
    • Current and Future Market Size Value (USD Million) & Volume (Units) Projections, 2025 to 2035
      • Y-o-Y Growth Trend Analysis
      • Absolute $ Opportunity Analysis
  5. Global Pricing Analysis 2020 to 2024 and Forecast 2025 to 2035
  6. Global Analysis 2020 to 2024 and Forecast 2025 to 2035, By Material Type
    • Introduction / Key Findings
    • Historical Market Size Value (USD Million) & Volume (Units) Analysis By Material Type, 2020 to 2024
    • Current and Future Market Size Value (USD Million) & Volume (Units) Analysis and Forecast By Material Type, 2025 to 2035
      • Plastic (PE, PP, PET, HDPE, LDPE)
      • Aluminum
      • Laminated (Plastic + Aluminum)
      • Biodegradable/Compostable Materials
    • Y-o-Y Growth Trend Analysis By Material Type, 2020 to 2024
    • Absolute $ Opportunity Analysis By Material Type, 2025 to 2035
  7. Global Analysis 2020 to 2024 and Forecast 2025 to 2035, By By Tube Capacity
    • Introduction / Key Findings
    • Historical Market Size Value (USD Million) & Volume (Units) Analysis By By Tube Capacity, 2020 to 2024
    • Current and Future Market Size Value (USD Million) & Volume (Units) Analysis and Forecast By By Tube Capacity, 2025 to 2035
      • Less than 5 ml
      • 5 ml to 15 ml
      • 16 ml to 30 ml
      • 31 ml to 50 ml
      • Above 50 ml
    • Y-o-Y Growth Trend Analysis By By Tube Capacity, 2020 to 2024
    • Absolute $ Opportunity Analysis By By Tube Capacity, 2025 to 2035
  8. Global Analysis 2020 to 2024 and Forecast 2025 to 2035, By By Application
    • Introduction / Key Findings
    • Historical Market Size Value (USD Million) & Volume (Units) Analysis By By Application, 2020 to 2024
    • Current and Future Market Size Value (USD Million) & Volume (Units) Analysis and Forecast By By Application, 2025 to 2035
      • Pharmaceuticals (Ointments, Topical Drugs, Gels)
      • Cosmetics & Personal Care (Serums, Lotions, Anti-aging creams)
      • Oral Care (Whitening Gels, Fluoride Gels)
    • Y-o-Y Growth Trend Analysis By By Application, 2020 to 2024
    • Absolute $ Opportunity Analysis By By Application, 2025 to 2035
  9. Global Analysis 2020 to 2024 and Forecast 2025 to 2035, By Region
    • Introduction
    • Historical Market Size Value (USD Million) & Volume (Units) Analysis By Region, 2020 to 2024
    • Current Market Size Value (USD Million) & Volume (Units) Analysis and Forecast By Region, 2025 to 2035
      • North America
      • Latin America
      • Europe
      • East Asia
      • South Asia
      • Oceania
      • MEA
    • Market Attractiveness Analysis By Region
  10. North America Analysis 2020 to 2024 and Forecast 2025 to 2035, By Country
    • Historical Market Size Value (USD Million) & Volume (Units) Trend Analysis By Market Taxonomy, 2020 to 2024
    • Market Size Value (USD Million) & Volume (Units) Forecast By Market Taxonomy, 2025 to 2035
      • By Country
        • USA
        • Canada
      • By Material Type
      • By By Tube Capacity
      • By By Application
    • Market Attractiveness Analysis
      • By Country
      • By Material Type
      • By By Tube Capacity
      • By By Application
    • Key Takeaways
  11. Latin America Analysis 2020 to 2024 and Forecast 2025 to 2035, By Country
    • Historical Market Size Value (USD Million) & Volume (Units) Trend Analysis By Market Taxonomy, 2020 to 2024
    • Market Size Value (USD Million) & Volume (Units) Forecast By Market Taxonomy, 2025 to 2035
      • By Country
        • Brazil
        • Mexico
        • Argentina
        • Chile
        • Peru
        • Rest of Latin America
      • By Material Type
      • By By Tube Capacity
      • By By Application
    • Market Attractiveness Analysis
      • By Country
      • By Material Type
      • By By Tube Capacity
      • By By Application
    • Key Takeaways
  12. Europe Analysis 2020 to 2024 and Forecast 2025 to 2035, By Country
    • Historical Market Size Value (USD Million) & Volume (Units) Trend Analysis By Market Taxonomy, 2020 to 2024
    • Market Size Value (USD Million) & Volume (Units) Forecast By Market Taxonomy, 2025 to 2035
      • By Country
        • Germany
        • Italy
        • France
        • UK
        • Spain
        • Russia
        • BENELUX
        • Rest of Europe
      • By Material Type
      • By By Tube Capacity
      • By By Application
    • Market Attractiveness Analysis
      • By Country
      • By Material Type
      • By By Tube Capacity
      • By By Application
    • Key Takeaways
  13. East Asia Analysis 2020 to 2024 and Forecast 2025 to 2035, By Country
    • Historical Market Size Value (USD Million) & Volume (Units) Trend Analysis By Market Taxonomy, 2020 to 2024
    • Market Size Value (USD Million) & Volume (Units) Forecast By Market Taxonomy, 2025 to 2035
      • By Country
        • China
        • Japan
        • South Korea
      • By Material Type
      • By By Tube Capacity
      • By By Application
    • Market Attractiveness Analysis
      • By Country
      • By Material Type
      • By By Tube Capacity
      • By By Application
    • Key Takeaways
  14. South Asia Analysis 2020 to 2024 and Forecast 2025 to 2035, By Country
    • Historical Market Size Value (USD Million) & Volume (Units) Trend Analysis By Market Taxonomy, 2020 to 2024
    • Market Size Value (USD Million) & Volume (Units) Forecast By Market Taxonomy, 2025 to 2035
      • By Country
        • India
        • Thailand
        • Malaysia
        • Indonesia
        • Rest of South Asia
      • By Material Type
      • By By Tube Capacity
      • By By Application
    • Market Attractiveness Analysis
      • By Country
      • By Material Type
      • By By Tube Capacity
      • By By Application
    • Key Takeaways
  15. Oceania Analysis 2020 to 2024 and Forecast 2025 to 2035, By Country
    • Historical Market Size Value (USD Million) & Volume (Units) Trend Analysis By Market Taxonomy, 2020 to 2024
    • Market Size Value (USD Million) & Volume (Units) Forecast By Market Taxonomy, 2025 to 2035
      • By Country
        • Australia
        • New Zealand
      • By Material Type
      • By By Tube Capacity
      • By By Application
    • Market Attractiveness Analysis
      • By Country
      • By Material Type
      • By By Tube Capacity
      • By By Application
    • Key Takeaways
  16. MEA Analysis 2020 to 2024 and Forecast 2025 to 2035, By Country
    • Historical Market Size Value (USD Million) & Volume (Units) Trend Analysis By Market Taxonomy, 2020 to 2024
    • Market Size Value (USD Million) & Volume (Units) Forecast By Market Taxonomy, 2025 to 2035
      • By Country
        • GCC
        • Rest of MEA
      • By Material Type
      • By By Tube Capacity
      • By By Application
    • Market Attractiveness Analysis
      • By Country
      • By Material Type
      • By By Tube Capacity
      • By By Application
    • Key Takeaways
  17. Key Countries Analysis
    • USA
      • Pricing Analysis
      • Market Share Analysis, 2024
        • By Material Type
        • By By Tube Capacity
        • By By Application
    • Canada
      • Pricing Analysis
      • Market Share Analysis, 2024
        • By Material Type
        • By By Tube Capacity
        • By By Application
    • Brazil
      • Pricing Analysis
      • Market Share Analysis, 2024
        • By Material Type
        • By By Tube Capacity
        • By By Application
    • Mexico
      • Pricing Analysis
      • Market Share Analysis, 2024
        • By Material Type
        • By By Tube Capacity
        • By By Application
    • Argentina
      • Pricing Analysis
      • Market Share Analysis, 2024
        • By Material Type
        • By By Tube Capacity
        • By By Application
  18. Market Structure Analysis
    • Competition Dashboard
    • Competition Benchmarking
    • Market Share Analysis of Top Players
      • By Regional
      • By Material Type
      • By By Tube Capacity
      • By By Application
  19. Competition Analysis
    • Competition Deep Dive
      • Neopac
        • Overview
        • Product Portfolio
        • Profitability by Market Segments (Product/Age /Sales Channel/Region)
        • Sales Footprint
        • Strategy Overview
          • Marketing Strategy
          • Product Strategy
          • Channel Strategy
      • C. L. Smith
        • Overview
        • Product Portfolio
        • Profitability by Market Segments (Product/Age /Sales Channel/Region)
        • Sales Footprint
        • Strategy Overview
          • Marketing Strategy
          • Product Strategy
          • Channel Strategy
      • Albéa
        • Overview
        • Product Portfolio
        • Profitability by Market Segments (Product/Age /Sales Channel/Region)
        • Sales Footprint
        • Strategy Overview
          • Marketing Strategy
          • Product Strategy
          • Channel Strategy
      • Kaufman Container
        • Overview
        • Product Portfolio
        • Profitability by Market Segments (Product/Age /Sales Channel/Region)
        • Sales Footprint
        • Strategy Overview
          • Marketing Strategy
          • Product Strategy
          • Channel Strategy
      • Berry Global
        • Overview
        • Product Portfolio
        • Profitability by Market Segments (Product/Age /Sales Channel/Region)
        • Sales Footprint
        • Strategy Overview
          • Marketing Strategy
          • Product Strategy
          • Channel Strategy
      • Rose Plastics
        • Overview
        • Product Portfolio
        • Profitability by Market Segments (Product/Age /Sales Channel/Region)
        • Sales Footprint
        • Strategy Overview
          • Marketing Strategy
          • Product Strategy
          • Channel Strategy
      • Alltub
        • Overview
        • Product Portfolio
        • Profitability by Market Segments (Product/Age /Sales Channel/Region)
        • Sales Footprint
        • Strategy Overview
          • Marketing Strategy
          • Product Strategy
          • Channel Strategy
      • Kansai Tube Co., LTD
        • Overview
        • Product Portfolio
        • Profitability by Market Segments (Product/Age /Sales Channel/Region)
        • Sales Footprint
        • Strategy Overview
          • Marketing Strategy
          • Product Strategy
          • Channel Strategy
      • TAKEMOTO
        • Overview
        • Product Portfolio
        • Profitability by Market Segments (Product/Age /Sales Channel/Region)
        • Sales Footprint
        • Strategy Overview
          • Marketing Strategy
          • Product Strategy
          • Channel Strategy
      • GuangZhou HuaXin Plastic Product co.,ltd
        • Overview
        • Product Portfolio
        • Profitability by Market Segments (Product/Age /Sales Channel/Region)
        • Sales Footprint
        • Strategy Overview
          • Marketing Strategy
          • Product Strategy
          • Channel Strategy
  20. Assumptions & Acronyms Used
  21. Research Methodology

List of Tables

  • Table 1: Global Market Value (USD Million) Forecast by Region, 2020-2035
  • Table 2: Global Market Volume (Units) Forecast by Region, 2020-2035
  • Table 3: Global Market Value (USD Million) Forecast by Material Type, 2020-2035
  • Table 4: Global Market Volume (Units) Forecast by Material Type, 2020-2035
  • Table 5: Global Market Value (USD Million) Forecast by By Tube Capacity, 2020-2035
  • Table 6: Global Market Volume (Units) Forecast by By Tube Capacity, 2020-2035
  • Table 7: Global Market Value (USD Million) Forecast by By Application, 2020-2035
  • Table 8: Global Market Volume (Units) Forecast by By Application, 2020-2035
  • Table 9: North America Market Value (USD Million) Forecast by Country, 2020-2035
  • Table 10: North America Market Volume (Units) Forecast by Country, 2020-2035
  • Table 11: North America Market Value (USD Million) Forecast by Material Type, 2020-2035
  • Table 12: North America Market Volume (Units) Forecast by Material Type, 2020-2035
  • Table 13: North America Market Value (USD Million) Forecast by By Tube Capacity, 2020-2035
  • Table 14: North America Market Volume (Units) Forecast by By Tube Capacity, 2020-2035
  • Table 15: North America Market Value (USD Million) Forecast by By Application, 2020-2035
  • Table 16: North America Market Volume (Units) Forecast by By Application, 2020-2035
  • Table 17: Latin America Market Value (USD Million) Forecast by Country, 2020-2035
  • Table 18: Latin America Market Volume (Units) Forecast by Country, 2020-2035
  • Table 19: Latin America Market Value (USD Million) Forecast by Material Type, 2020-2035
  • Table 20: Latin America Market Volume (Units) Forecast by Material Type, 2020-2035
  • Table 21: Latin America Market Value (USD Million) Forecast by By Tube Capacity, 2020-2035
  • Table 22: Latin America Market Volume (Units) Forecast by By Tube Capacity, 2020-2035
  • Table 23: Latin America Market Value (USD Million) Forecast by By Application, 2020-2035
  • Table 24: Latin America Market Volume (Units) Forecast by By Application, 2020-2035
  • Table 25: Europe Market Value (USD Million) Forecast by Country, 2020-2035
  • Table 26: Europe Market Volume (Units) Forecast by Country, 2020-2035
  • Table 27: Europe Market Value (USD Million) Forecast by Material Type, 2020-2035
  • Table 28: Europe Market Volume (Units) Forecast by Material Type, 2020-2035
  • Table 29: Europe Market Value (USD Million) Forecast by By Tube Capacity, 2020-2035
  • Table 30: Europe Market Volume (Units) Forecast by By Tube Capacity, 2020-2035
  • Table 31: Europe Market Value (USD Million) Forecast by By Application, 2020-2035
  • Table 32: Europe Market Volume (Units) Forecast by By Application, 2020-2035
  • Table 33: East Asia Market Value (USD Million) Forecast by Country, 2020-2035
  • Table 34: East Asia Market Volume (Units) Forecast by Country, 2020-2035
  • Table 35: East Asia Market Value (USD Million) Forecast by Material Type, 2020-2035
  • Table 36: East Asia Market Volume (Units) Forecast by Material Type, 2020-2035
  • Table 37: East Asia Market Value (USD Million) Forecast by By Tube Capacity, 2020-2035
  • Table 38: East Asia Market Volume (Units) Forecast by By Tube Capacity, 2020-2035
  • Table 39: East Asia Market Value (USD Million) Forecast by By Application, 2020-2035
  • Table 40: East Asia Market Volume (Units) Forecast by By Application, 2020-2035
  • Table 41: South Asia Market Value (USD Million) Forecast by Country, 2020-2035
  • Table 42: South Asia Market Volume (Units) Forecast by Country, 2020-2035
  • Table 43: South Asia Market Value (USD Million) Forecast by Material Type, 2020-2035
  • Table 44: South Asia Market Volume (Units) Forecast by Material Type, 2020-2035
  • Table 45: South Asia Market Value (USD Million) Forecast by By Tube Capacity, 2020-2035
  • Table 46: South Asia Market Volume (Units) Forecast by By Tube Capacity, 2020-2035
  • Table 47: South Asia Market Value (USD Million) Forecast by By Application, 2020-2035
  • Table 48: South Asia Market Volume (Units) Forecast by By Application, 2020-2035
  • Table 49: Oceania Market Value (USD Million) Forecast by Country, 2020-2035
  • Table 50: Oceania Market Volume (Units) Forecast by Country, 2020-2035
  • Table 51: Oceania Market Value (USD Million) Forecast by Material Type, 2020-2035
  • Table 52: Oceania Market Volume (Units) Forecast by Material Type, 2020-2035
  • Table 53: Oceania Market Value (USD Million) Forecast by By Tube Capacity, 2020-2035
  • Table 54: Oceania Market Volume (Units) Forecast by By Tube Capacity, 2020-2035
  • Table 55: Oceania Market Value (USD Million) Forecast by By Application, 2020-2035
  • Table 56: Oceania Market Volume (Units) Forecast by By Application, 2020-2035
  • Table 57: MEA Market Value (USD Million) Forecast by Country, 2020-2035
  • Table 58: MEA Market Volume (Units) Forecast by Country, 2020-2035
  • Table 59: MEA Market Value (USD Million) Forecast by Material Type, 2020-2035
  • Table 60: MEA Market Volume (Units) Forecast by Material Type, 2020-2035
  • Table 61: MEA Market Value (USD Million) Forecast by By Tube Capacity, 2020-2035
  • Table 62: MEA Market Volume (Units) Forecast by By Tube Capacity, 2020-2035
  • Table 63: MEA Market Value (USD Million) Forecast by By Application, 2020-2035
  • Table 64: MEA Market Volume (Units) Forecast by By Application, 2020-2035

List of Figures

  • Figure 1: Global Market Volume (Units) Forecast 2020-2035
  • Figure 2: Global Market Pricing Analysis
  • Figure 3: Global Market Value (USD Million) Forecast 2020-2035
  • Figure 4: Global Market Value Share and BPS Analysis by Material Type, 2025 and 2035
  • Figure 5: Global Market Y-o-Y Growth Comparison by Material Type, 2025-2035
  • Figure 6: Global Market Attractiveness Analysis by Material Type
  • Figure 7: Global Market Value Share and BPS Analysis by By Tube Capacity, 2025 and 2035
  • Figure 8: Global Market Y-o-Y Growth Comparison by By Tube Capacity, 2025-2035
  • Figure 9: Global Market Attractiveness Analysis by By Tube Capacity
  • Figure 10: Global Market Value Share and BPS Analysis by By Application, 2025 and 2035
  • Figure 11: Global Market Y-o-Y Growth Comparison by By Application, 2025-2035
  • Figure 12: Global Market Attractiveness Analysis by By Application
  • Figure 13: Global Market Value (USD Million) Share and BPS Analysis by Region, 2025 and 2035
  • Figure 14: Global Market Y-o-Y Growth Comparison by Region, 2025-2035
  • Figure 15: Global Market Attractiveness Analysis by Region
  • Figure 16: North America Market Incremental $ Opportunity, 2025-2035
  • Figure 17: Latin America Market Incremental $ Opportunity, 2025-2035
  • Figure 18: Europe Market Incremental $ Opportunity, 2025-2035
  • Figure 19: East Asia Market Incremental $ Opportunity, 2025-2035
  • Figure 20: South Asia Market Incremental $ Opportunity, 2025-2035
  • Figure 21: Oceania Market Incremental $ Opportunity, 2025-2035
  • Figure 22: MEA Market Incremental $ Opportunity, 2025-2035
  • Figure 23: North America Market Value Share and BPS Analysis by Country, 2025 and 2035
  • Figure 24: North America Market Value Share and BPS Analysis by Material Type, 2025 and 2035
  • Figure 25: North America Market Y-o-Y Growth Comparison by Material Type, 2025-2035
  • Figure 26: North America Market Attractiveness Analysis by Material Type
  • Figure 27: North America Market Value Share and BPS Analysis by By Tube Capacity, 2025 and 2035
  • Figure 28: North America Market Y-o-Y Growth Comparison by By Tube Capacity, 2025-2035
  • Figure 29: North America Market Attractiveness Analysis by By Tube Capacity
  • Figure 30: North America Market Value Share and BPS Analysis by By Application, 2025 and 2035
  • Figure 31: North America Market Y-o-Y Growth Comparison by By Application, 2025-2035
  • Figure 32: North America Market Attractiveness Analysis by By Application
  • Figure 33: Latin America Market Value Share and BPS Analysis by Country, 2025 and 2035
  • Figure 34: Latin America Market Value Share and BPS Analysis by Material Type, 2025 and 2035
  • Figure 35: Latin America Market Y-o-Y Growth Comparison by Material Type, 2025-2035
  • Figure 36: Latin America Market Attractiveness Analysis by Material Type
  • Figure 37: Latin America Market Value Share and BPS Analysis by By Tube Capacity, 2025 and 2035
  • Figure 38: Latin America Market Y-o-Y Growth Comparison by By Tube Capacity, 2025-2035
  • Figure 39: Latin America Market Attractiveness Analysis by By Tube Capacity
  • Figure 40: Latin America Market Value Share and BPS Analysis by By Application, 2025 and 2035
  • Figure 41: Latin America Market Y-o-Y Growth Comparison by By Application, 2025-2035
  • Figure 42: Latin America Market Attractiveness Analysis by By Application
  • Figure 43: Europe Market Value Share and BPS Analysis by Country, 2025 and 2035
  • Figure 44: Europe Market Value Share and BPS Analysis by Material Type, 2025 and 2035
  • Figure 45: Europe Market Y-o-Y Growth Comparison by Material Type, 2025-2035
  • Figure 46: Europe Market Attractiveness Analysis by Material Type
  • Figure 47: Europe Market Value Share and BPS Analysis by By Tube Capacity, 2025 and 2035
  • Figure 48: Europe Market Y-o-Y Growth Comparison by By Tube Capacity, 2025-2035
  • Figure 49: Europe Market Attractiveness Analysis by By Tube Capacity
  • Figure 50: Europe Market Value Share and BPS Analysis by By Application, 2025 and 2035
  • Figure 51: Europe Market Y-o-Y Growth Comparison by By Application, 2025-2035
  • Figure 52: Europe Market Attractiveness Analysis by By Application
  • Figure 53: East Asia Market Value Share and BPS Analysis by Country, 2025 and 2035
  • Figure 54: East Asia Market Value Share and BPS Analysis by Material Type, 2025 and 2035
  • Figure 55: East Asia Market Y-o-Y Growth Comparison by Material Type, 2025-2035
  • Figure 56: East Asia Market Attractiveness Analysis by Material Type
  • Figure 57: East Asia Market Value Share and BPS Analysis by By Tube Capacity, 2025 and 2035
  • Figure 58: East Asia Market Y-o-Y Growth Comparison by By Tube Capacity, 2025-2035
  • Figure 59: East Asia Market Attractiveness Analysis by By Tube Capacity
  • Figure 60: East Asia Market Value Share and BPS Analysis by By Application, 2025 and 2035
  • Figure 61: East Asia Market Y-o-Y Growth Comparison by By Application, 2025-2035
  • Figure 62: East Asia Market Attractiveness Analysis by By Application
  • Figure 63: South Asia Market Value Share and BPS Analysis by Country, 2025 and 2035
  • Figure 64: South Asia Market Value Share and BPS Analysis by Material Type, 2025 and 2035
  • Figure 65: South Asia Market Y-o-Y Growth Comparison by Material Type, 2025-2035
  • Figure 66: South Asia Market Attractiveness Analysis by Material Type
  • Figure 67: South Asia Market Value Share and BPS Analysis by By Tube Capacity, 2025 and 2035
  • Figure 68: South Asia Market Y-o-Y Growth Comparison by By Tube Capacity, 2025-2035
  • Figure 69: South Asia Market Attractiveness Analysis by By Tube Capacity
  • Figure 70: South Asia Market Value Share and BPS Analysis by By Application, 2025 and 2035
  • Figure 71: South Asia Market Y-o-Y Growth Comparison by By Application, 2025-2035
  • Figure 72: South Asia Market Attractiveness Analysis by By Application
  • Figure 73: Oceania Market Value Share and BPS Analysis by Country, 2025 and 2035
  • Figure 74: Oceania Market Value Share and BPS Analysis by Material Type, 2025 and 2035
  • Figure 75: Oceania Market Y-o-Y Growth Comparison by Material Type, 2025-2035
  • Figure 76: Oceania Market Attractiveness Analysis by Material Type
  • Figure 77: Oceania Market Value Share and BPS Analysis by By Tube Capacity, 2025 and 2035
  • Figure 78: Oceania Market Y-o-Y Growth Comparison by By Tube Capacity, 2025-2035
  • Figure 79: Oceania Market Attractiveness Analysis by By Tube Capacity
  • Figure 80: Oceania Market Value Share and BPS Analysis by By Application, 2025 and 2035
  • Figure 81: Oceania Market Y-o-Y Growth Comparison by By Application, 2025-2035
  • Figure 82: Oceania Market Attractiveness Analysis by By Application
  • Figure 83: MEA Market Value Share and BPS Analysis by Country, 2025 and 2035
  • Figure 84: MEA Market Value Share and BPS Analysis by Material Type, 2025 and 2035
  • Figure 85: MEA Market Y-o-Y Growth Comparison by Material Type, 2025-2035
  • Figure 86: MEA Market Attractiveness Analysis by Material Type
  • Figure 87: MEA Market Value Share and BPS Analysis by By Tube Capacity, 2025 and 2035
  • Figure 88: MEA Market Y-o-Y Growth Comparison by By Tube Capacity, 2025-2035
  • Figure 89: MEA Market Attractiveness Analysis by By Tube Capacity
  • Figure 90: MEA Market Value Share and BPS Analysis by By Application, 2025 and 2035
  • Figure 91: MEA Market Y-o-Y Growth Comparison by By Application, 2025-2035
  • Figure 92: MEA Market Attractiveness Analysis by By Application
  • Figure 93: Global Market - Tier Structure Analysis
  • Figure 94: Global Market - Company Share Analysis

Frequently Asked Questions

How big is the twist-to-activate tubes market in 2025?

The global twist-to-activate tubes market is estimated to be valued at USD 2.9 billion in 2025.

What will be the size of the twist-to-activate tubes market in 2035?

The market size for the twist-to-activate tubes market is projected to reach USD 3.9 billion by 2035.

How much will be the twist-to-activate tubes market growth between 2025 and 2035?

The twist-to-activate tubes market is expected to grow at a 3.1% CAGR between 2025 and 2035.

What are the key product types in the twist-to-activate tubes market?

The key product types in the twist-to-activate tubes market include single-use tubes, multi-dose tubes, dual-chamber tubes, and airless twist dispensers.

Which material segment is expected to contribute significant share in the twist-to-activate tubes market in 2025?

In terms of material, the plastic segment is expected to command the highest share of 61.3% in the twist-to-activate tubes market in 2025.

Explore Similar Insights

Future Market Insights

Twist-to-activate Tube Market