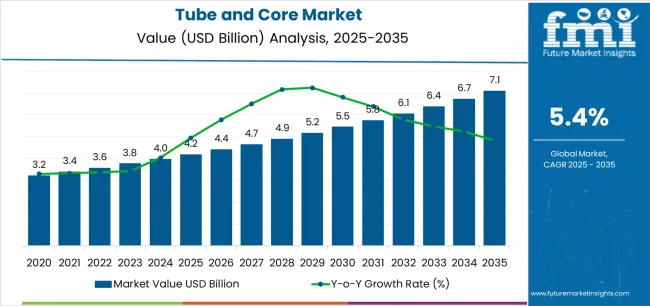
The tube and core market stands at the threshold of a decade-long expansion trajectory that promises to reshape packaging solutions and material handling technology across industrial manufacturing sectors. Based on Future Market Insights (FMI)’s verified data on biopolymer, flexible, and rigid packaging adoption, the market's journey from USD 4.2 billion in 2025 to USD 7.1 billion by 2035 represents substantial growth, demonstrating the accelerating adoption of advanced winding solutions and precision core manufacturing across paper mills, textile operations, film production facilities, and converting operations.
The first half of the decade (2025-2030) will witness the market climbing from USD 4.2 billion to approximately USD 5.5 billion, adding USD 1.3 billion in value, which constitutes 45% of the total forecast growth period. This phase will be characterized by the rapid adoption of composite core technology, driven by increasing paper production volumes and the growing need for advanced strength-to-weight ratio solutions worldwide. Enhanced structural capabilities and lightweight design systems will become standard expectations rather than premium options.
The latter half (2030-2035) will witness continued growth from USD 5.5 billion to USD 7.1 billion, representing an addition of USD 1.6 billion or 55% of the decade's expansion. This period will be defined by mass market penetration of specialty core applications, integration with comprehensive material handling platforms, and seamless compatibility with existing manufacturing infrastructure. The market trajectory signals fundamental shifts in how industrial facilities approach material winding and core manufacturing, with participants positioned to benefit from growing demand across multiple material types and application segments.
One of the key drivers for the growth of the tube and core market is the global expansion of the packaging industry, especially in the e-commerce sector. As online shopping continues to thrive, the demand for packaging materials that offer both protection and environmental friendliness is surging. Tubes and cores are widely used for packaging various products such as textiles, carpets, and tapes, ensuring that these items maintain their shape and quality during transportation. With the growing focus on reducing plastic waste, companies are increasingly shifting to paper-based solutions like tubes and cores, which are recyclable, biodegradable, and environmentally sustainable alternatives to traditional plastic packaging materials.
Technological advancements in the production of tubes and cores are also contributing to the market’s growth. Innovations in manufacturing processes, such as the use of recycled materials and the development of stronger, lighter products, are improving both the performance and sustainability of tube and core products. These advancements allow manufacturers to offer more cost-efficient and environmentally friendly solutions, which are key in attracting businesses that are increasingly focusing on minimizing their environmental footprint.
| Period | Primary Revenue Buckets | Share | Notes |
|---|---|---|---|
| Today | Paper and paperboard cores | 48% | Traditional paper mill applications, converting operations |
| Textile cores | 22% | Yarn winding, fabric rolling applications | |
| Film and tape cores | 18% | Flexible packaging, adhesive tape industries | |
| Custom specialty cores | 12% | Industrial applications, specialized manufacturing | |
| Future (3-5 yrs) | Composite and hybrid cores | 35-40% | Advanced materials, enhanced strength properties |
| E-commerce packaging cores | 20-25% | Protective packaging, shipping materials | |
| Technical textiles cores | 15-18% | Nonwovens, industrial fabrics | |
| Film and flexible packaging | 12-15% | Food packaging, pharma films | |
| Value-added services | 8-12% | Custom printing, inventory management | |
| Recycled content solutions | 5-8% | Circular economy applications |
At-a-Glance Metrics
| Metric | Value |
|---|---|
| Market Value (2025) | USD 4.2 billion |
| Market Forecast (2035) | USD 7.1 billion |
| Growth Rate | 5.4% CAGR |
| Leading Technology | Paper Cores |
| Primary Application | Paper and Paperboard Segment |
The market demonstrates strong fundamentals with paper core systems capturing a dominant share through advanced structural capabilities and manufacturing optimization. Paper and paperboard applications drive primary demand, supported by increasing converting operations and packaging requirements. Geographic expansion remains concentrated in developed markets with established paper manufacturing infrastructure, while emerging economies show accelerating adoption rates driven by industrial expansion initiatives and rising production standards.
Design for performance, not just cost
Primary Classification: The market segments by material type into paper cores, composite cores, and plastic cores, representing the evolution from traditional paperboard construction to sophisticated material solutions for comprehensive industrial winding optimization.
Secondary Classification: Application segmentation divides the market into paper and paperboard, textiles, films and tapes, adhesives, and other applications, reflecting distinct requirements for structural strength, dimensional accuracy, and performance standards.
Tertiary Classification: Wall thickness segmentation covers thin-wall (below 5mm), medium-wall (5-10mm), and thick-wall (above 10mm), while end-use sectors span paper mills, textile manufacturers, film producers, packaging converters, and printing companies.
Regional Classification: Geographic distribution covers North America, Latin America, Western Europe, Eastern Europe, East Asia, South Asia Pacific, and Middle East & Africa, with developed markets leading adoption while emerging economies show accelerating growth patterns driven by industrial manufacturing expansion programs.
The segmentation structure reveals material progression from standard paper construction toward sophisticated composite systems with enhanced strength and performance capabilities, while application diversity spans from paper mill operations to specialty film manufacturing requiring precise dimensional accuracy solutions.
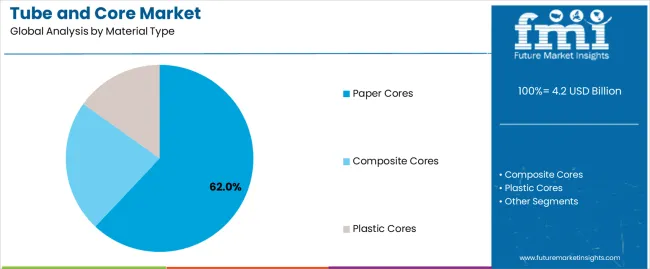
Market Position: Paper Cores systems command the leading position in the tube and core market with 62% market share through advanced structural features, including superior compression strength, dimensional stability, and manufacturing optimization that enable industrial facilities to achieve optimal winding performance across diverse paper, textile, and film environments.
Value Drivers: The segment benefits from industrial facility preference for reliable core systems that provide consistent performance characteristics, recyclability advantages, and cost efficiency optimization without requiring significant material infrastructure modifications. Advanced design features enable automated manufacturing processes, dimensional consistency, and integration with existing winding equipment, where structural performance and material compatibility represent critical facility requirements.
Competitive Advantages: Paper Cores systems differentiate through proven operational reliability, consistent structural characteristics, and integration with automated winding systems that enhance facility effectiveness while maintaining optimal quality standards suitable for diverse paper and converting applications.
Key market characteristics:
Composite Cores maintain a 25% market position in the tube and core market due to their enhanced strength properties and performance advantages. These systems appeal to facilities requiring superior compression resistance with competitive pricing for specialty industrial applications. Market growth is driven by technical textile expansion, emphasizing high-performance core solutions and operational efficiency through optimized material designs.
Plastic Cores capture 13% market share through specialized application requirements in moisture-sensitive operations, chemical-resistant environments, and high-performance applications. These facilities demand durable core systems capable of handling harsh conditions while providing effective winding capabilities and reusability characteristics.
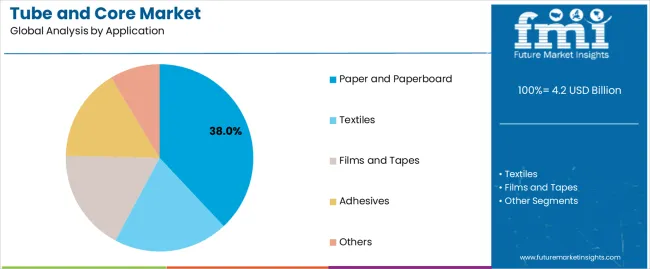
Market Context: Paper and Paperboard applications demonstrate the highest market share 38% due to widespread adoption of converting operations and increasing focus on packaging manufacturing optimization, production cost efficiency, and material handling applications that maximize operational output while maintaining quality standards.
Appeal Factors: Paper and paperboard operators prioritize core reliability, dimensional consistency, and integration with existing converting infrastructure that enables coordinated winding operations across multiple production lines. The segment benefits from substantial paper industry investment and modernization programs that emphasize the acquisition of precision core systems for production optimization and converting efficiency applications.
Growth Drivers: Paper mill expansion programs incorporate advanced cores as standard equipment for converting operations, while e-commerce packaging growth increases demand for specialty core capabilities that comply with dimensional standards and minimize material waste complexity.
Market Challenges: Varying paper grades and winding tension requirements may limit core standardization across different mills or product scenarios.
Application dynamics include:
Textile applications capture 28% market share through critical winding requirements in yarn production, fabric manufacturing, and technical textile operations. These facilities demand precision-engineered core systems capable of operating with diverse yarn types while providing effective tension control and dimensional stability capabilities.
Film and Tape applications account for 19% market share, including flexible packaging operations, adhesive tape production, and specialty film manufacturing requiring smooth surface finish capabilities for operational optimization and product quality excellence.
Market Position: Medium-Wall cores command significant market position with 5.8% CAGR through optimal strength balance that meets versatility and application flexibility for diverse industrial winding applications.
Value Drivers: This wall thickness provides the ideal combination of structural strength and material efficiency, meeting requirements for standard paper rolls, textile applications, and film winding operations without excessive material consumption or performance limitations.
Growth Characteristics: The segment benefits from broad applicability across industrial sectors, standardized manufacturing specifications, and established production programs that support widespread adoption and cost efficiency.
Market Context: Paper Mills dominate the market with 6.4% CAGR, reflecting the primary demand source for core technology in paper production and converting operations.
Business Model Advantages: Paper mills provide direct market demand for precision core products, driving dimensional innovation and capacity expansion while maintaining quality control and operational efficiency requirements.
Operational Benefits: Paper mill applications include jumbo roll production, converting operations, and distribution logistics that drive consistent demand for core products while providing access to latest manufacturing technologies.
| Category | Factor | Impact | Why It Matters |
|---|---|---|---|
| Driver | E-commerce expansion & packaging demand growth | ★★★★★ | Online retail growth requires protective packaging cores; increased demand for specialty dimensions and custom printing solutions across distribution networks. |
| Driver | Paper mill modernization & converting efficiency requirements | ★★★★★ | Modern paper operations demand precision cores with consistent dimensions; manufacturers providing technical support and custom specifications gain competitive advantage. |
| Driver | Textile industry expansion & technical fabrics growth | ★★★★☆ | Technical textiles need specialized cores; demand for high-strength, precision-wound solutions expanding addressable market across industrial applications. |
| Restraint | Raw material price volatility & fiber cost fluctuations | ★★★★☆ | Paper price fluctuations impact margins; increases cost pressures and complicates pricing strategies for core manufacturers in competitive markets. |
| Restraint | Transportation costs & regional supply constraints | ★★★☆☆ | Cores are bulky low-value products; high freight costs relative to product value limiting distribution range and favoring local production networks. |
| Trend | Recycled content integration & circular economy adoption | ★★★★★ | Recycled fiber cores gaining preference; environmental considerations and corporate sustainability commitments transform material specifications and purchasing decisions. |
| Trend | Custom printing & brand identification services | ★★★★☆ | Value-added printing services differentiate offerings; branded cores for retail visibility and inventory management drive premium pricing opportunities. |
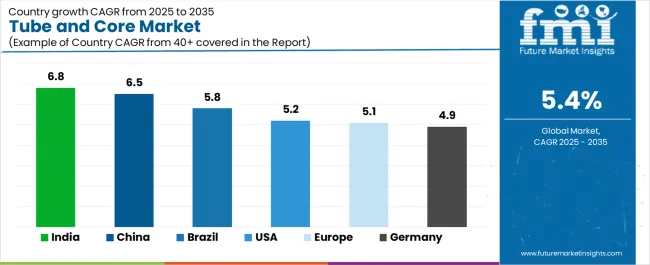
The tube and core market demonstrates varied regional dynamics with Growth Leaders including India (6.8% growth rate) and China (6.5% growth rate) driving expansion through paper manufacturing initiatives and industrial production capacity development. Steady Performers encompass United States (5.2% growth rate), Germany (4.9% growth rate), and developed regions, benefiting from established paper industries and advanced converting technology adoption. Emerging Markets feature Brazil (5.8% growth rate) and developing regions, where industrial initiatives and manufacturing modernization support consistent growth patterns.
Regional synthesis reveals East Asian markets leading adoption through paper mill expansion and textile manufacturing development, while North American countries maintain steady expansion supported by e-commerce growth and packaging technology advancement requirements. European markets show moderate growth driven by converting applications and quality integration trends.
| Region/Country | 2025-2035 Growth | How to win | What to watch out |
|---|---|---|---|
| India | 6.8% | Focus on cost-effective solutions with local fiber sourcing | Raw material availability; regional competition |
| China | 6.5% | Lead with high-capacity production and technical support | Quality consistency; price pressures |
| United States | 5.2% | Provide custom solutions and value-added services | Transportation costs; mill consolidation |
| Germany | 4.9% | Offer premium engineered cores with technical expertise | Over-specification; lengthy approval processes |
| Brazil | 5.8% | Value-oriented products with regional distribution | Currency fluctuations; logistics challenges |
| Europe | 5.1% | Push recycled content and circular economy solutions | Environmental regulations; market fragmentation |
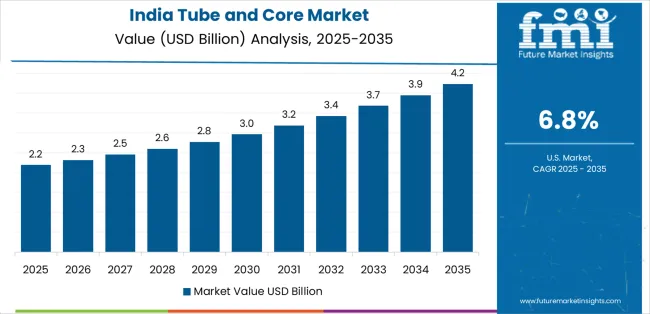
India establishes fastest market growth through aggressive paper manufacturing programs and comprehensive textile production capacity development, integrating advanced tube and core solutions as standard components in paper mill operations and converting installations. The country's 6.8% growth rate reflects government initiatives promoting domestic paper production and manufacturing capabilities that mandate the use of precision core systems in paper and textile facilities. Growth concentrates in major industrial hubs, including Gujarat, Maharashtra, and Tamil Nadu, where paper mill development showcases integrated core supply chains that appeal to industrial operators seeking advanced material handling capabilities and production optimization applications.
Indian manufacturers are developing cost-effective core solutions that combine domestic fiber availability with advanced production features, including automated manufacturing and enhanced dimensional control capabilities. Distribution channels through industrial equipment suppliers and paper merchant distributors expand market access, while government support for paper production supports adoption across diverse industrial and converting segments.
Strategic Market Indicators:
In Guangdong, Zhejiang, and Jiangsu, paper mills and textile facilities are implementing advanced tube and core systems as standard equipment for production optimization and material handling applications, driven by increasing government industrial investment and manufacturing modernization programs that emphasize the importance of dimensional precision capabilities. The market holds a 6.5% growth rate, supported by government paper industry initiatives and textile manufacturing development programs that promote precision core systems for paper and textile facilities. Chinese operators are adopting core solutions that provide consistent dimensional performance and strength characteristics, particularly appealing in coastal regions where production efficiency and quality standards represent critical operational requirements.
Market expansion benefits from growing paper manufacturing capabilities and domestic production infrastructure that enables large-scale production of core systems for paper and textile applications. Technology adoption follows patterns established in packaging materials, where reliability and cost efficiency drive procurement decisions and operational deployment.
Market Intelligence Brief:
United States establishes market leadership through comprehensive paper industry programs and advanced converting infrastructure development, integrating tube and core systems across paper, textile, and film applications. The country's 5.2% growth rate reflects established paper industry relationships and mature core technology adoption that supports widespread use of precision core systems in paper mills and converting facilities. Growth concentrates in major paper regions, including Wisconsin, Georgia, and Alabama, where paper mill operations showcase mature core supply networks that appeal to industrial operators seeking proven dimensional accuracy capabilities and supply reliability applications.
American core manufacturers leverage established distribution networks and comprehensive technical capabilities, including custom engineering services and inventory management programs that create customer relationships and operational advantages. The market benefits from mature quality standards and paper industry requirements that mandate core system use while supporting technology advancement and operational optimization.
Market Intelligence Brief:
Germany's advanced paper technology market demonstrates sophisticated tube and core deployment with documented operational effectiveness in paper mill applications and converting facilities through integration with existing quality systems and manufacturing infrastructure. The country leverages engineering expertise in paper technology and precision manufacturing to maintain a 4.9% growth rate. Industrial centers, including Bavaria, North Rhine-Westphalia, and Baden-Württemberg, showcase premium installations where core systems integrate with comprehensive paper mill platforms and quality management systems to optimize production operations and dimensional effectiveness.
German manufacturers prioritize dimensional precision and EU compliance in core product development, creating demand for premium systems with advanced features, including automated testing integration and precision tolerances. The market benefits from established paper technology infrastructure and a willingness to invest in advanced material technologies that provide long-term operational benefits and compliance with international quality standards.
Market Intelligence Brief:
Brazil's market expansion benefits from diverse industrial demand, including paper mill modernization in São Paulo and Paraná, packaging facility upgrades, and government industrial programs that increasingly incorporate core solutions for production optimization applications. The country maintains a 5.8% growth rate, driven by rising paper production activity and increasing recognition of core technology benefits, including dimensional accuracy and enhanced material efficiency.
Market dynamics focus on cost-effective core solutions that balance dimensional performance with affordability considerations important to Brazilian paper operators. Growing industrial capacity creates continued demand for core systems in new paper mill infrastructure and converting facility modernization projects.
Strategic Market Considerations:
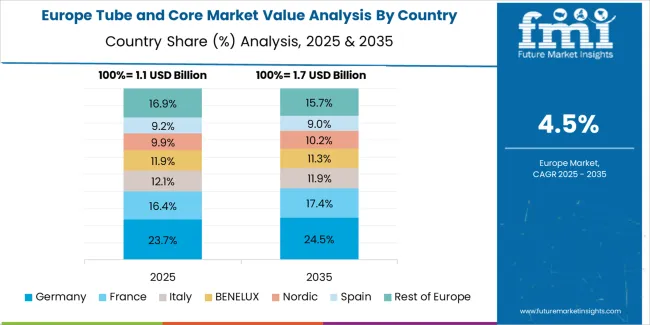
The European tube and core market is projected to grow from USD 1.4 billion in 2025 to USD 2.3 billion by 2035, registering a CAGR of 5.1% over the forecast period. Germany is expected to maintain its leadership position with a 32.6% market share in 2025, supported by its advanced paper technology infrastructure and major paper mill concentrations.
United Kingdom follows with a 19.8% share in 2025, driven by comprehensive packaging programs and converting technology development initiatives. France holds a 16.2% share through specialized paper applications and quality compliance requirements. Italy commands a 14.7% share, while Spain accounts for 11.4% in 2025. The rest of Europe region is anticipated to gain momentum, expanding its collective share from 5.3% to 5.9% by 2035, attributed to increasing paper mill adoption in Nordic countries and emerging converting facilities implementing production modernization programs.
| Stakeholder | What they actually control | Typical strengths | Typical blind spots |
|---|---|---|---|
| Global platforms | Multi-regional production, broad product range, distribution scale | Wide availability, production consistency, multi-plant redundancy | Customization agility; regional responsiveness |
| Technology innovators | Material innovation; composite cores; specialty applications | Advanced materials first; engineering support | Production cost pressures; volume economics |
| Regional specialists | Local fiber sourcing, fast delivery, nearby production | "Close to customer" supply; freight advantages; regional relationships | Technology limitations; capacity constraints |
| Integrated producers | Vertical integration, paperboard production, converting capabilities | Cost control; material security; production efficiency | Market flexibility; customer concentration |
| Service-focused ecosystems | VMI programs, inventory management, custom printing | Lowest total cost; comprehensive support | Service costs if volumes decline; customer dependencies |
| Item | Value |
|---|---|
| Quantitative Units | USD 4.2 billion |
| Material Type | Paper Cores, Composite Cores, Plastic Cores |
| Application | Paper and Paperboard, Textiles, Films and Tapes, Adhesives, Others |
| Wall Thickness | Thin-Wall (below 5mm), Medium-Wall (5-10mm), Thick-Wall (above 10mm) |
| End Use | Paper Mills, Textile Manufacturers, Film Producers, Packaging Converters, Printing Companies |
| Regions Covered | North America, Latin America, Western Europe, Eastern Europe, East Asia, South Asia Pacific, Middle East & Africa |
| Countries Covered | United States, China, Germany, India, United Kingdom, Japan, Canada, Brazil, France, Italy, and 30+ additional countries |
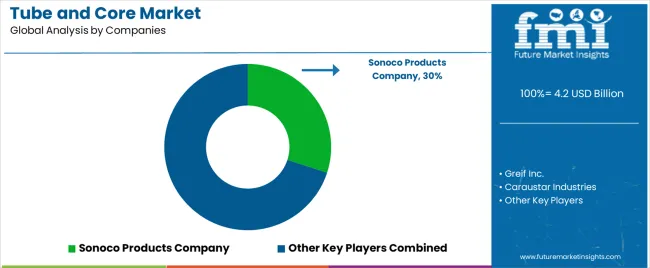
| Key Companies Profiled | Sonoco Products Company, Greif Inc., Caraustar Industries, VPK Packaging Group, Paramount Tube, Valk Industries, Crescent Paper Tube Company, Ox Paper Tube & Core, LCH Paper Tube and Core, Albert Eger AG |
| Additional Attributes | Dollar sales by material type and application categories, regional adoption trends across North America, East Asia, and Western Europe, competitive landscape with paper manufacturers and converting suppliers, industrial operator preferences for dimensional accuracy and structural strength, integration with winding systems and material handling equipment, innovations in composite materials and precision manufacturing, and development of recycled content solutions with enhanced performance and cost optimization capabilities. |
The global tube and core market is estimated to be valued at USD 4.2 billion in 2025.
The market size for the tube and core market is projected to reach USD 7.1 billion by 2035.
The tube and core market is expected to grow at a 5.4% CAGR between 2025 and 2035.
The key product types in tube and core market are paper cores, composite cores and plastic cores.
In terms of application, paper and paperboard segment to command 38.0% share in the tube and core market in 2025.


Our Research Products

The "Full Research Suite" delivers actionable market intel, deep dives on markets or technologies, so clients act faster, cut risk, and unlock growth.

The Leaderboard benchmarks and ranks top vendors, classifying them as Established Leaders, Leading Challengers, or Disruptors & Challengers.

Locates where complements amplify value and substitutes erode it, forecasting net impact by horizon

We deliver granular, decision-grade intel: market sizing, 5-year forecasts, pricing, adoption, usage, revenue, and operational KPIs—plus competitor tracking, regulation, and value chains—across 60 countries broadly.

Spot the shifts before they hit your P&L. We track inflection points, adoption curves, pricing moves, and ecosystem plays to show where demand is heading, why it is changing, and what to do next across high-growth markets and disruptive tech

Real-time reads of user behavior. We track shifting priorities, perceptions of today’s and next-gen services, and provider experience, then pace how fast tech moves from trial to adoption, blending buyer, consumer, and channel inputs with social signals (#WhySwitch, #UX).

Partner with our analyst team to build a custom report designed around your business priorities. From analysing market trends to assessing competitors or crafting bespoke datasets, we tailor insights to your needs.
Supplier Intelligence
Discovery & Profiling
Capacity & Footprint
Performance & Risk
Compliance & Governance
Commercial Readiness
Who Supplies Whom
Scorecards & Shortlists
Playbooks & Docs
Category Intelligence
Definition & Scope
Demand & Use Cases
Cost Drivers
Market Structure
Supply Chain Map
Trade & Policy
Operating Norms
Deliverables
Buyer Intelligence
Account Basics
Spend & Scope
Procurement Model
Vendor Requirements
Terms & Policies
Entry Strategy
Pain Points & Triggers
Outputs
Pricing Analysis
Benchmarks
Trends
Should-Cost
Indexation
Landed Cost
Commercial Terms
Deliverables
Brand Analysis
Positioning & Value Prop
Share & Presence
Customer Evidence
Go-to-Market
Digital & Reputation
Compliance & Trust
KPIs & Gaps
Outputs
Full Research Suite comprises of:
Market outlook & trends analysis
Interviews & case studies
Strategic recommendations
Vendor profiles & capabilities analysis
5-year forecasts
8 regions and 60+ country-level data splits
Market segment data splits
12 months of continuous data updates
DELIVERED AS:
PDF EXCEL ONLINE
Competitive Overview of Tube and Core Market Share
Paper Tubes & Core Industry Analysis in United States Trends, Size, and Forecast for 2025-2035
Tube Tester Market Size and Share Forecast Outlook 2025 to 2035
Core Plate Varnishes Market Size and Share Forecast Outlook 2025 to 2035
Tube Rotator Market Size and Share Forecast Outlook 2025 to 2035
Tuberculosis Therapeutics Market Size and Share Forecast Outlook 2025 to 2035
Tube Laminating Films Market Size and Share Forecast Outlook 2025 to 2035
Tube Filling Machine Market Size and Share Forecast Outlook 2025 to 2035
Tube Ice Machine Market Size and Share Forecast Outlook 2025 to 2035
Tube Closures Market Size and Share Forecast Outlook 2025 to 2035
Tube Sealing Machines Market Analysis by Tube type, Technology type, End User, and Region through 2025 to 2035
Tuberculous Meningitis Treatment Market - Demand & Innovations 2025 to 2035
Tube Feeding Formula Market Analysis by Product Type, Form, End User, Primary Condition and Distribution Channel Through 2035
Market Share Distribution Among Tube Filling Machine Manufacturers
Competitive Breakdown of Tube Sealing Machines Providers
Breaking Down Market Share in Tube Laminating Films
Tube and Dressing Securement Products Market
Tuberculosis Diagnostics Market
Core Drill Automatic Feeding Machine Market
Tubes, Bottles and Tottles Market

Thank you!
You will receive an email from our Business Development Manager. Please be sure to check your SPAM/JUNK folder too.
Chat With
MaRIA