U-Tube Viscometer Market Size and Share Forecast Outlook 2025 to 2035

The U-Tube Viscometer Market is estimated to be valued at USD 2.9 billion in 2025 and is projected to reach USD 4.5 billion by 2035, registering a compound annual growth rate (CAGR) of 4.6% over the forecast period.
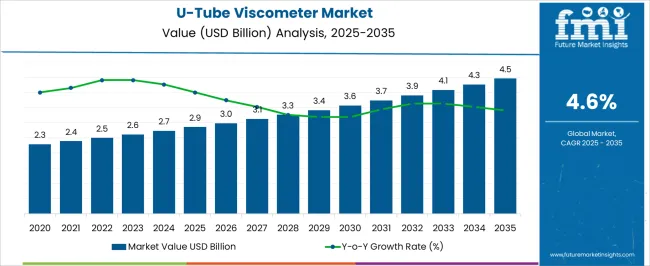
Quick Stats for U-Tube Viscometer Market

  • U-Tube Viscometer Market Value (2025): USD 2.9 billion
  • U-Tube Viscometer Market Forecast Value (2035): USD 4.5 billion
  • U-Tube Viscometer Market Forecast CAGR: 4.6%
  • Leading Segment in U-Tube Viscometer Market in 2025: U-Tube Viscometers for Laboratories (45.0%)
  • Key Growth Regions in U-Tube Viscometer Market: North America, Asia-Pacific, Europe
  • Top Key Players in U-Tube Viscometer Market: Anton Paar GmbH, Thermo Fisher Scientific, A&D Company, Goettfert GmbH, Fann Instrument, Freeman Technology, Brabender GmbH, Cannon Instrument Company

U Tube Viscometer Market Market Value Analysis

U-Tube Viscometer Market Key Takeaways

Metric Value
U-Tube Viscometer Market Estimated Value in (2025 E) USD 2.9 billion
U-Tube Viscometer Market Forecast Value in (2035 F) USD 4.5 billion
Forecast CAGR (2025 to 2035) 4.6%

Why is the U-Tube Viscometer Market Growing?

The U-Tube Viscometer market is experiencing steady growth due to its essential role in accurately measuring the viscosity of fluids across laboratories, healthcare, and industrial applications. The market expansion is being influenced by increasing demand for precise quality control and process optimization in chemical, pharmaceutical, and research settings.

Growth is being further driven by the rising adoption of standardized laboratory practices and the integration of digital measurement systems, which enhance reliability and efficiency. The development of advanced U-Tube viscometers that support faster measurements, improved accuracy, and compatibility with automated laboratory instruments is shaping the future outlook.

Additionally, the increasing emphasis on hospital-based diagnostics and clinical research has expanded the usage of these instruments beyond traditional industrial laboratories As industries continue to invest in scientific research and process efficiency, and as healthcare providers prioritize accurate fluid analysis for diagnostics, the U-Tube Viscometer market is expected to maintain consistent growth while offering opportunities for product innovation and enhanced software-driven analysis.

Segmental Analysis

The u-tube viscometer market is segmented by type, capacity, end use, and geographic regions. By type, u-tube viscometer market is divided into U-Tube Viscometers for Laboratories and Industrial U-Tube Viscometers. In terms of capacity, u-tube viscometer market is classified into U-Tube Viscometers Up-to 120 mm/sec2, U-Tube Viscometers from 120-4000 mm/sec2, and U-Tube Viscometers Above 4000 mm/sec2. Based on end use, u-tube viscometer market is segmented into U-Tube Viscometers for Hospitals, U-Tube Viscometers for Research And Academic Institutes, and U-Tube Viscometers for Biotechnology And Pharmaceutical Industries. Regionally, the u-tube viscometer industry is classified into North America, Latin America, Western Europe, Eastern Europe, Balkan & Baltic Countries, Russia & Belarus, Central Asia, East Asia, South Asia & Pacific, and the Middle East & Africa.
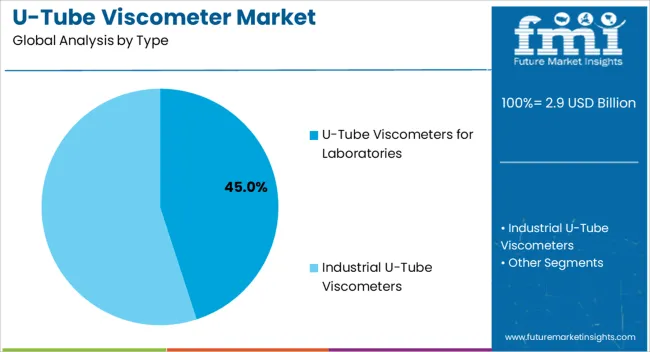
Insights into the U-Tube Viscometers for Laboratories Segment

U Tube Viscometer Market Analysis By Type

The U-Tube Viscometers for Laboratories segment is projected to hold 45.00% of the overall market revenue in 2025, establishing it as the leading type segment. This dominance is being driven by the critical need for precise viscosity measurements in research laboratories, quality control units, and educational institutions.

Adoption has been encouraged due to the instrument’s ability to deliver repeatable and accurate results across a wide range of fluid types. Laboratories benefit from U-Tube viscometers because they are highly compatible with standard analytical procedures and allow integration with automated systems for faster throughput.

Growth in this segment has also been influenced by the expansion of scientific research funding, increasing global focus on chemical and pharmaceutical innovation, and the rising demand for standardized laboratory equipment The segment is expected to continue its leading position as laboratories increasingly seek reliable, accurate, and cost-effective solutions that ensure compliance with analytical and regulatory standards.
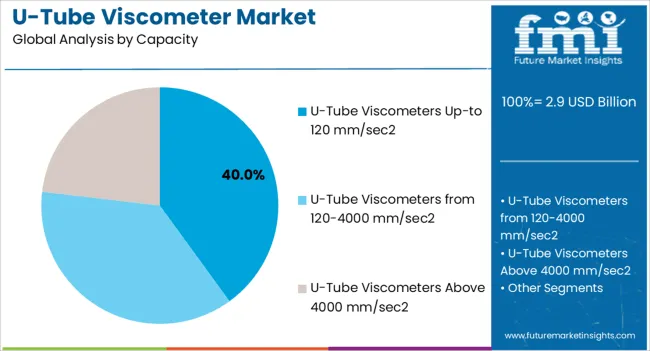
Insights into the U-Tube Viscometers Up-to 120 mm/sec2 Segment

U Tube Viscometer Market Analysis By Capacity

The capacity-based segment of U-Tube Viscometers Up-to 120 mm/sec2 is expected to capture 40.00% of the market in 2025, making it the largest capacity category. This segment has gained prominence due to its suitability for a broad range of fluid viscosity testing, offering an optimal balance between precision and measurement speed.

High adoption is being encouraged by industries and research institutions that require consistent performance under controlled laboratory conditions. The moderate capacity range allows for flexible applications across chemical analysis, pharmaceuticals, and material testing without compromising accuracy.

Growth in this segment is being further supported by the increasing automation of laboratory processes, which necessitates reliable viscometers capable of handling repetitive measurements efficiently The segment is projected to maintain its market share as laboratories and research facilities continue to prioritize instruments that offer repeatable results, ease of use, and adaptability to evolving analytical techniques.
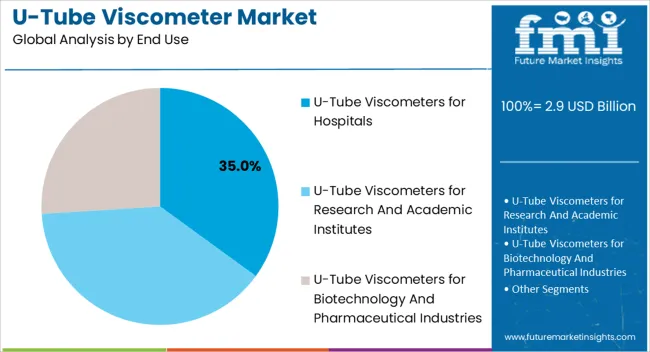
Insights into the U-Tube Viscometers for Hospitals Segment

U Tube Viscometer Market Analysis By End Use

The end-use segment of U-Tube Viscometers for Hospitals is anticipated to hold 35.00% of the market revenue in 2025, positioning it as a key end-user segment. This growth has been driven by the increasing adoption of viscometers for clinical diagnostics, blood analysis, and pharmaceutical quality control within hospital settings.

U-Tube viscometers are preferred in healthcare environments due to their accuracy, ease of maintenance, and ability to provide consistent measurements for medical and laboratory personnel. The segment’s expansion is also being supported by the rising focus on patient safety, regulatory compliance, and quality assurance in hospital laboratories.

Adoption has been enhanced by the growing demand for rapid, precise, and reliable viscosity testing as part of diagnostic workflows and hospital-based research initiatives The segment is expected to continue growing as hospitals increasingly integrate laboratory-grade instrumentation and automation to improve efficiency, optimize patient outcomes, and support clinical research programs.

Market Overview

U-Tube Viscometer Market Overview

Global U-Tube Viscometer Market demand is anticipated to be valued at US$ 2.5 Billion in 2025, forecast to grow at a CAGR of 4.55% to be valued at US$ 3.9 Billion from 2025 to 2035. The growth of the U-Tube Viscometer Market is attributed to its global utilization across the Testing Equipment industry.

Report Attribute Details
Estimated Base Year Value (2025) US$ 2.1 Billion
Expected Market Value (2025) US$ 2.5 Billion
Anticipated Forecast Value (2035) US$ 3.9 Billion
Projected Growth Rate (2025-2035) 4.55% CAGR

The U-Tube Viscometer, also known as BS Tube Meter, is an instrument that measures kinematic viscosity of transparent Newtonian liquids according to ASTM D445 and ISO 3104. U-Tube viscometer is also referred to as capillary viscometer or Ostwald viscometer. Minimum sample volume of the U-Tube viscometer is 7 mL (size A-C); 12 mL (size D-F); 23 mL (size G-H), Minimum bath depth is 280 mm (11 in). Viscometers are provided with a certificate of calibration and instruction sheet. Holders are available in sizes G & H only (H100).

Asia Pacific is considered to be a dominant region for the U-Tube Viscometer Market, owing to the strong investments in China, and India towards innovation and developments.

The major factor that is expected to propel the growth of the U-Tube Viscometer Market during the forecast period includes the rise in technological advancements in the healthcare industry.

The factor that is expected to hinder the growth of the U-Tube Viscometer Market during the forecast period includes a rise in instrumental automation in laboratories, and presence of the alternative of the traditional viscometer.
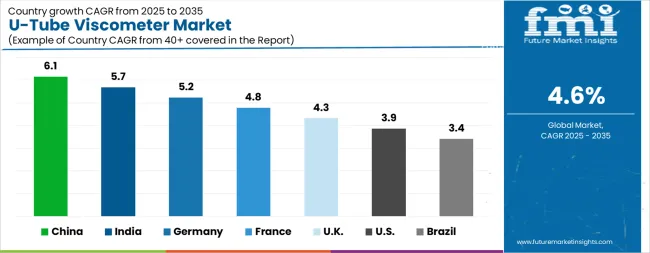
Analysis of U-Tube Viscometer Market By Key Countries

U Tube Viscometer Market Cagr Analysis By Country

Country CAGR
China 6.1%
India 5.7%
Germany 5.2%
France 4.8%
UK 4.3%
USA 3.9%
Brazil 3.4%

Country-wise Analysis

The U-Tube Viscometer Market is expected to register a CAGR of 4.6% during the forecast period, exhibiting varied country level momentum. China leads with the highest CAGR of 6.1%, followed by India at 5.7%. Developed markets such as Germany, France, and the UK continue to expand steadily, while the USA is likely to grow at consistent rates. Brazil posts the lowest CAGR at 3.4%, yet still underscores a broadly positive trajectory for the global U-Tube Viscometer Market. In 2024, Germany held a dominant revenue in the Western Europe market and is expected to grow with a CAGR of 5.2%. The USA U-Tube Viscometer Market is estimated to be valued at USD 1.0 billion in 2025 and is anticipated to reach a valuation of USD 1.5 billion by 2035. Sales are projected to rise at a CAGR of 3.9% over the forecast period between 2025 and 2035. While Japan and South Korea markets are estimated to be valued at USD 129.0 million and USD 83.7 million respectively in 2025.
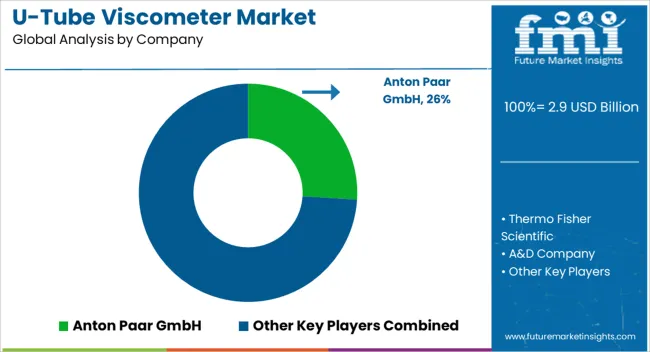
Key Players in the U-Tube Viscometer Market

U Tube Viscometer Market Analysis By Company

  • Anton Paar GmbH
  • Thermo Fisher Scientific
  • A&D Company
  • Goettfert GmbH
  • Fann Instrument
  • Freeman Technology
  • Brabender GmbH
  • Cannon Instrument Company

Scope of the Report

Item Value
Quantitative Units USD 2.9 Billion
Type U-Tube Viscometers for Laboratories and Industrial U-Tube Viscometers
Capacity U-Tube Viscometers Up-to 120 mm/sec2, U-Tube Viscometers from 120-4000 mm/sec2, and U-Tube Viscometers Above 4000 mm/sec2
End Use U-Tube Viscometers for Hospitals, U-Tube Viscometers for Research And Academic Institutes, and U-Tube Viscometers for Biotechnology And Pharmaceutical Industries
Regions Covered North America, Europe, Asia-Pacific, Latin America, Middle East & Africa
Country Covered United States, Canada, Germany, France, United Kingdom, China, Japan, India, Brazil, South Africa
Key Companies Profiled Anton Paar GmbH, Thermo Fisher Scientific, A&D Company, Goettfert GmbH, Fann Instrument, Freeman Technology, Brabender GmbH, and Cannon Instrument Company

U-Tube Viscometer Market by Segments

Type:

  • U-Tube Viscometers for Laboratories
  • Industrial U-Tube Viscometers

Capacity:

  • U-Tube Viscometers Up-to 120 mm/sec2
  • U-Tube Viscometers from 120-4000 mm/sec2
  • U-Tube Viscometers Above 4000 mm/sec2

End Use:

  • U-Tube Viscometers for Hospitals
  • U-Tube Viscometers for Research And Academic Institutes
  • U-Tube Viscometers for Biotechnology And Pharmaceutical Industries

Region:

  • North America
    • USA
    • Canada
    • Mexico
  • Latin America
    • Brazil
    • Chile
    • Rest of Latin America
  • Western Europe
    • Germany
    • UK
    • Italy
    • Spain
    • France
    • Nordic
    • BENELUX
    • Rest of Western Europe
  • Eastern Europe
    • Russia
    • Poland
    • Hungary
    • Balkan & Baltic
    • Rest of Eastern Europe
  • East Asia
    • China
    • Japan
    • South Korea
  • South Asia and Pacific
    • India
    • ASEAN
    • Australia & New Zealand
    • Rest of South Asia and Pacific
  • Middle East & Africa
    • Kingdom of Saudi Arabia
    • Other GCC Countries
    • Turkiye
    • South Africa
    • Other African Union
    • Rest of Middle East & Africa

Table of Content

  1. Executive Summary
    • Global Market Outlook
    • Demand-side Trends
    • Supply-side Trends
    • Technology Roadmap Analysis
    • Analysis and Recommendations
  2. Market Overview
    • Market Coverage / Taxonomy
    • Market Definition / Scope / Limitations
  3. Market Background
    • Market Dynamics
      • Drivers
      • Restraints
      • Opportunity
      • Trends
    • Scenario Forecast
      • Demand in Optimistic Scenario
      • Demand in Likely Scenario
      • Demand in Conservative Scenario
    • Opportunity Map Analysis
    • Product Life Cycle Analysis
    • Supply Chain Analysis
    • Investment Feasibility Matrix
    • Value Chain Analysis
    • PESTLE and Porter’s Analysis
    • Regulatory Landscape
    • Regional Parent Market Outlook
    • Production and Consumption Statistics
    • Import and Export Statistics
  4. Global Market Analysis 2020 to 2024 and Forecast, 2025 to 2035
    • Historical Market Size Value (USD Million) Analysis, 2020 to 2024
    • Current and Future Market Size Value (USD Million) Projections, 2025 to 2035
      • Y-o-Y Growth Trend Analysis
      • Absolute $ Opportunity Analysis
  5. Global Market Pricing Analysis 2020 to 2024 and Forecast 2025 to 2035
  6. Global Market Analysis 2020 to 2024 and Forecast 2025 to 2035, By Type
    • Introduction / Key Findings
    • Historical Market Size Value (USD Million) Analysis By Type , 2020 to 2024
    • Current and Future Market Size Value (USD Million) Analysis and Forecast By Type , 2025 to 2035
      • s for Laboratories
      • Industrial s
    • Y-o-Y Growth Trend Analysis By Type , 2020 to 2024
    • Absolute $ Opportunity Analysis By Type , 2025 to 2035
  7. Global Market Analysis 2020 to 2024 and Forecast 2025 to 2035, By Capacity
    • Introduction / Key Findings
    • Historical Market Size Value (USD Million) Analysis By Capacity, 2020 to 2024
    • Current and Future Market Size Value (USD Million) Analysis and Forecast By Capacity, 2025 to 2035
      • s Up-to 120 mm/sec2
      • s from 120-4000 mm/sec2
      • s Above 4000 mm/sec2
    • Y-o-Y Growth Trend Analysis By Capacity, 2020 to 2024
    • Absolute $ Opportunity Analysis By Capacity, 2025 to 2035
  8. Global Market Analysis 2020 to 2024 and Forecast 2025 to 2035, By End Use
    • Introduction / Key Findings
    • Historical Market Size Value (USD Million) Analysis By End Use, 2020 to 2024
    • Current and Future Market Size Value (USD Million) Analysis and Forecast By End Use, 2025 to 2035
      • s for Hospitals
      • s for Research And Academic Institutes
      • s for Biotechnology And Pharmaceutical Industries
    • Y-o-Y Growth Trend Analysis By End Use, 2020 to 2024
    • Absolute $ Opportunity Analysis By End Use, 2025 to 2035
  9. Global Market Analysis 2020 to 2024 and Forecast 2025 to 2035, By Region
    • Introduction
    • Historical Market Size Value (USD Million) Analysis By Region, 2020 to 2024
    • Current Market Size Value (USD Million) Analysis and Forecast By Region, 2025 to 2035
      • North America
      • Latin America
      • Western Europe
      • Eastern Europe
      • East Asia
      • South Asia and Pacific
      • Middle East & Africa
    • Market Attractiveness Analysis By Region
  10. North America Market Analysis 2020 to 2024 and Forecast 2025 to 2035, By Country
    • Historical Market Size Value (USD Million) Trend Analysis By Market Taxonomy, 2020 to 2024
    • Market Size Value (USD Million) Forecast By Market Taxonomy, 2025 to 2035
      • By Country
        • USA
        • Canada
        • Mexico
      • By Type
      • By Capacity
      • By End Use
    • Market Attractiveness Analysis
      • By Country
      • By Type
      • By Capacity
      • By End Use
    • Key Takeaways
  11. Latin America Market Analysis 2020 to 2024 and Forecast 2025 to 2035, By Country
    • Historical Market Size Value (USD Million) Trend Analysis By Market Taxonomy, 2020 to 2024
    • Market Size Value (USD Million) Forecast By Market Taxonomy, 2025 to 2035
      • By Country
        • Brazil
        • Chile
        • Rest of Latin America
      • By Type
      • By Capacity
      • By End Use
    • Market Attractiveness Analysis
      • By Country
      • By Type
      • By Capacity
      • By End Use
    • Key Takeaways
  12. Western Europe Market Analysis 2020 to 2024 and Forecast 2025 to 2035, By Country
    • Historical Market Size Value (USD Million) Trend Analysis By Market Taxonomy, 2020 to 2024
    • Market Size Value (USD Million) Forecast By Market Taxonomy, 2025 to 2035
      • By Country
        • Germany
        • UK
        • Italy
        • Spain
        • France
        • Nordic
        • BENELUX
        • Rest of Western Europe
      • By Type
      • By Capacity
      • By End Use
    • Market Attractiveness Analysis
      • By Country
      • By Type
      • By Capacity
      • By End Use
    • Key Takeaways
  13. Eastern Europe Market Analysis 2020 to 2024 and Forecast 2025 to 2035, By Country
    • Historical Market Size Value (USD Million) Trend Analysis By Market Taxonomy, 2020 to 2024
    • Market Size Value (USD Million) Forecast By Market Taxonomy, 2025 to 2035
      • By Country
        • Russia
        • Poland
        • Hungary
        • Balkan & Baltic
        • Rest of Eastern Europe
      • By Type
      • By Capacity
      • By End Use
    • Market Attractiveness Analysis
      • By Country
      • By Type
      • By Capacity
      • By End Use
    • Key Takeaways
  14. East Asia Market Analysis 2020 to 2024 and Forecast 2025 to 2035, By Country
    • Historical Market Size Value (USD Million) Trend Analysis By Market Taxonomy, 2020 to 2024
    • Market Size Value (USD Million) Forecast By Market Taxonomy, 2025 to 2035
      • By Country
        • China
        • Japan
        • South Korea
      • By Type
      • By Capacity
      • By End Use
    • Market Attractiveness Analysis
      • By Country
      • By Type
      • By Capacity
      • By End Use
    • Key Takeaways
  15. South Asia and Pacific Market Analysis 2020 to 2024 and Forecast 2025 to 2035, By Country
    • Historical Market Size Value (USD Million) Trend Analysis By Market Taxonomy, 2020 to 2024
    • Market Size Value (USD Million) Forecast By Market Taxonomy, 2025 to 2035
      • By Country
        • India
        • ASEAN
        • Australia & New Zealand
        • Rest of South Asia and Pacific
      • By Type
      • By Capacity
      • By End Use
    • Market Attractiveness Analysis
      • By Country
      • By Type
      • By Capacity
      • By End Use
    • Key Takeaways
  16. Middle East & Africa Market Analysis 2020 to 2024 and Forecast 2025 to 2035, By Country
    • Historical Market Size Value (USD Million) Trend Analysis By Market Taxonomy, 2020 to 2024
    • Market Size Value (USD Million) Forecast By Market Taxonomy, 2025 to 2035
      • By Country
        • Kingdom of Saudi Arabia
        • Other GCC Countries
        • Turkiye
        • South Africa
        • Other African Union
        • Rest of Middle East & Africa
      • By Type
      • By Capacity
      • By End Use
    • Market Attractiveness Analysis
      • By Country
      • By Type
      • By Capacity
      • By End Use
    • Key Takeaways
  17. Key Countries Market Analysis
    • USA
      • Pricing Analysis
      • Market Share Analysis, 2024
        • By Type
        • By Capacity
        • By End Use
    • Canada
      • Pricing Analysis
      • Market Share Analysis, 2024
        • By Type
        • By Capacity
        • By End Use
    • Mexico
      • Pricing Analysis
      • Market Share Analysis, 2024
        • By Type
        • By Capacity
        • By End Use
    • Brazil
      • Pricing Analysis
      • Market Share Analysis, 2024
        • By Type
        • By Capacity
        • By End Use
    • Chile
      • Pricing Analysis
      • Market Share Analysis, 2024
        • By Type
        • By Capacity
        • By End Use
    • Germany
      • Pricing Analysis
      • Market Share Analysis, 2024
        • By Type
        • By Capacity
        • By End Use
    • UK
      • Pricing Analysis
      • Market Share Analysis, 2024
        • By Type
        • By Capacity
        • By End Use
    • Italy
      • Pricing Analysis
      • Market Share Analysis, 2024
        • By Type
        • By Capacity
        • By End Use
    • Spain
      • Pricing Analysis
      • Market Share Analysis, 2024
        • By Type
        • By Capacity
        • By End Use
    • France
      • Pricing Analysis
      • Market Share Analysis, 2024
        • By Type
        • By Capacity
        • By End Use
    • India
      • Pricing Analysis
      • Market Share Analysis, 2024
        • By Type
        • By Capacity
        • By End Use
    • ASEAN
      • Pricing Analysis
      • Market Share Analysis, 2024
        • By Type
        • By Capacity
        • By End Use
    • Australia & New Zealand
      • Pricing Analysis
      • Market Share Analysis, 2024
        • By Type
        • By Capacity
        • By End Use
    • China
      • Pricing Analysis
      • Market Share Analysis, 2024
        • By Type
        • By Capacity
        • By End Use
    • Japan
      • Pricing Analysis
      • Market Share Analysis, 2024
        • By Type
        • By Capacity
        • By End Use
    • South Korea
      • Pricing Analysis
      • Market Share Analysis, 2024
        • By Type
        • By Capacity
        • By End Use
    • Russia
      • Pricing Analysis
      • Market Share Analysis, 2024
        • By Type
        • By Capacity
        • By End Use
    • Poland
      • Pricing Analysis
      • Market Share Analysis, 2024
        • By Type
        • By Capacity
        • By End Use
    • Hungary
      • Pricing Analysis
      • Market Share Analysis, 2024
        • By Type
        • By Capacity
        • By End Use
    • Kingdom of Saudi Arabia
      • Pricing Analysis
      • Market Share Analysis, 2024
        • By Type
        • By Capacity
        • By End Use
    • Turkiye
      • Pricing Analysis
      • Market Share Analysis, 2024
        • By Type
        • By Capacity
        • By End Use
    • South Africa
      • Pricing Analysis
      • Market Share Analysis, 2024
        • By Type
        • By Capacity
        • By End Use
  18. Market Structure Analysis
    • Competition Dashboard
    • Competition Benchmarking
    • Market Share Analysis of Top Players
      • By Regional
      • By Type
      • By Capacity
      • By End Use
  19. Competition Analysis
    • Competition Deep Dive
      • Anton Paar GmbH
        • Overview
        • Product Portfolio
        • Profitability by Market Segments (Product/Age /Sales Channel/Region)
        • Sales Footprint
        • Strategy Overview
          • Marketing Strategy
          • Product Strategy
          • Channel Strategy
      • Thermo Fisher Scientific
      • A&D Company
      • Goettfert GmbH
      • Fann Instrument
      • Freeman Technology
      • Brabender GmbH
      • Cannon Instrument Company
  20. Assumptions & Acronyms Used
  21. Research Methodology

List of Tables

  • Table 1: Global Market Value (USD Million) Forecast by Region, 2020 to 2035
  • Table 2: Global Market Value (USD Million) Forecast by Type , 2020 to 2035
  • Table 3: Global Market Value (USD Million) Forecast by Capacity, 2020 to 2035
  • Table 4: Global Market Value (USD Million) Forecast by End Use, 2020 to 2035
  • Table 5: North America Market Value (USD Million) Forecast by Country, 2020 to 2035
  • Table 6: North America Market Value (USD Million) Forecast by Type , 2020 to 2035
  • Table 7: North America Market Value (USD Million) Forecast by Capacity, 2020 to 2035
  • Table 8: North America Market Value (USD Million) Forecast by End Use, 2020 to 2035
  • Table 9: Latin America Market Value (USD Million) Forecast by Country, 2020 to 2035
  • Table 10: Latin America Market Value (USD Million) Forecast by Type , 2020 to 2035
  • Table 11: Latin America Market Value (USD Million) Forecast by Capacity, 2020 to 2035
  • Table 12: Latin America Market Value (USD Million) Forecast by End Use, 2020 to 2035
  • Table 13: Western Europe Market Value (USD Million) Forecast by Country, 2020 to 2035
  • Table 14: Western Europe Market Value (USD Million) Forecast by Type , 2020 to 2035
  • Table 15: Western Europe Market Value (USD Million) Forecast by Capacity, 2020 to 2035
  • Table 16: Western Europe Market Value (USD Million) Forecast by End Use, 2020 to 2035
  • Table 17: Eastern Europe Market Value (USD Million) Forecast by Country, 2020 to 2035
  • Table 18: Eastern Europe Market Value (USD Million) Forecast by Type , 2020 to 2035
  • Table 19: Eastern Europe Market Value (USD Million) Forecast by Capacity, 2020 to 2035
  • Table 20: Eastern Europe Market Value (USD Million) Forecast by End Use, 2020 to 2035
  • Table 21: East Asia Market Value (USD Million) Forecast by Country, 2020 to 2035
  • Table 22: East Asia Market Value (USD Million) Forecast by Type , 2020 to 2035
  • Table 23: East Asia Market Value (USD Million) Forecast by Capacity, 2020 to 2035
  • Table 24: East Asia Market Value (USD Million) Forecast by End Use, 2020 to 2035
  • Table 25: South Asia and Pacific Market Value (USD Million) Forecast by Country, 2020 to 2035
  • Table 26: South Asia and Pacific Market Value (USD Million) Forecast by Type , 2020 to 2035
  • Table 27: South Asia and Pacific Market Value (USD Million) Forecast by Capacity, 2020 to 2035
  • Table 28: South Asia and Pacific Market Value (USD Million) Forecast by End Use, 2020 to 2035
  • Table 29: Middle East & Africa Market Value (USD Million) Forecast by Country, 2020 to 2035
  • Table 30: Middle East & Africa Market Value (USD Million) Forecast by Type , 2020 to 2035
  • Table 31: Middle East & Africa Market Value (USD Million) Forecast by Capacity, 2020 to 2035
  • Table 32: Middle East & Africa Market Value (USD Million) Forecast by End Use, 2020 to 2035

List of Figures

  • Figure 1: Global Market Pricing Analysis
  • Figure 2: Global Market Value (USD Million) Forecast 2020-2035
  • Figure 3: Global Market Value Share and BPS Analysis by Type , 2025 and 2035
  • Figure 4: Global Market Y-o-Y Growth Comparison by Type , 2025-2035
  • Figure 5: Global Market Attractiveness Analysis by Type
  • Figure 6: Global Market Value Share and BPS Analysis by Capacity, 2025 and 2035
  • Figure 7: Global Market Y-o-Y Growth Comparison by Capacity, 2025-2035
  • Figure 8: Global Market Attractiveness Analysis by Capacity
  • Figure 9: Global Market Value Share and BPS Analysis by End Use, 2025 and 2035
  • Figure 10: Global Market Y-o-Y Growth Comparison by End Use, 2025-2035
  • Figure 11: Global Market Attractiveness Analysis by End Use
  • Figure 12: Global Market Value (USD Million) Share and BPS Analysis by Region, 2025 and 2035
  • Figure 13: Global Market Y-o-Y Growth Comparison by Region, 2025-2035
  • Figure 14: Global Market Attractiveness Analysis by Region
  • Figure 15: North America Market Incremental Dollar Opportunity, 2025-2035
  • Figure 16: Latin America Market Incremental Dollar Opportunity, 2025-2035
  • Figure 17: Western Europe Market Incremental Dollar Opportunity, 2025-2035
  • Figure 18: Eastern Europe Market Incremental Dollar Opportunity, 2025-2035
  • Figure 19: East Asia Market Incremental Dollar Opportunity, 2025-2035
  • Figure 20: South Asia and Pacific Market Incremental Dollar Opportunity, 2025-2035
  • Figure 21: Middle East & Africa Market Incremental Dollar Opportunity, 2025-2035
  • Figure 22: North America Market Value Share and BPS Analysis by Country, 2025 and 2035
  • Figure 23: North America Market Value Share and BPS Analysis by Type , 2025 and 2035
  • Figure 24: North America Market Y-o-Y Growth Comparison by Type , 2025-2035
  • Figure 25: North America Market Attractiveness Analysis by Type
  • Figure 26: North America Market Value Share and BPS Analysis by Capacity, 2025 and 2035
  • Figure 27: North America Market Y-o-Y Growth Comparison by Capacity, 2025-2035
  • Figure 28: North America Market Attractiveness Analysis by Capacity
  • Figure 29: North America Market Value Share and BPS Analysis by End Use, 2025 and 2035
  • Figure 30: North America Market Y-o-Y Growth Comparison by End Use, 2025-2035
  • Figure 31: North America Market Attractiveness Analysis by End Use
  • Figure 32: Latin America Market Value Share and BPS Analysis by Country, 2025 and 2035
  • Figure 33: Latin America Market Value Share and BPS Analysis by Type , 2025 and 2035
  • Figure 34: Latin America Market Y-o-Y Growth Comparison by Type , 2025-2035
  • Figure 35: Latin America Market Attractiveness Analysis by Type
  • Figure 36: Latin America Market Value Share and BPS Analysis by Capacity, 2025 and 2035
  • Figure 37: Latin America Market Y-o-Y Growth Comparison by Capacity, 2025-2035
  • Figure 38: Latin America Market Attractiveness Analysis by Capacity
  • Figure 39: Latin America Market Value Share and BPS Analysis by End Use, 2025 and 2035
  • Figure 40: Latin America Market Y-o-Y Growth Comparison by End Use, 2025-2035
  • Figure 41: Latin America Market Attractiveness Analysis by End Use
  • Figure 42: Western Europe Market Value Share and BPS Analysis by Country, 2025 and 2035
  • Figure 43: Western Europe Market Value Share and BPS Analysis by Type , 2025 and 2035
  • Figure 44: Western Europe Market Y-o-Y Growth Comparison by Type , 2025-2035
  • Figure 45: Western Europe Market Attractiveness Analysis by Type
  • Figure 46: Western Europe Market Value Share and BPS Analysis by Capacity, 2025 and 2035
  • Figure 47: Western Europe Market Y-o-Y Growth Comparison by Capacity, 2025-2035
  • Figure 48: Western Europe Market Attractiveness Analysis by Capacity
  • Figure 49: Western Europe Market Value Share and BPS Analysis by End Use, 2025 and 2035
  • Figure 50: Western Europe Market Y-o-Y Growth Comparison by End Use, 2025-2035
  • Figure 51: Western Europe Market Attractiveness Analysis by End Use
  • Figure 52: Eastern Europe Market Value Share and BPS Analysis by Country, 2025 and 2035
  • Figure 53: Eastern Europe Market Value Share and BPS Analysis by Type , 2025 and 2035
  • Figure 54: Eastern Europe Market Y-o-Y Growth Comparison by Type , 2025-2035
  • Figure 55: Eastern Europe Market Attractiveness Analysis by Type
  • Figure 56: Eastern Europe Market Value Share and BPS Analysis by Capacity, 2025 and 2035
  • Figure 57: Eastern Europe Market Y-o-Y Growth Comparison by Capacity, 2025-2035
  • Figure 58: Eastern Europe Market Attractiveness Analysis by Capacity
  • Figure 59: Eastern Europe Market Value Share and BPS Analysis by End Use, 2025 and 2035
  • Figure 60: Eastern Europe Market Y-o-Y Growth Comparison by End Use, 2025-2035
  • Figure 61: Eastern Europe Market Attractiveness Analysis by End Use
  • Figure 62: East Asia Market Value Share and BPS Analysis by Country, 2025 and 2035
  • Figure 63: East Asia Market Value Share and BPS Analysis by Type , 2025 and 2035
  • Figure 64: East Asia Market Y-o-Y Growth Comparison by Type , 2025-2035
  • Figure 65: East Asia Market Attractiveness Analysis by Type
  • Figure 66: East Asia Market Value Share and BPS Analysis by Capacity, 2025 and 2035
  • Figure 67: East Asia Market Y-o-Y Growth Comparison by Capacity, 2025-2035
  • Figure 68: East Asia Market Attractiveness Analysis by Capacity
  • Figure 69: East Asia Market Value Share and BPS Analysis by End Use, 2025 and 2035
  • Figure 70: East Asia Market Y-o-Y Growth Comparison by End Use, 2025-2035
  • Figure 71: East Asia Market Attractiveness Analysis by End Use
  • Figure 72: South Asia and Pacific Market Value Share and BPS Analysis by Country, 2025 and 2035
  • Figure 73: South Asia and Pacific Market Value Share and BPS Analysis by Type , 2025 and 2035
  • Figure 74: South Asia and Pacific Market Y-o-Y Growth Comparison by Type , 2025-2035
  • Figure 75: South Asia and Pacific Market Attractiveness Analysis by Type
  • Figure 76: South Asia and Pacific Market Value Share and BPS Analysis by Capacity, 2025 and 2035
  • Figure 77: South Asia and Pacific Market Y-o-Y Growth Comparison by Capacity, 2025-2035
  • Figure 78: South Asia and Pacific Market Attractiveness Analysis by Capacity
  • Figure 79: South Asia and Pacific Market Value Share and BPS Analysis by End Use, 2025 and 2035
  • Figure 80: South Asia and Pacific Market Y-o-Y Growth Comparison by End Use, 2025-2035
  • Figure 81: South Asia and Pacific Market Attractiveness Analysis by End Use
  • Figure 82: Middle East & Africa Market Value Share and BPS Analysis by Country, 2025 and 2035
  • Figure 83: Middle East & Africa Market Value Share and BPS Analysis by Type , 2025 and 2035
  • Figure 84: Middle East & Africa Market Y-o-Y Growth Comparison by Type , 2025-2035
  • Figure 85: Middle East & Africa Market Attractiveness Analysis by Type
  • Figure 86: Middle East & Africa Market Value Share and BPS Analysis by Capacity, 2025 and 2035
  • Figure 87: Middle East & Africa Market Y-o-Y Growth Comparison by Capacity, 2025-2035
  • Figure 88: Middle East & Africa Market Attractiveness Analysis by Capacity
  • Figure 89: Middle East & Africa Market Value Share and BPS Analysis by End Use, 2025 and 2035
  • Figure 90: Middle East & Africa Market Y-o-Y Growth Comparison by End Use, 2025-2035
  • Figure 91: Middle East & Africa Market Attractiveness Analysis by End Use
  • Figure 92: Global Market - Tier Structure Analysis
  • Figure 93: Global Market - Company Share Analysis

Frequently Asked Questions

How big is the u-tube viscometer market in 2025?

The global u-tube viscometer market is estimated to be valued at USD 2.9 billion in 2025.

What will be the size of u-tube viscometer market in 2035?

The market size for the u-tube viscometer market is projected to reach USD 4.5 billion by 2035.

How much will be the u-tube viscometer market growth between 2025 and 2035?

The u-tube viscometer market is expected to grow at a 4.6% CAGR between 2025 and 2035.

What are the key product types in the u-tube viscometer market?

The key product types in u-tube viscometer market are u-tube viscometers for laboratories and industrial u-tube viscometers.

Which capacity segment to contribute significant share in the u-tube viscometer market in 2025?

In terms of capacity, u-tube viscometers up-to 120 mm/sec2 segment to command 40.0% share in the u-tube viscometer market in 2025.

Explore Similar Insights

Future Market Insights

U-Tube Viscometer Market

Chat With MaRIA

Chat With

MaRIA

Hi There, I am MaRIA, Your Market Research Intelligence Assistant. How may I help you?