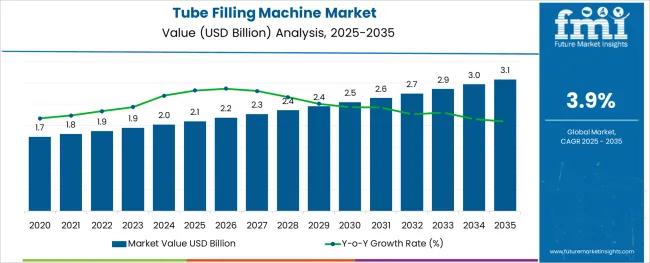
According to Future Market Insights research, during the projected period, the Tube Filling Machine Market was valued at around USD 1.8 Billion in 2021, registering a Y-o-Y growth of 2.6%. Tube Filling Machine Market sales are projected to increase at a CAGR of 3.9% and top a valuation of USD 2.7 Billion by 2032.
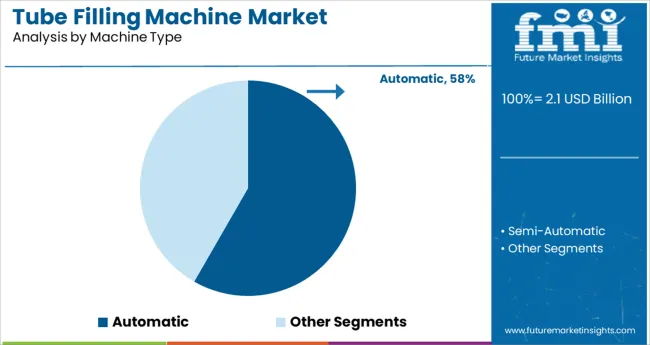
Based on the machine type, the automatic tube-filling machine segment is projected to remain the leading segment due to the high adoption of the latest technology and automation by the end-use industries. The target segment is estimated to create an incremental opportunity of USD 552.6 Million from 2022 to 2032.
Attribute | Details |
---|---|
Market Size 2022E | USD 1.8 Billion |
Market Size 2032F | USD 2.7 Billion |
Value CAGR (2022 to 2032) | 3.9% |
Collective Value Share: Top 5 Companies (2022E) | 35-40% |
The global tube-filling machine market accounts for around 3% of the global packaging machinery market valued at USD 58 Billion in 2021. During the forecast study, tube filling machine market revenues will increase and will create an incremental opportunity of USD 890.7 Million from 2022 to 2032.
The reason behind the same is the expanding pharmaceutical sector which is driving demand for tube-filling machines. Further, in 2021, the tube filling machine grew by 2.6% Y-o-Y, bucking initial incredulity about how the market would perform during a global pandemic.
The tube-filling machine market around the world had been growing for a few years and was predicted to increase at a CAGR of 2.6% over the historic period of 2015 to 2021. The tube-filling machine market will reach around USD 1.8 Billion by the end of 2021.
Thus, the market for tube-filling machines has been expanding at a remarkable rate over the last few years.
The speedy-growing manufacturing of chemicals, pharmaceuticals, cosmetics, personal care, and care items is driving the tube-filling machine market. The growth of the automotive industry has impacted the rising need for chemicals such as adhesives, glues, and other materials, which has given a boost to tube-filling machines.
The need for tube filling for medical products such as gels and ointments has increased tube-filling machine sales. There has also been a rise in consumer demand for cosmetic and personal care products such as lotions, tube creams, and other various products that are driving the market for tube-filling machines.
Considering all the above-mentioned factors, the tube-filling machine market is expected to increase at a CAGR of 3.9% over the next decade.
Thus, the overpriced cost of tube-filling machines and the difficulty of the operation are the main elements that are projected to hinder the use of tube-filling machines and hence observe a downfall in the market growth during the forecast period.
The tube filling machine has the benefit of reducing the cost of production and labor work as well. The tube-filling machines are very easy to use without any complex mechanics. These machines are very accurate in packaging without consuming more time.
These factors are increasing sales of tube-filling machines among manufacturers, giving rise to the tube-filling machine market. It also offers flexible options in the packaging of products in the tubes, boosting productivity and stability. Cutting on wastage of products with the precaution of better working conditions charges the market demand moderately during the forecast period.
An increase in the usage of fully automatic tube-filling machines is expected to witness growth in the tube-filling machine market across the world during the anticipated forecast period. An increase in technological innovations and advancements is expected to create new opportunities which will enhance the growth of the market during the forecast period.
Industry manufacturers are choosing innovative ideas and techniques to offer products according to the consumer’s preferences. Various packaging companies are changing their product portfolios by recreating the packaging formats to satisfy the customer base.
Modern lifestyle is playing a major role in the packaging industry in order to set a specific standard. Various manufacturers are following government rules and evolving standard machinery in the packaging units as they offer a low price to the end users and have safety standards set.
This is expected to observe an increase and thus become a major driver for this market. Considering the remarkable rise due to the demanding factors the tube-filling machine market is expected to increase at a CAGR of 3.9% over the next decade.
Setting up the machines in the packaging segment needs high capital investment because of the high cost of the machinery. Many packaging industries are evolving into modular and new designs, which offer various features, which in turn restrain the market's growth.
Thus, when tubes are filled with high density, the inner part of the machine leads to damage due to the convection heat. This could hinder the growth of the tube-filling machine market during the forecast period.
Also, due to the COVID-19 pandemic, many packaging industries are still facing issues with maintaining these machines. Thus, it could hamper the tube-filling machine market’s growth.
New products that have polished skills have been launched by top market players. They have taken the needed steps to polish the accuracy of the machine and its overall functionality as well. Filsilpek has inaugurated the automatic tube filling machine in a stainless steel version with a speed of around 60 pm.
This has changed the market to a great extent. Merger, collaboration, or acquisition is the corporate strategy that deals with buying or selling to achieve fast growth. These strategies are used to transform the business plan of the company into a list of target audiences.
For example, an American chemical company named DuPont resulted from the merger between Dow Chemical and DuPont. The headquarters of DuPont is in Wilmington, Delaware, and it is the biggest chemical project in the world where tube-filling machines are mostly used.
Automatic machines increase satisfaction through higher levels of safety, productivity, and functionality. It offers easy packaging changes while using the machine due to its increased flexibility.
Robotics is becoming the primary automated variant for packaging for pick-and-place applications. According to the International Federation of Robotics (IFR) in 2019, the usage of robotics in the packaging industry showed a 15% annual growth. Thus, the emergence of robotics in tube-filling machines is a prominent trend.
In 2017, the market for automatic plastic tube-filling machines was dominated by North America. Increased Research and Development activity, technical breakthroughs, and high healthcare costs in the area are some of the factors that contribute to the increase.
Over the course of the projected period, it is also anticipated that the existence of significant players will fuel regional demand for ATFM. The tube-filling machine market is anticipated to develop steadily in North America, Europe, and Latin America, while the Middle East and Africa are anticipated to rise modestly.
Due to the presence of significant market players like Eiconox SPCA Inc., Filling Machine Company, Honeywell International Inc., KHS GmbH & Co., Switzerland, NCR Corporation, and Schott Group Ltd., North America held a sizeable share of more than 30.0% of the global market.
In terms of generating demand, the North America area dominates the market for fully automatic tube-filling machines worldwide. Through the projection period, the North American region is anticipated to experience considerable growth at a CAGR of 5%.
Asia Pacific has tremendous growth in tube filling machines as a result of increased development in the businesses that support that growth.
The rise in demand for medicines and other pharmaceutical goods, rising consumer disposable income, and technical improvements are all responsible for the region's expansion.
Additionally, the market expansion in this region is being fuelled using fully automatic tube-filling machines in industrialized nations like the United States and Canada.
The booming economy, expanding population, and rising pharmaceutical and food and beverage industry demand are all contributing factors to the region's growth. Additionally, the market expansion is being fuelled by the rising investments made by major companies in this region.
Owing to the improved healthcare infrastructure in developing nations like China and India and increased disposable income, Asia Pacific is expected to have profitable growth during the projection period.
Due to the increased development in the industries that support the growth of the tube-filling machines market, Asia Pacific has seen significant expansion in the market for tube-filling machines.
Market growth for fully automatic tube-filling machines is anticipated to be quite rapid in the Asia Pacific region. With a 40% market share in 2021, the Asia Pacific region controlled the industry.
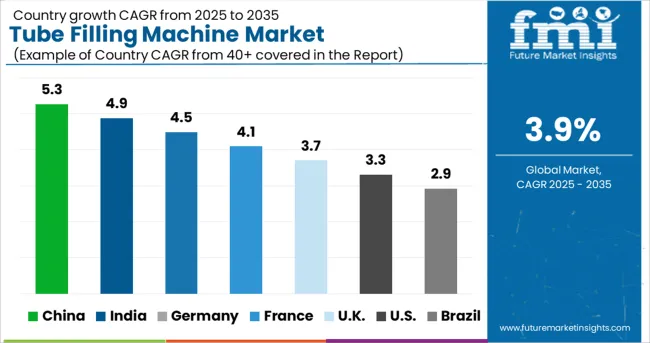
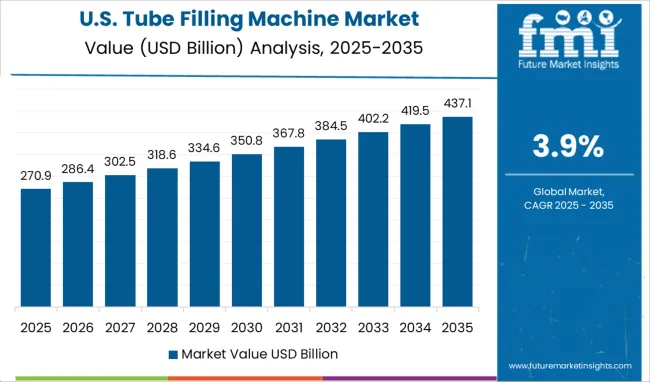
The USA clenches the leading market share in the tube-filling machine market across the globe. By the end of 2032, the market is estimated to rise at a CAGR of 2.4% of the North American tube-filling machine market.
The tube-filling machine market in the USA is expected to grow at a rate of 1.5x in the forecasted period.
With the evolving lifestyle of consumers in the USA, people are more focused on health, which gives rise to the pharmaceutical segment indirectly through products like creams and gels, which are usually packed in tubes. Thus, the rise in tube filling machines is increasing the huge demand.
In Germany, the market is expected to expand at a market value of USD 141.2 Million by 2032, with growing exports from the pharmaceutical segment.
According to the World Economic Forum, Germany has strong manufacturing capabilities, technological advancements, and assistance to supply products to other countries such as Argentina, etc.
This increasing export of the product range will lead to a rise in demand for tube-filling machines in the country to meet the market demand.
Developing countries like China and India have the highest population growth rates with a rising working population. This affects the direct consumption of the rate of packaged food items, etc.
According to the United Nations Population Funds (UNFPA), Asia-Pacific constitutes 60% of the total world’s population. Thus, the continuous demand for packaged products is expected to showcase steady growth across the region, which indirectly gives a boost to the tube-filling packaging machine market.
Over the forecast period, the market for fully automatic packaging tube-filling machines is expected to grow remarkably. Automatic machines have the highest market share, accounting for around 75% of the total market.
The fully automated tube-filling machine is good for packaging lines that produce air-sensitive items. They are capable of performing all operations without the need for manual help.
Regulatory standards note that an automatic tube filling machine is noted for providing a high level of accuracy and hygiene. Improved production output, less wastage, and consistent product quality are all benefits of the automated process.
The automatic tube filling machine is the most precise and advanced machine available and is utilized in a variety of end uses. During the forecast period, the automatic machine segment for the tube-filling machine market is expected to grow at a CAGR of 3.5%.
The pharmaceutical sector under the end-use industry would have the biggest market share, accounting for 43% of the total sales. Tube-filling machines are majorly used in the pharmaceutical segment for the packaging of products such as creams, ointments, syrups, etc.
The FMI analysis projects that during the forecast period, the pharmaceutical end-use segment for tube filling machines market is expected to grow and reach around USD 1.0 Billion by the end of the forecast period.
The tube-filling machine market is expected to remain attractive during the assessment period. Consumer inclination towards hassle-free, ready-to-eat food packages, etc. and aseptic packaging is creating exponential demand across various regions. However, due to strict regulations for start-ups in South Asia, it will steadily benefit to establish a business.
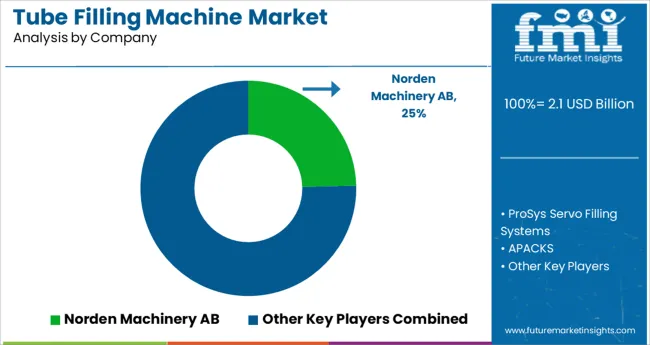
The tube-filling machine market is differentiated due to the presence of many market players around the world. Some of the major players are Norden Machinery AB, Bischoff & Munneke GmbH, IWK UK, Advanced Dynamics Ltd., Gustav Obermeyer GmbH & Co. KG, and others.
The market players are expected to take the opportunity posed by the growth of several end-user verticals and use it to expand their market presence. Some of the recent developments in the market are as follows:
The report analysis comprehensive data trends, growth, and opportunities that can change the market dynamics of the industry. Also, it helps in analyzing, segmenting, and defining the market based on various market segments which would help in giving a competitive edge in the market.
Attribute | Details |
---|---|
Growth Rate | CAGR of 3.9% from 2022 to 2032 |
Base Year for Estimation | 2021 |
Historical Data | 2015 to 2020 |
Forecast Period | 2022 to 2032 |
Quantitative Units | Revenue in USD Million, Volume in Units, and CAGR from 2022 to 2032 |
Report Coverage | Revenue Forecast, Volume Forecast, Company Ranking, Competitive Landscape, Growth Factors, Trends, and Pricing Analysis |
Segment Covered |
Machine Type, Capacity, End Use, Region |
Regions Covered | North America; Latin America; Europe; East Asia; South Asia; Oceania; Middle East and Africa |
Key Countries Profiled | United States of America, Canada, Brazil, Mexico, Germany, Italy, France, United Kingdom, Spain, Russia, China, Japan, India, GCC Countries, Australia |
Key Companies Profiled | Norden Machinery AB; Bischoff & Munneke GmbH; IWK UK; Advanced Dynamics Ltd; Gustav Obermeyer GmbH & Co. KG; APACKS; ProSys Servo Filling Systems; Pack Leader; Ruian Istar Machinery Co. Ltd; Aligned Machinery; Trustar Pharma & Packing Equipment Co. Ltd.; Winckler & Co. Ltd.; Blenzor (India); Multipack Machinery; The Whole Package, LLC |
Customization | Available Upon Request |
Table 01: Global Market Value (US$ Billion) Forecast by Region, 2015 to 2032
Table 02: Global Market Volume (Units) Forecast by Region, 2015 to 2032
Table 03: Global Market Value (US$ Billion) Forecast by Machine Type, 2015 to 2032
Table 04: Global Market Volume (Units) Forecast by Machine Type, 2015 to 2032
Table 05: Global Market Value (US$ Billion) Forecast by Capacity, 2015 to 2032
Table 06: Global Market Volume (Units) Forecast by Capacity, 2015 to 2032
Table 07: Global Market Value (US$ Billion) Forecast by End Use, 2015 to 2032
Table 08: Global Market Volume (Units) Forecast by End Use, 2015 to 2032
Table 09: North America Market Value (US$ Billion) Forecast by Country, 2015 to 2032
Table 10: North America Market Volume (Units) Forecast by Country, 2015 to 2032
Table 11: North America Market Value (US$ Billion) Forecast by Machine Type, 2015 to 2032
Table 12: North America Market Volume (Units) Forecast by Machine Type, 2015 to 2032
Table 13: North America Market Value (US$ Billion) Forecast by Capacity, 2015 to 2032
Table 14: North America Market Volume (Units) Forecast by Capacity, 2015 to 2032
Table 15: North America Market Value (US$ Billion) Forecast by End Use, 2015 to 2032
Table 16: North America Market Volume (Units) Forecast by End Use, 2015 to 2032
Table 17: Latin America Market Value (US$ Billion) Forecast by Country, 2015 to 2032
Table 18: Latin America Market Volume (Units) Forecast by Country, 2015 to 2032
Table 19: Latin America Market Value (US$ Billion) Forecast by Machine Type, 2015 to 2032
Table 20: Latin America Market Volume (Units) Forecast by Machine Type, 2015 to 2032
Table 21: Latin America Market Value (US$ Billion) Forecast by Capacity, 2015 to 2032
Table 22: Latin America Market Volume (Units) Forecast by Capacity, 2015 to 2032
Table 23: Latin America Market Value (US$ Billion) Forecast by End Use, 2015 to 2032
Table 24: Latin America Market Volume (Units) Forecast by End Use, 2015 to 2032
Table 25: Europe Market Value (US$ Billion) Forecast by Country, 2015 to 2032
Table 26: Europe Market Volume (Units) Forecast by Country, 2015 to 2032
Table 27: Europe Market Value (US$ Billion) Forecast by Machine Type, 2015 to 2032
Table 28: Europe Market Volume (Units) Forecast by Machine Type, 2015 to 2032
Table 29: Europe Market Value (US$ Billion) Forecast by Capacity, 2015 to 2032
Table 30: Europe Market Volume (Units) Forecast by Capacity, 2015 to 2032
Table 31: Europe Market Value (US$ Billion) Forecast by End Use, 2015 to 2032
Table 32: Europe Market Volume (Units) Forecast by End Use, 2015 to 2032
Table 33: East Asia Market Value (US$ Billion) Forecast by Country, 2015 to 2032
Table 34: East Asia Market Volume (Units) Forecast by Country, 2015 to 2032
Table 35: East Asia Market Value (US$ Billion) Forecast by Machine Type, 2015 to 2032
Table 36: East Asia Market Volume (Units) Forecast by Machine Type, 2015 to 2032
Table 37: East Asia Market Value (US$ Billion) Forecast by Capacity, 2015 to 2032
Table 38: East Asia Market Volume (Units) Forecast by Capacity, 2015 to 2032
Table 39: East Asia Market Value (US$ Billion) Forecast by End Use, 2015 to 2032
Table 40: East Asia Market Volume (Units) Forecast by End Use, 2015 to 2032
Table 41: South Asia Market Value (US$ Billion) Forecast by Country, 2015 to 2032
Table 42: South Asia Market Volume (Units) Forecast by Country, 2015 to 2032
Table 43: South Asia Market Value (US$ Billion) Forecast by Machine Type, 2015 to 2032
Table 44: South Asia Market Volume (Units) Forecast by Machine Type, 2015 to 2032
Table 45: South Asia Market Value (US$ Billion) Forecast by Capacity, 2015 to 2032
Table 46: South Asia Market Volume (Units) Forecast by Capacity, 2015 to 2032
Table 47: South Asia Market Value (US$ Billion) Forecast by End Use, 2015 to 2032
Table 48: South Asia Market Volume (Units) Forecast by End Use, 2015 to 2032
Table 49: Oceania Market Value (US$ Billion) Forecast by Country, 2015 to 2032
Table 50: Oceania Market Volume (Units) Forecast by Country, 2015 to 2032
Table 51: Oceania Market Value (US$ Billion) Forecast by Machine Type, 2015 to 2032
Table 52: Oceania Market Volume (Units) Forecast by Machine Type, 2015 to 2032
Table 53: Oceania Market Value (US$ Billion) Forecast by Capacity, 2015 to 2032
Table 54: Oceania Market Volume (Units) Forecast by Capacity, 2015 to 2032
Table 55: Oceania Market Value (US$ Billion) Forecast by End Use, 2015 to 2032
Table 56: Oceania Market Volume (Units) Forecast by End Use, 2015 to 2032
Table 57: Middle East and Africa Market Value (US$ Billion) Forecast by Country, 2015 to 2032
Table 58: Middle East and Africa Market Volume (Units) Forecast by Country, 2015 to 2032
Table 59: Middle East and Africa Market Value (US$ Billion) Forecast by Machine Type, 2015 to 2032
Table 60: Middle East and Africa Market Volume (Units) Forecast by Machine Type, 2015 to 2032
Table 61: Middle East and Africa Market Value (US$ Billion) Forecast by Capacity, 2015 to 2032
Table 62: Middle East and Africa Market Volume (Units) Forecast by Capacity, 2015 to 2032
Table 63: Middle East and Africa Market Value (US$ Billion) Forecast by End Use, 2015 to 2032
Table 64: Middle East and Africa Market Volume (Units) Forecast by End Use, 2015 to 2032
Table 65: United States of America Market Value (US$ Billion) Forecast by Machine Type, Capacity, and End Use (2022(E) & 2032(F))
Table 66: Canada Market Value (US$ Billion) Forecast by Machine Type, Capacity, and End Use (2022(E) & 2032(F))
Table 67: Brazil Market Value (US$ Billion) Forecast by Machine Type, Capacity, and End Use (2022(E) & 2032(F))
Table 68: Mexico Market Value (US$ Billion) Forecast by Machine Type, Capacity, and End Use (2022(E) & 2032(F))
Table 69: Germany Market Value (US$ Billion) Forecast by Machine Type, Capacity, and End Use (2022(E) & 2032(F))
Table 70: Italy Market Value (US$ Billion) Forecast by Machine Type, Capacity, and End Use (2022(E) & 2032(F))
Table 71: France Market Value (US$ Billion) Forecast by Machine Type, Capacity, and End Use (2022(E) & 2032(F))
Table 72: Spain Market Value (US$ Billion) Forecast by Machine Type, Capacity, and End Use (2022(E) & 2032(F))
Table 73: United Kingdom Market Value (US$ Billion) Forecast by Machine Type, Capacity, and End Use (2022(E) & 2032(F))
Table 74: Russia Market Value (US$ Billion) Forecast by Machine Type, Capacity, and End Use (2022(E) & 2032(F))
Table 75: China Market Value (US$ Billion) Forecast by Machine Type, Capacity, and End Use (2022(E) & 2032(F))
Table 76: Japan Market Value (US$ Billion) Forecast by Machine Type, Capacity, and End Use (2022(E) & 2032(F))
Table 77: India Market Value (US$ Billion) Forecast by Machine Type, Capacity, and End Use (2022(E) & 2032(F))
Table 78: GCC Countries Market Value (US$ Billion) Forecast by Machine Type, Capacity, and End Use (2022(E) & 2032(F))
Table 79: Australia Market Value (US$ Billion) Forecast by Machine Type, Capacity, and End Use (2022(E) & 2032(F))
Figure 01: Global Market Value (US$ Billion) by Machine Type, 2022 to 2032
Figure 02: Global Market Value (US$ Billion) by Capacity, 2022 to 2032
Figure 03: Global Market Value (US$ Billion) by End Use, 2022 to 2032
Figure 04: Global Market Value (US$ Billion) by Region, 2022 to 2032
Figure 05: Global Market Value (US$ Billion) Analysis by Region, 2015 to 2021
Figure 06: Global Market Volume (Units) Analysis by Region, 2015 to 2032
Figure 07: Global Market Value Share (%) and BPS Analysis by Region, 2022 to 2032
Figure 08: Global Market Y-o-Y Growth (%) Projections by Region, 2022 to 2032
Figure 09: Global Market Value (US$ Billion) Analysis by Machine Type, 2015 to 2021
Figure 10: Global Market Volume (Units) Analysis by Machine Type, 2015 to 2032
Figure 11: Global Market Value Share (%) and BPS Analysis by Machine Type, 2022 to 2032
Figure 12: Global Market Y-o-Y Growth (%) Projections by Machine Type, 2022 to 2032
Figure 13: Global Market Value (US$ Billion) Analysis by Capacity, 2015 to 2021
Figure 14: Global Market Volume (Units) Analysis by Capacity, 2015 to 2032
Figure 15: Global Market Value Share (%) and BPS Analysis by Capacity, 2022 to 2032
Figure 16: Global Market Y-o-Y Growth (%) Projections by Capacity, 2022 to 2032
Figure 17: Global Market Value (US$ Billion) Analysis by End Use, 2015 to 2021
Figure 18: Global Market Volume (Units) Analysis by End Use, 2015 to 2032
Figure 19: Global Market Value Share (%) and BPS Analysis by End Use, 2022 to 2032
Figure 20: Global Market Y-o-Y Growth (%) Projections by End Use, 2022 to 2032
Figure 21: Global Market Attractiveness by Machine Type, 2022 to 2032
Figure 22: Global Market Attractiveness by Capacity, 2022 to 2032
Figure 23: Global Market Attractiveness by Application, 2022 to 2032
Figure 24: Global Market Attractiveness by End Use, 2022 to 2032
Figure 25: Global Market Attractiveness by Region, 2022 to 2032
Figure 26: North America Market Value (US$ Billion) by Machine Type, 2022 to 2032
Figure 27: North America Market Value (US$ Billion) by Capacity, 2022 to 2032
Figure 28: North America Market Value (US$ Billion) by End Use, 2022 to 2032
Figure 29: North America Market Value (US$ Billion) by Country, 2022 to 2032
Figure 30: North America Market Value (US$ Billion) Analysis by Country, 2015 to 2021
Figure 31: North America Market Volume (Units) Analysis by Country, 2015 to 2032
Figure 32: North America Market Value Share (%) and BPS Analysis by Country, 2022 to 2032
Figure 33: North America Market Y-o-Y Growth (%) Projections by Country, 2022 to 2032
Figure 34: North America Market Value (US$ Billion) Analysis by Machine Type, 2015 to 2021
Figure 35: North America Market Volume (Units) Analysis by Machine Type, 2015 to 2032
Figure 36: North America Market Value Share (%) and BPS Analysis by Machine Type, 2022 to 2032
Figure 37: North America Market Y-o-Y Growth (%) Projections by Machine Type, 2022 to 2032
Figure 38: North America Market Value (US$ Billion) Analysis by Capacity, 2015 to 2021
Figure 39: North America Market Volume (Units) Analysis by Capacity, 2015 to 2032
Figure 40: North America Market Value Share (%) and BPS Analysis by Capacity, 2022 to 2032
Figure 41: North America Market Y-o-Y Growth (%) Projections by Capacity, 2022 to 2032
Figure 42: North America Market Value (US$ Billion) Analysis by End Use, 2015 to 2021
Figure 43: North America Market Volume (Units) Analysis by End Use, 2015 to 2032
Figure 44: North America Market Value Share (%) and BPS Analysis by End Use, 2022 to 2032
Figure 45: North America Market Y-o-Y Growth (%) Projections by End Use, 2022 to 2032
Figure 46: North America Market Attractiveness by Machine Type, 2022 to 2032
Figure 47: North America Market Attractiveness by Capacity, 2022 to 2032
Figure 48: North America Market Attractiveness by End Use, 2022 to 2032
Figure 49: North America Market Attractiveness by Country, 2022 to 2032
Figure 50: Latin America Market Value (US$ Billion) by Machine Type, 2022 to 2032
Figure 51: Latin America Market Value (US$ Billion) by Capacity, 2022 to 2032
Figure 52: Latin America Market Value (US$ Billion) by End Use, 2022 to 2032
Figure 53: Latin America Market Value (US$ Billion) by Country, 2022 to 2032
Figure 54: Latin America Market Value (US$ Billion) Analysis by Country, 2015 to 2021
Figure 55: Latin America Market Volume (Units) Analysis by Country, 2015 to 2032
Figure 56: Latin America Market Value Share (%) and BPS Analysis by Country, 2022 to 2032
Figure 57: Latin America Market Y-o-Y Growth (%) Projections by Country, 2022 to 2032
Figure 58: Latin America Market Value (US$ Billion) Analysis by Machine Type, 2015 to 2021
Figure 59: Latin America Market Volume (Units) Analysis by Machine Type, 2015 to 2032
Figure 60: Latin America Market Value Share (%) and BPS Analysis by Machine Type, 2022 to 2032
Figure 61: Latin America Market Y-o-Y Growth (%) Projections by Machine Type, 2022 to 2032
Figure 62: Latin America Market Value (US$ Billion) Analysis by Capacity, 2015 to 2021
Figure 63: Latin America Market Volume (Units) Analysis by Capacity, 2015 to 2032
Figure 64: Latin America Market Value Share (%) and BPS Analysis by Capacity, 2022 to 2032
Figure 65: Latin America Market Y-o-Y Growth (%) Projections by Capacity, 2022 to 2032
Figure 66: Latin America Market Value (US$ Billion) Analysis by End Use, 2015 to 2021
Figure 67: Latin America Market Volume (Units) Analysis by End Use, 2015 to 2032
Figure 68: Latin America Market Value Share (%) and BPS Analysis by End Use, 2022 to 2032
Figure 69: Latin America Market Y-o-Y Growth (%) Projections by End Use, 2022 to 2032
Figure 70: Latin America Market Attractiveness by Machine Type, 2022 to 2032
Figure 71: Latin America Market Attractiveness by Capacity, 2022 to 2032
Figure 72: Latin America Market Attractiveness by End Use, 2022 to 2032
Figure 73: Latin America Market Attractiveness by Country, 2022 to 2032
Figure 74: Europe Market Value (US$ Billion) by Machine Type, 2022 to 2032
Figure 75: Europe Market Value (US$ Billion) by Capacity, 2022 to 2032
Figure 76: Europe Market Value (US$ Billion) by End Use, 2022 to 2032
Figure 77: Europe Market Value (US$ Billion) by Country, 2022 to 2032
Figure 78: Europe Market Value (US$ Billion) Analysis by Country, 2015 to 2021
Figure 79: Europe Market Volume (Units) Analysis by Country, 2015 to 2032
Figure 80: Europe Market Value Share (%) and BPS Analysis by Country, 2022 to 2032
Figure 81: Europe Market Y-o-Y Growth (%) Projections by Country, 2022 to 2032
Figure 82: Europe Market Value (US$ Billion) Analysis by Machine Type, 2015 to 2021
Figure 83: Europe Market Volume (Units) Analysis by Machine Type, 2015 to 2032
Figure 84: Europe Market Value Share (%) and BPS Analysis by Machine Type, 2022 to 2032
Figure 85: Europe Market Y-o-Y Growth (%) Projections by Machine Type, 2022 to 2032
Figure 86: Europe Market Value (US$ Billion) Analysis by Capacity, 2015 to 2021
Figure 87: Europe Market Volume (Units) Analysis by Capacity, 2015 to 2032
Figure 88: Europe Market Value Share (%) and BPS Analysis by Capacity, 2022 to 2032
Figure 89: Europe Market Y-o-Y Growth (%) Projections by Capacity, 2022 to 2032
Figure 90: Europe Market Value (US$ Billion) Analysis by End Use, 2015 to 2021
Figure 91: Europe Market Volume (Units) Analysis by End Use, 2015 to 2032
Figure 92: Europe Market Value Share (%) and BPS Analysis by End Use, 2022 to 2032
Figure 93: Europe Market Y-o-Y Growth (%) Projections by End Use, 2022 to 2032
Figure 94: Europe Market Attractiveness by Machine Type, 2022 to 2032
Figure 95: Europe Market Attractiveness by Capacity, 2022 to 2032
Figure 96: Europe Market Attractiveness by End Use, 2022 to 2032
Figure 97: Europe Market Attractiveness by Country, 2022 to 2032
Figure 98: East Asia Market Value (US$ Billion) by Machine Type, 2022 to 2032
Figure 99: East Asia Market Value (US$ Billion) by Capacity, 2022 to 2032
Figure 100: East Asia Market Value (US$ Billion) by End Use, 2022 to 2032
Figure 101: East Asia Market Value (US$ Billion) by Country, 2022 to 2032
Figure 102: East Asia Market Value (US$ Billion) Analysis by Country, 2015 to 2021
Figure 103: East Asia Market Volume (Units) Analysis by Country, 2015 to 2032
Figure 104: East Asia Market Value Share (%) and BPS Analysis by Country, 2022 to 2032
Figure 105: East Asia Market Y-o-Y Growth (%) Projections by Country, 2022 to 2032
Figure 106: East Asia Market Value (US$ Billion) Analysis by Machine Type, 2015 to 2021
Figure 107: East Asia Market Volume (Units) Analysis by Machine Type, 2015 to 2032
Figure 108: East Asia Market Value Share (%) and BPS Analysis by Machine Type, 2022 to 2032
Figure 109: East Asia Market Y-o-Y Growth (%) Projections by Machine Type, 2022 to 2032
Figure 110: East Asia Market Value (US$ Billion) Analysis by Capacity, 2015 to 2021
Figure 111: East Asia Market Volume (Units) Analysis by Capacity, 2015 to 2032
Figure 112: East Asia Market Value Share (%) and BPS Analysis by Capacity, 2022 to 2032
Figure 113: East Asia Market Y-o-Y Growth (%) Projections by Capacity, 2022 to 2032
Figure 114: East Asia Market Value (US$ Billion) Analysis by End Use, 2015 to 2021
Figure 115: East Asia Market Volume (Units) Analysis by End Use, 2015 to 2032
Figure 116: East Asia Market Value Share (%) and BPS Analysis by End Use, 2022 to 2032
Figure 117: East Asia Market Y-o-Y Growth (%) Projections by End Use, 2022 to 2032
Figure 118: East Asia Market Attractiveness by Machine Type, 2022 to 2032
Figure 119: East Asia Market Attractiveness by Capacity, 2022 to 2032
Figure 120: East Asia Market Attractiveness by End Use, 2022 to 2032
Figure 121: East Asia Market Attractiveness by Country, 2022 to 2032
Figure 122: South Asia Market Value (US$ Billion) by Machine Type, 2022 to 2032
Figure 123: South Asia Market Value (US$ Billion) by Capacity, 2022 to 2032
Figure 124: South Asia Market Value (US$ Billion) by End Use, 2022 to 2032
Figure 125: South Asia Market Value (US$ Billion) by Country, 2022 to 2032
Figure 126: South Asia Market Value (US$ Billion) Analysis by Country, 2015 to 2021
Figure 127: South Asia Market Volume (Units) Analysis by Country, 2015 to 2032
Figure 128: South Asia Market Value Share (%) and BPS Analysis by Country, 2022 to 2032
Figure 129: South Asia Market Y-o-Y Growth (%) Projections by Country, 2022 to 2032
Figure 130: South Asia Market Value (US$ Billion) Analysis by Machine Type, 2015 to 2021
Figure 131: South Asia Market Volume (Units) Analysis by Machine Type, 2015 to 2032
Figure 132: South Asia Market Value Share (%) and BPS Analysis by Machine Type, 2022 to 2032
Figure 133: South Asia Market Y-o-Y Growth (%) Projections by Machine Type, 2022 to 2032
Figure 134: South Asia Market Value (US$ Billion) Analysis by Capacity, 2015 to 2021
Figure 135: South Asia Market Volume (Units) Analysis by Capacity, 2015 to 2032
Figure 136: South Asia Market Value Share (%) and BPS Analysis by Capacity, 2022 to 2032
Figure 137: South Asia Market Y-o-Y Growth (%) Projections by Capacity, 2022 to 2032
Figure 138: South Asia Market Value (US$ Billion) Analysis by End Use, 2015 to 2021
Figure 139: South Asia Market Volume (Units) Analysis by End Use, 2015 to 2032
Figure 140: South Asia Market Value Share (%) and BPS Analysis by End Use, 2022 to 2032
Figure 141: South Asia Market Y-o-Y Growth (%) Projections by End Use, 2022 to 2032
Figure 142: South Asia Market Attractiveness by Machine Type, 2022 to 2032
Figure 143: South Asia Market Attractiveness by Capacity, 2022 to 2032
Figure 144: South Asia Market Attractiveness by End Use, 2022 to 2032
Figure 145: South Asia Market Attractiveness by Country, 2022 to 2032
Figure 146: Oceania Market Value (US$ Billion) by Machine Type, 2022 to 2032
Figure 147: Oceania Market Value (US$ Billion) by Capacity, 2022 to 2032
Figure 148: Oceania Market Value (US$ Billion) by End Use, 2022 to 2032
Figure 149: Oceania Market Value (US$ Billion) by Country, 2022 to 2032
Figure 150: Oceania Market Value (US$ Billion) Analysis by Country, 2015 to 2021
Figure 151: Oceania Market Volume (Units) Analysis by Country, 2015 to 2032
Figure 152: Oceania Market Value Share (%) and BPS Analysis by Country, 2022 to 2032
Figure 153: Oceania Market Y-o-Y Growth (%) Projections by Country, 2022 to 2032
Figure 154: Oceania Market Value (US$ Billion) Analysis by Machine Type, 2015 to 2021
Figure 155: Oceania Market Volume (Units) Analysis by Machine Type, 2015 to 2032
Figure 156: Oceania Market Value Share (%) and BPS Analysis by Machine Type, 2022 to 2032
Figure 157: Oceania Market Y-o-Y Growth (%) Projections by Machine Type, 2022 to 2032
Figure 158: Oceania Market Value (US$ Billion) Analysis by Capacity, 2015 to 2021
Figure 159: Oceania Market Volume (Units) Analysis by Capacity, 2015 to 2032
Figure 160: Oceania Market Value Share (%) and BPS Analysis by Capacity, 2022 to 2032
Figure 161: Oceania Market Y-o-Y Growth (%) Projections by Capacity, 2022 to 2032
Figure 162: Oceania Market Value (US$ Billion) Analysis by End Use, 2015 to 2021
Figure 163: Oceania Market Volume (Units) Analysis by End Use, 2015 to 2032
Figure 164: Oceania Market Value Share (%) and BPS Analysis by End Use, 2022 to 2032
Figure 165: Oceania Market Y-o-Y Growth (%) Projections by End Use, 2022 to 2032
Figure 166: Oceania Market Attractiveness by Machine Type, 2022 to 2032
Figure 167: Oceania Market Attractiveness by Capacity, 2022 to 2032
Figure 168: Oceania Market Attractiveness by End Use, 2022 to 2032
Figure 169 Oceania Market Attractiveness by Country, 2022 to 2032
Figure 170: Middle East and Africa Market Value (US$ Billion) by Machine Type, 2022 to 2032
Figure 171: Middle East and Africa Market Value (US$ Billion) by Capacity, 2022 to 2032
Figure 172: Middle East and Africa Market Value (US$ Billion) by End Use, 2022 to 2032
Figure 173: Middle East and Africa Market Value (US$ Billion) by Country, 2022 to 2032
Figure 174: Middle East and Africa Market Value (US$ Billion) Analysis by Country, 2015 to 2021
Figure 175: Middle East and Africa Market Volume (Units) Analysis by Country, 2015 to 2032
Figure 176: Middle East and Africa Market Value Share (%) and BPS Analysis by Country, 2022 to 2032
Figure 177: Middle East and Africa Market Y-o-Y Growth (%) Projections by Country, 2022 to 2032
Figure 178: Middle East and Africa Market Value (US$ Billion) Analysis by Machine Type, 2015 to 2021
Figure 179: Middle East and Africa Market Volume (Units) Analysis by Machine Type, 2015 to 2032
Figure 180: Middle East and Africa Market Value Share (%) and BPS Analysis by Machine Type, 2022 to 2032
Figure 181: Middle East and Africa Market Y-o-Y Growth (%) Projections by Machine Type, 2022 to 2032
Figure 182: Middle East and Africa Market Value (US$ Billion) Analysis by Capacity, 2015 to 2021
Figure 183: Middle East and Africa Market Volume (Units) Analysis by Capacity, 2015 to 2032
Figure 184: Middle East and Africa Market Value Share (%) and BPS Analysis by Capacity, 2022 to 2032
Figure 185: Middle East and Africa Market Y-o-Y Growth (%) Projections by Capacity, 2022 to 2032
Figure 186: Middle East and Africa Market Value (US$ Billion) Analysis by End Use, 2015 to 2021
Figure 187: Middle East and Africa Market Volume (Units) Analysis by End Use, 2015 to 2032
Figure 188: Middle East and Africa Market Value Share (%) and BPS Analysis by End Use, 2022 to 2032
Figure 189: Middle East and Africa Market Y-o-Y Growth (%) Projections by End Use, 2022 to 2032
Figure 190: Middle East and Africa Market Attractiveness by Machine Type, 2022 to 2032
Figure 191: Middle East and Africa Market Attractiveness by Capacity, 2022 to 2032
Figure 192: Middle East and Africa Market Attractiveness by End Use, 2022 to 2032
Figure 193 Middle East and Africa Market Attractiveness by Country, 2022 to 2032
The global tube-filling machine market was valued at USD 1.8 Billion in 2021.
The global tube filling machine market is projected to expand at a CAGR of 3.9% during the forecast period.
The global tube-filling machine market is anticipated to reach USD 2.6 Billion by the end of the next ten years.
The global tube-filling machine market is estimated to create a growth opportunity of USD 836.5 Million during 2022 to 2032.
The adoption of rigid packaging solution by the end use industries pushes the demand for tube filling machine.
The major players in the tube-filling machine market are Norden Machinery AB, ProSys Servo Filling Systems, Bischoff & Munneke GmbH, and IWK UK.
According to FMI analysis, the Indian tube filling machine market is projected to expand at a CAGR of 5.0% during the forecast period.
Explore Similar Insights
Thank you!
You will receive an email from our Business Development Manager. Please be sure to check your SPAM/JUNK folder too.