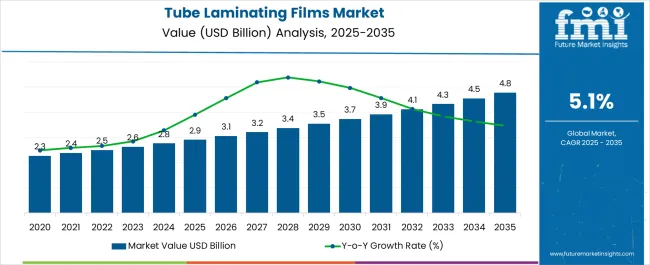
The Tube Laminating Films Market is projected to rise to USD 2.63 billion in 2023. The tube laminating films is estimated to reach USD 4.32 billion with a CAGR of 5.1% by 2033.
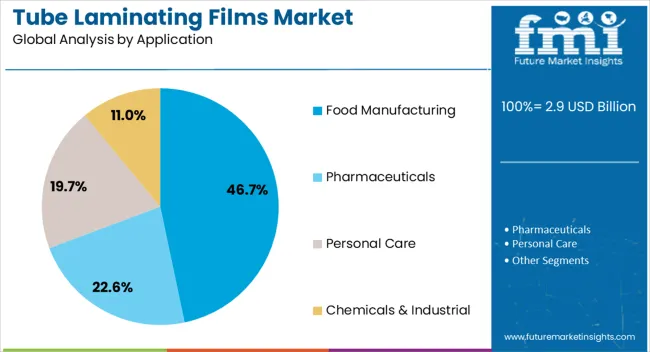
The demand for tube laminating films is likely to rise as it is used for packaging food, pharmaceuticals, personal care, and industrial applications. The adoption of tube laminating films is a cost-effective packaging solution and extends the shelf life of the product.
It maintains the form and shape of the product with its multiple layers of foil are likely to increase the tube laminating films market share.
Report Attribute | Details |
---|---|
Tube Laminating Films Market Value (2023) | USD 2.63 billion |
Tube Laminating Films Market Anticipated Forecast Value (2033) | USD 4.32 billion |
Tube Laminating Films Market Projected Growth Rate (2023 to 2033) | 5.1% |
Tube laminating films market outlook states that during the packaging process, the flexible and soft exteriors provide excellent sealable features, which are likely to raise the demand for tube laminating films by end-users.
The tube laminating films provide safe sealing performance and enable quality printing which is anticipated to rise the tube laminating films market growth.
The tube laminating films are primarily used in the production of tubes for cosmetics, toothpaste, and other foodstuffs, etc. Huge production in these industries is likely to increase the tube laminating films market growth during the forecast period.
The adoption of tube laminating films is rising due to their chemical resistance packaging of the product as well as providing maximum product safety.
Expanding tube laminating films market size is attributed to its much more affordable price & transparency as compared to other alternatives, including UV coating. The tube laminating films are cost-effective, which is anticipated to increase the sales of tube laminating films during the forecast period.
Drivers:
The growing usage of flexible packaging in pharmaceutical, personal care as well as food products is expected to boost the tube laminating films market share. Nowadays, manufacturers are seeking lightweight packaging products to lower the additional cost incurred in transportation, which raises the sales of tube laminating.
Further, innovations & flexible packaging in the industry require lesser energy and allow higher performance which is anticipated to increase the tube laminating films market opportunities.
The surge in FDI in the manufacturing sector coupled with government initiatives is projected to result in an upward trend for tube laminating films.
Also, the smart city project in India is expected to boost the overall manufacturing and retail market. This is likely to increase the adoption of tube laminating films during the forecast period.
Cosmetics and healthcare are anticipated to be the fastest-growing end-use sectors which are raising the demand for tube laminating films across the globe. The usage of flexible packaging in the food and beverage industry is expected to boost the tube laminating films market size over the forecast period.
The following factors may restrain the tube laminating films market growth in the forecast period are:
In terms of geography, the global tube laminating films market is divided into North America, Europe, Asia-Pacific, Latin America, the Middle East, and Africa. Europe is projected to witness impressive growth in the tube laminating films market acquiring 27% of the share over the forecast period.
The demand for packaged food products and personal care is rising in the region which is likely to increase the tube laminating films market size.
North America is likely to hold second place in the tube laminating films market by acquiring 22% of the share all around the regions during the forecast period.
Further, significant investments in new manufacturing facilities in the region are likely to post perpetual demand for tube laminating films. Growth in the Pharmaceutical industry is another reason for to rise in the tube laminating films market growth in recent years.
The tube laminating films start-up market is creating and developing new ideas and methods to carry out a unique product to be launched in the market. Start-up companies are using minimum materials to make advanced standard and long-lasting products with high techniques.
One of the start-up companies named 3D Neopac has upgraded the tube with eco-design and PCR quality. Recently, the company also came up with a Spring tube kraft to stop plastic usage. Hence, the start-up is innovating various eco-friendly, budget-friendly, and less-material-used products to carry out in the marketplaces in the coming years.
The tube laminating market is fragmented by manufacturers, key players, and government regulations. The prominent end-use industry is going through the research and analysis of the newly launched products with the consumer's demand.
These industries are using several advanced technologies to come up with innovative product which is sufficient for consumers. Therefore, they are using several marketing tactics such as partnerships, acquisitions, mergers, product launches, and many more.
Recent Developments in the Tube Laminating Films Market are:
Producing newly innovative & highly sophisticated tube laminating films with saving material and providing a standard of materials is a path of development in the market.
Developments of Tube Laminating Films in the Cosmetic & Oral Hygiene Industry:
Report Attribute | Details |
---|---|
Growth Rate | CAGR of 5.1% from 2022 to 2032 |
Base Year for Estimation | 2022 |
Historical Data | 2017 to 2022 |
Forecast Period | 2023 to 2033 |
Quantitative Units | Revenue in USD Million and CAGR from 2022 to 2032 |
Report Coverage | Revenue Forecast, Volume Forecast, Company Ranking, Competitive Landscape, Growth Factors, Trends, and Pricing Analysis |
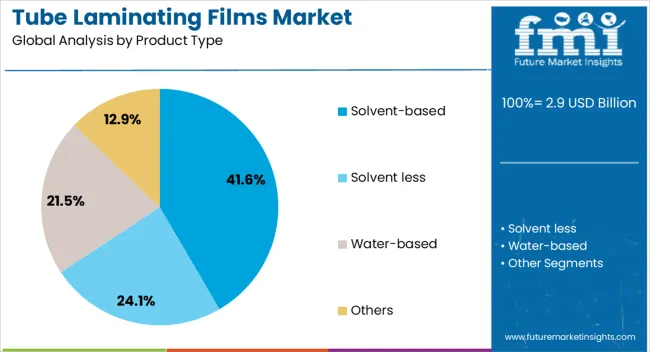
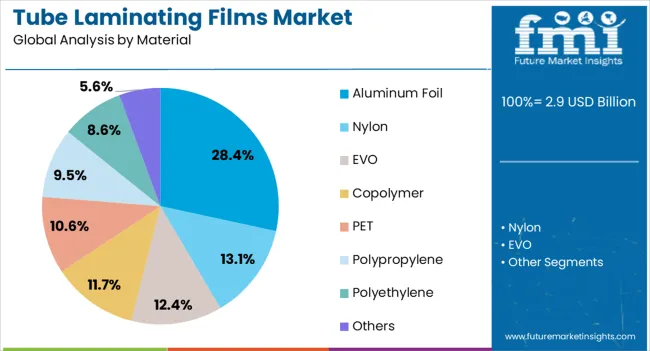
Segments Covered | By Product Type, By Material, By Application, By Region |
Regions Covered | North America; Latin America; Europe; Asia-Pacific; Middle East and Africa |
Key Countries Profiled | United States of America, Canada, Brazil, Argentina, Germany, United Kingdom, France, Spain, Italy, Nordics, BENELUX, Australia & New Zealand, China, India, ASIAN, GCC Countries, South Africa |
Key Companies Profiled | Mondi Group; ESSEL PROPACK LIMITED; Cosmo Films Ltd.; Drytac Corporation |
Customization | Available Upon Request |
Table 1: Global Market Value (US$ Million) Forecast by Region, 2018 to 2033
Table 2: Global Market Volume (Tons) Forecast by Region, 2018 to 2033
Table 3: Global Market Value (US$ Million) Forecast by Product Type, 2018 to 2033
Table 4: Global Market Volume (Tons) Forecast by Product Type, 2018 to 2033
Table 5: Global Market Value (US$ Million) Forecast by Material, 2018 to 2033
Table 6: Global Market Volume (Tons) Forecast by Material, 2018 to 2033
Table 7: Global Market Value (US$ Million) Forecast by Application, 2018 to 2033
Table 8: Global Market Volume (Tons) Forecast by Application, 2018 to 2033
Table 9: North America Market Value (US$ Million) Forecast by Country, 2018 to 2033
Table 10: North America Market Volume (Tons) Forecast by Country, 2018 to 2033
Table 11: North America Market Value (US$ Million) Forecast by Product Type, 2018 to 2033
Table 12: North America Market Volume (Tons) Forecast by Product Type, 2018 to 2033
Table 13: North America Market Value (US$ Million) Forecast by Material, 2018 to 2033
Table 14: North America Market Volume (Tons) Forecast by Material, 2018 to 2033
Table 15: North America Market Value (US$ Million) Forecast by Application, 2018 to 2033
Table 16: North America Market Volume (Tons) Forecast by Application, 2018 to 2033
Table 17: Latin America Market Value (US$ Million) Forecast by Country, 2018 to 2033
Table 18: Latin America Market Volume (Tons) Forecast by Country, 2018 to 2033
Table 19: Latin America Market Value (US$ Million) Forecast by Product Type, 2018 to 2033
Table 20: Latin America Market Volume (Tons) Forecast by Product Type, 2018 to 2033
Table 21: Latin America Market Value (US$ Million) Forecast by Material, 2018 to 2033
Table 22: Latin America Market Volume (Tons) Forecast by Material, 2018 to 2033
Table 23: Latin America Market Value (US$ Million) Forecast by Application, 2018 to 2033
Table 24: Latin America Market Volume (Tons) Forecast by Application, 2018 to 2033
Table 25: Western Europe Market Value (US$ Million) Forecast by Country, 2018 to 2033
Table 26: Western Europe Market Volume (Tons) Forecast by Country, 2018 to 2033
Table 27: Western Europe Market Value (US$ Million) Forecast by Product Type, 2018 to 2033
Table 28: Western Europe Market Volume (Tons) Forecast by Product Type, 2018 to 2033
Table 29: Western Europe Market Value (US$ Million) Forecast by Material, 2018 to 2033
Table 30: Western Europe Market Volume (Tons) Forecast by Material, 2018 to 2033
Table 31: Western Europe Market Value (US$ Million) Forecast by Application, 2018 to 2033
Table 32: Western Europe Market Volume (Tons) Forecast by Application, 2018 to 2033
Table 33: Eastern Europe Market Value (US$ Million) Forecast by Country, 2018 to 2033
Table 34: Eastern Europe Market Volume (Tons) Forecast by Country, 2018 to 2033
Table 35: Eastern Europe Market Value (US$ Million) Forecast by Product Type, 2018 to 2033
Table 36: Eastern Europe Market Volume (Tons) Forecast by Product Type, 2018 to 2033
Table 37: Eastern Europe Market Value (US$ Million) Forecast by Material, 2018 to 2033
Table 38: Eastern Europe Market Volume (Tons) Forecast by Material, 2018 to 2033
Table 39: Eastern Europe Market Value (US$ Million) Forecast by Application, 2018 to 2033
Table 40: Eastern Europe Market Volume (Tons) Forecast by Application, 2018 to 2033
Table 41: South Asia and Pacific Market Value (US$ Million) Forecast by Country, 2018 to 2033
Table 42: South Asia and Pacific Market Volume (Tons) Forecast by Country, 2018 to 2033
Table 43: South Asia and Pacific Market Value (US$ Million) Forecast by Product Type, 2018 to 2033
Table 44: South Asia and Pacific Market Volume (Tons) Forecast by Product Type, 2018 to 2033
Table 45: South Asia and Pacific Market Value (US$ Million) Forecast by Material, 2018 to 2033
Table 46: South Asia and Pacific Market Volume (Tons) Forecast by Material, 2018 to 2033
Table 47: South Asia and Pacific Market Value (US$ Million) Forecast by Application, 2018 to 2033
Table 48: South Asia and Pacific Market Volume (Tons) Forecast by Application, 2018 to 2033
Table 49: East Asia Market Value (US$ Million) Forecast by Country, 2018 to 2033
Table 50: East Asia Market Volume (Tons) Forecast by Country, 2018 to 2033
Table 51: East Asia Market Value (US$ Million) Forecast by Product Type, 2018 to 2033
Table 52: East Asia Market Volume (Tons) Forecast by Product Type, 2018 to 2033
Table 53: East Asia Market Value (US$ Million) Forecast by Material, 2018 to 2033
Table 54: East Asia Market Volume (Tons) Forecast by Material, 2018 to 2033
Table 55: East Asia Market Value (US$ Million) Forecast by Application, 2018 to 2033
Table 56: East Asia Market Volume (Tons) Forecast by Application, 2018 to 2033
Table 57: Middle East and Africa Market Value (US$ Million) Forecast by Country, 2018 to 2033
Table 58: Middle East and Africa Market Volume (Tons) Forecast by Country, 2018 to 2033
Table 59: Middle East and Africa Market Value (US$ Million) Forecast by Product Type, 2018 to 2033
Table 60: Middle East and Africa Market Volume (Tons) Forecast by Product Type, 2018 to 2033
Table 61: Middle East and Africa Market Value (US$ Million) Forecast by Material, 2018 to 2033
Table 62: Middle East and Africa Market Volume (Tons) Forecast by Material, 2018 to 2033
Table 63: Middle East and Africa Market Value (US$ Million) Forecast by Application, 2018 to 2033
Table 64: Middle East and Africa Market Volume (Tons) Forecast by Application, 2018 to 2033
Figure 1: Global Market Value (US$ Million) by Product Type, 2023 to 2033
Figure 2: Global Market Value (US$ Million) by Material, 2023 to 2033
Figure 3: Global Market Value (US$ Million) by Application, 2023 to 2033
Figure 4: Global Market Value (US$ Million) by Region, 2023 to 2033
Figure 5: Global Market Value (US$ Million) Analysis by Region, 2018 to 2033
Figure 6: Global Market Volume (Tons) Analysis by Region, 2018 to 2033
Figure 7: Global Market Value Share (%) and BPS Analysis by Region, 2023 to 2033
Figure 8: Global Market Y-o-Y Growth (%) Projections by Region, 2023 to 2033
Figure 9: Global Market Value (US$ Million) Analysis by Product Type, 2018 to 2033
Figure 10: Global Market Volume (Tons) Analysis by Product Type, 2018 to 2033
Figure 11: Global Market Value Share (%) and BPS Analysis by Product Type, 2023 to 2033
Figure 12: Global Market Y-o-Y Growth (%) Projections by Product Type, 2023 to 2033
Figure 13: Global Market Value (US$ Million) Analysis by Material, 2018 to 2033
Figure 14: Global Market Volume (Tons) Analysis by Material, 2018 to 2033
Figure 15: Global Market Value Share (%) and BPS Analysis by Material, 2023 to 2033
Figure 16: Global Market Y-o-Y Growth (%) Projections by Material, 2023 to 2033
Figure 17: Global Market Value (US$ Million) Analysis by Application, 2018 to 2033
Figure 18: Global Market Volume (Tons) Analysis by Application, 2018 to 2033
Figure 19: Global Market Value Share (%) and BPS Analysis by Application, 2023 to 2033
Figure 20: Global Market Y-o-Y Growth (%) Projections by Application, 2023 to 2033
Figure 21: Global Market Attractiveness by Product Type, 2023 to 2033
Figure 22: Global Market Attractiveness by Material, 2023 to 2033
Figure 23: Global Market Attractiveness by Application, 2023 to 2033
Figure 24: Global Market Attractiveness by Region, 2023 to 2033
Figure 25: North America Market Value (US$ Million) by Product Type, 2023 to 2033
Figure 26: North America Market Value (US$ Million) by Material, 2023 to 2033
Figure 27: North America Market Value (US$ Million) by Application, 2023 to 2033
Figure 28: North America Market Value (US$ Million) by Country, 2023 to 2033
Figure 29: North America Market Value (US$ Million) Analysis by Country, 2018 to 2033
Figure 30: North America Market Volume (Tons) Analysis by Country, 2018 to 2033
Figure 31: North America Market Value Share (%) and BPS Analysis by Country, 2023 to 2033
Figure 32: North America Market Y-o-Y Growth (%) Projections by Country, 2023 to 2033
Figure 33: North America Market Value (US$ Million) Analysis by Product Type, 2018 to 2033
Figure 34: North America Market Volume (Tons) Analysis by Product Type, 2018 to 2033
Figure 35: North America Market Value Share (%) and BPS Analysis by Product Type, 2023 to 2033
Figure 36: North America Market Y-o-Y Growth (%) Projections by Product Type, 2023 to 2033
Figure 37: North America Market Value (US$ Million) Analysis by Material, 2018 to 2033
Figure 38: North America Market Volume (Tons) Analysis by Material, 2018 to 2033
Figure 39: North America Market Value Share (%) and BPS Analysis by Material, 2023 to 2033
Figure 40: North America Market Y-o-Y Growth (%) Projections by Material, 2023 to 2033
Figure 41: North America Market Value (US$ Million) Analysis by Application, 2018 to 2033
Figure 42: North America Market Volume (Tons) Analysis by Application, 2018 to 2033
Figure 43: North America Market Value Share (%) and BPS Analysis by Application, 2023 to 2033
Figure 44: North America Market Y-o-Y Growth (%) Projections by Application, 2023 to 2033
Figure 45: North America Market Attractiveness by Product Type, 2023 to 2033
Figure 46: North America Market Attractiveness by Material, 2023 to 2033
Figure 47: North America Market Attractiveness by Application, 2023 to 2033
Figure 48: North America Market Attractiveness by Country, 2023 to 2033
Figure 49: Latin America Market Value (US$ Million) by Product Type, 2023 to 2033
Figure 50: Latin America Market Value (US$ Million) by Material, 2023 to 2033
Figure 51: Latin America Market Value (US$ Million) by Application, 2023 to 2033
Figure 52: Latin America Market Value (US$ Million) by Country, 2023 to 2033
Figure 53: Latin America Market Value (US$ Million) Analysis by Country, 2018 to 2033
Figure 54: Latin America Market Volume (Tons) Analysis by Country, 2018 to 2033
Figure 55: Latin America Market Value Share (%) and BPS Analysis by Country, 2023 to 2033
Figure 56: Latin America Market Y-o-Y Growth (%) Projections by Country, 2023 to 2033
Figure 57: Latin America Market Value (US$ Million) Analysis by Product Type, 2018 to 2033
Figure 58: Latin America Market Volume (Tons) Analysis by Product Type, 2018 to 2033
Figure 59: Latin America Market Value Share (%) and BPS Analysis by Product Type, 2023 to 2033
Figure 60: Latin America Market Y-o-Y Growth (%) Projections by Product Type, 2023 to 2033
Figure 61: Latin America Market Value (US$ Million) Analysis by Material, 2018 to 2033
Figure 62: Latin America Market Volume (Tons) Analysis by Material, 2018 to 2033
Figure 63: Latin America Market Value Share (%) and BPS Analysis by Material, 2023 to 2033
Figure 64: Latin America Market Y-o-Y Growth (%) Projections by Material, 2023 to 2033
Figure 65: Latin America Market Value (US$ Million) Analysis by Application, 2018 to 2033
Figure 66: Latin America Market Volume (Tons) Analysis by Application, 2018 to 2033
Figure 67: Latin America Market Value Share (%) and BPS Analysis by Application, 2023 to 2033
Figure 68: Latin America Market Y-o-Y Growth (%) Projections by Application, 2023 to 2033
Figure 69: Latin America Market Attractiveness by Product Type, 2023 to 2033
Figure 70: Latin America Market Attractiveness by Material, 2023 to 2033
Figure 71: Latin America Market Attractiveness by Application, 2023 to 2033
Figure 72: Latin America Market Attractiveness by Country, 2023 to 2033
Figure 73: Western Europe Market Value (US$ Million) by Product Type, 2023 to 2033
Figure 74: Western Europe Market Value (US$ Million) by Material, 2023 to 2033
Figure 75: Western Europe Market Value (US$ Million) by Application, 2023 to 2033
Figure 76: Western Europe Market Value (US$ Million) by Country, 2023 to 2033
Figure 77: Western Europe Market Value (US$ Million) Analysis by Country, 2018 to 2033
Figure 78: Western Europe Market Volume (Tons) Analysis by Country, 2018 to 2033
Figure 79: Western Europe Market Value Share (%) and BPS Analysis by Country, 2023 to 2033
Figure 80: Western Europe Market Y-o-Y Growth (%) Projections by Country, 2023 to 2033
Figure 81: Western Europe Market Value (US$ Million) Analysis by Product Type, 2018 to 2033
Figure 82: Western Europe Market Volume (Tons) Analysis by Product Type, 2018 to 2033
Figure 83: Western Europe Market Value Share (%) and BPS Analysis by Product Type, 2023 to 2033
Figure 84: Western Europe Market Y-o-Y Growth (%) Projections by Product Type, 2023 to 2033
Figure 85: Western Europe Market Value (US$ Million) Analysis by Material, 2018 to 2033
Figure 86: Western Europe Market Volume (Tons) Analysis by Material, 2018 to 2033
Figure 87: Western Europe Market Value Share (%) and BPS Analysis by Material, 2023 to 2033
Figure 88: Western Europe Market Y-o-Y Growth (%) Projections by Material, 2023 to 2033
Figure 89: Western Europe Market Value (US$ Million) Analysis by Application, 2018 to 2033
Figure 90: Western Europe Market Volume (Tons) Analysis by Application, 2018 to 2033
Figure 91: Western Europe Market Value Share (%) and BPS Analysis by Application, 2023 to 2033
Figure 92: Western Europe Market Y-o-Y Growth (%) Projections by Application, 2023 to 2033
Figure 93: Western Europe Market Attractiveness by Product Type, 2023 to 2033
Figure 94: Western Europe Market Attractiveness by Material, 2023 to 2033
Figure 95: Western Europe Market Attractiveness by Application, 2023 to 2033
Figure 96: Western Europe Market Attractiveness by Country, 2023 to 2033
Figure 97: Eastern Europe Market Value (US$ Million) by Product Type, 2023 to 2033
Figure 98: Eastern Europe Market Value (US$ Million) by Material, 2023 to 2033
Figure 99: Eastern Europe Market Value (US$ Million) by Application, 2023 to 2033
Figure 100: Eastern Europe Market Value (US$ Million) by Country, 2023 to 2033
Figure 101: Eastern Europe Market Value (US$ Million) Analysis by Country, 2018 to 2033
Figure 102: Eastern Europe Market Volume (Tons) Analysis by Country, 2018 to 2033
Figure 103: Eastern Europe Market Value Share (%) and BPS Analysis by Country, 2023 to 2033
Figure 104: Eastern Europe Market Y-o-Y Growth (%) Projections by Country, 2023 to 2033
Figure 105: Eastern Europe Market Value (US$ Million) Analysis by Product Type, 2018 to 2033
Figure 106: Eastern Europe Market Volume (Tons) Analysis by Product Type, 2018 to 2033
Figure 107: Eastern Europe Market Value Share (%) and BPS Analysis by Product Type, 2023 to 2033
Figure 108: Eastern Europe Market Y-o-Y Growth (%) Projections by Product Type, 2023 to 2033
Figure 109: Eastern Europe Market Value (US$ Million) Analysis by Material, 2018 to 2033
Figure 110: Eastern Europe Market Volume (Tons) Analysis by Material, 2018 to 2033
Figure 111: Eastern Europe Market Value Share (%) and BPS Analysis by Material, 2023 to 2033
Figure 112: Eastern Europe Market Y-o-Y Growth (%) Projections by Material, 2023 to 2033
Figure 113: Eastern Europe Market Value (US$ Million) Analysis by Application, 2018 to 2033
Figure 114: Eastern Europe Market Volume (Tons) Analysis by Application, 2018 to 2033
Figure 115: Eastern Europe Market Value Share (%) and BPS Analysis by Application, 2023 to 2033
Figure 116: Eastern Europe Market Y-o-Y Growth (%) Projections by Application, 2023 to 2033
Figure 117: Eastern Europe Market Attractiveness by Product Type, 2023 to 2033
Figure 118: Eastern Europe Market Attractiveness by Material, 2023 to 2033
Figure 119: Eastern Europe Market Attractiveness by Application, 2023 to 2033
Figure 120: Eastern Europe Market Attractiveness by Country, 2023 to 2033
Figure 121: South Asia and Pacific Market Value (US$ Million) by Product Type, 2023 to 2033
Figure 122: South Asia and Pacific Market Value (US$ Million) by Material, 2023 to 2033
Figure 123: South Asia and Pacific Market Value (US$ Million) by Application, 2023 to 2033
Figure 124: South Asia and Pacific Market Value (US$ Million) by Country, 2023 to 2033
Figure 125: South Asia and Pacific Market Value (US$ Million) Analysis by Country, 2018 to 2033
Figure 126: South Asia and Pacific Market Volume (Tons) Analysis by Country, 2018 to 2033
Figure 127: South Asia and Pacific Market Value Share (%) and BPS Analysis by Country, 2023 to 2033
Figure 128: South Asia and Pacific Market Y-o-Y Growth (%) Projections by Country, 2023 to 2033
Figure 129: South Asia and Pacific Market Value (US$ Million) Analysis by Product Type, 2018 to 2033
Figure 130: South Asia and Pacific Market Volume (Tons) Analysis by Product Type, 2018 to 2033
Figure 131: South Asia and Pacific Market Value Share (%) and BPS Analysis by Product Type, 2023 to 2033
Figure 132: South Asia and Pacific Market Y-o-Y Growth (%) Projections by Product Type, 2023 to 2033
Figure 133: South Asia and Pacific Market Value (US$ Million) Analysis by Material, 2018 to 2033
Figure 134: South Asia and Pacific Market Volume (Tons) Analysis by Material, 2018 to 2033
Figure 135: South Asia and Pacific Market Value Share (%) and BPS Analysis by Material, 2023 to 2033
Figure 136: South Asia and Pacific Market Y-o-Y Growth (%) Projections by Material, 2023 to 2033
Figure 137: South Asia and Pacific Market Value (US$ Million) Analysis by Application, 2018 to 2033
Figure 138: South Asia and Pacific Market Volume (Tons) Analysis by Application, 2018 to 2033
Figure 139: South Asia and Pacific Market Value Share (%) and BPS Analysis by Application, 2023 to 2033
Figure 140: South Asia and Pacific Market Y-o-Y Growth (%) Projections by Application, 2023 to 2033
Figure 141: South Asia and Pacific Market Attractiveness by Product Type, 2023 to 2033
Figure 142: South Asia and Pacific Market Attractiveness by Material, 2023 to 2033
Figure 143: South Asia and Pacific Market Attractiveness by Application, 2023 to 2033
Figure 144: South Asia and Pacific Market Attractiveness by Country, 2023 to 2033
Figure 145: East Asia Market Value (US$ Million) by Product Type, 2023 to 2033
Figure 146: East Asia Market Value (US$ Million) by Material, 2023 to 2033
Figure 147: East Asia Market Value (US$ Million) by Application, 2023 to 2033
Figure 148: East Asia Market Value (US$ Million) by Country, 2023 to 2033
Figure 149: East Asia Market Value (US$ Million) Analysis by Country, 2018 to 2033
Figure 150: East Asia Market Volume (Tons) Analysis by Country, 2018 to 2033
Figure 151: East Asia Market Value Share (%) and BPS Analysis by Country, 2023 to 2033
Figure 152: East Asia Market Y-o-Y Growth (%) Projections by Country, 2023 to 2033
Figure 153: East Asia Market Value (US$ Million) Analysis by Product Type, 2018 to 2033
Figure 154: East Asia Market Volume (Tons) Analysis by Product Type, 2018 to 2033
Figure 155: East Asia Market Value Share (%) and BPS Analysis by Product Type, 2023 to 2033
Figure 156: East Asia Market Y-o-Y Growth (%) Projections by Product Type, 2023 to 2033
Figure 157: East Asia Market Value (US$ Million) Analysis by Material, 2018 to 2033
Figure 158: East Asia Market Volume (Tons) Analysis by Material, 2018 to 2033
Figure 159: East Asia Market Value Share (%) and BPS Analysis by Material, 2023 to 2033
Figure 160: East Asia Market Y-o-Y Growth (%) Projections by Material, 2023 to 2033
Figure 161: East Asia Market Value (US$ Million) Analysis by Application, 2018 to 2033
Figure 162: East Asia Market Volume (Tons) Analysis by Application, 2018 to 2033
Figure 163: East Asia Market Value Share (%) and BPS Analysis by Application, 2023 to 2033
Figure 164: East Asia Market Y-o-Y Growth (%) Projections by Application, 2023 to 2033
Figure 165: East Asia Market Attractiveness by Product Type, 2023 to 2033
Figure 166: East Asia Market Attractiveness by Material, 2023 to 2033
Figure 167: East Asia Market Attractiveness by Application, 2023 to 2033
Figure 168: East Asia Market Attractiveness by Country, 2023 to 2033
Figure 169: Middle East and Africa Market Value (US$ Million) by Product Type, 2023 to 2033
Figure 170: Middle East and Africa Market Value (US$ Million) by Material, 2023 to 2033
Figure 171: Middle East and Africa Market Value (US$ Million) by Application, 2023 to 2033
Figure 172: Middle East and Africa Market Value (US$ Million) by Country, 2023 to 2033
Figure 173: Middle East and Africa Market Value (US$ Million) Analysis by Country, 2018 to 2033
Figure 174: Middle East and Africa Market Volume (Tons) Analysis by Country, 2018 to 2033
Figure 175: Middle East and Africa Market Value Share (%) and BPS Analysis by Country, 2023 to 2033
Figure 176: Middle East and Africa Market Y-o-Y Growth (%) Projections by Country, 2023 to 2033
Figure 177: Middle East and Africa Market Value (US$ Million) Analysis by Product Type, 2018 to 2033
Figure 178: Middle East and Africa Market Volume (Tons) Analysis by Product Type, 2018 to 2033
Figure 179: Middle East and Africa Market Value Share (%) and BPS Analysis by Product Type, 2023 to 2033
Figure 180: Middle East and Africa Market Y-o-Y Growth (%) Projections by Product Type, 2023 to 2033
Figure 181: Middle East and Africa Market Value (US$ Million) Analysis by Material, 2018 to 2033
Figure 182: Middle East and Africa Market Volume (Tons) Analysis by Material, 2018 to 2033
Figure 183: Middle East and Africa Market Value Share (%) and BPS Analysis by Material, 2023 to 2033
Figure 184: Middle East and Africa Market Y-o-Y Growth (%) Projections by Material, 2023 to 2033
Figure 185: Middle East and Africa Market Value (US$ Million) Analysis by Application, 2018 to 2033
Figure 186: Middle East and Africa Market Volume (Tons) Analysis by Application, 2018 to 2033
Figure 187: Middle East and Africa Market Value Share (%) and BPS Analysis by Application, 2023 to 2033
Figure 188: Middle East and Africa Market Y-o-Y Growth (%) Projections by Application, 2023 to 2033
Figure 189: Middle East and Africa Market Attractiveness by Product Type, 2023 to 2033
Figure 190: Middle East and Africa Market Attractiveness by Material, 2023 to 2033
Figure 191: Middle East and Africa Market Attractiveness by Application, 2023 to 2033
Figure 192: Middle East and Africa Market Attractiveness by Country, 2023 to 2033
In 2023, North America is anticipated to hold a 22% market share.
Asia Pacific tube laminating film market could be worth USD 12.8 billion by 2033.
India is anticipated to experience exponential expansion, with a CAGR of 6.5%.
Increased disposable incomes, expanding personal care and cosmetics product demand.
The key trend driving the tube laminating film market is the demand for flexible packaging.
Explore Similar Insights
Thank you!
You will receive an email from our Business Development Manager. Please be sure to check your SPAM/JUNK folder too.