The Sorter Machines market is experiencing significant growth driven by the increasing demand for automation and efficiency in logistics, manufacturing, and retail sectors. The market expansion is being supported by the rapid growth of e-commerce and the need for faster order fulfillment, which has encouraged widespread adoption of high-speed sorting systems. Technological advancements in machine vision, AI, and robotics have enhanced sorting precision, throughput, and flexibility, leading to better operational efficiency across industries.
The future outlook for this market is positive, with growing investments in warehouse automation and material handling infrastructure. The increasing integration of IoT-enabled systems is improving real-time monitoring and predictive maintenance, further boosting system reliability.
Moreover, the shift toward omnichannel retailing and the growing complexity of global supply chains are compelling organizations to deploy sorter machines that can handle diverse product types and order volumes As industries continue to prioritize productivity and accuracy, sorter machines are expected to remain central to next-generation automated systems.


| Metric | Value |
|---|---|
| Sorter Machines Market Estimated Value in (2025 E) | USD 1.5 billion |
| Sorter Machines Market Forecast Value in (2035 F) | USD 2.0 billion |
| Forecast CAGR (2025 to 2035) | 2.7% |
The market is segmented by Product Type, Throughput (Units/Hour), and End Use and region. By Product Type, the market is divided into Cross-Belt, Tilt-Tray, Sliding-Shoe, Narrow-Belt, and Others. In terms of Throughput (Units/Hour), the market is classified into 5,000-10,000, Below 5,000, 10,000-15,000, and Above 15,000. Based on End Use, the market is segmented into E-Commerce And Retail, Pharmaceutical & Medical Devices, Food And Beverage, Consumer Packaged Goods, and Logistics & Transportation. Regionally, the market is classified into North America, Latin America, Western Europe, Eastern Europe, Balkan & Baltic Countries, Russia & Belarus, Central Asia, East Asia, South Asia & Pacific, and the Middle East & Africa.

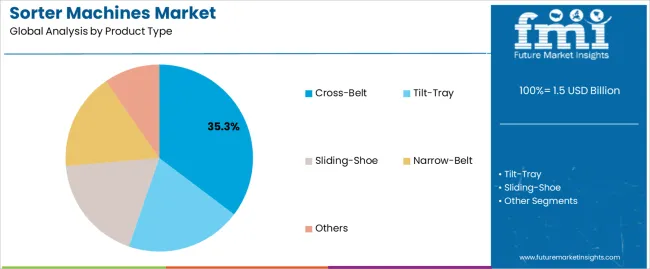
The Cross-Belt segment is projected to hold 35.30% of the sorter machines market revenue share in 2025, making it the leading product type. The dominance of this segment has been influenced by its ability to handle a wide variety of items with high speed and precision. Cross-belt sorters provide efficient performance in complex logistics environments by minimizing sorting errors and maximizing throughput.
Their modular design allows for scalability and easy system expansion, making them suitable for large distribution centers and high-volume operations. The growing need for real-time visibility and rapid parcel handling has also increased the adoption of cross-belt systems.
Enhanced software integration enables better data-driven control and optimized sorting paths, further supporting efficiency gains The demand for these systems is being propelled by the continuous rise in e-commerce activities and the pressure on supply chain operators to improve delivery timelines and reduce manual intervention.
The throughput range of 5,000-10,000 units per hour is expected to capture 40.00% of the sorter machines market revenue in 2025, emerging as the dominant throughput category. This segment’s strength lies in its balanced performance between speed and accuracy, catering to both medium and large-scale distribution operations. Systems with this throughput capacity provide optimal productivity while maintaining manageable energy consumption and maintenance costs.
The growing volume of small parcels and diverse SKUs in e-commerce and retail logistics has increased the need for flexible systems capable of handling moderate-to-high throughput levels. Moreover, this segment benefits from increasing warehouse automation, where facilities are designed to balance throughput efficiency with operational stability.
The adoption of AI-enabled control systems allows better synchronization with warehouse management software, further enhancing productivity This throughput range is increasingly being recognized as the most practical and cost-effective choice for facilities transitioning from semi-automated to fully automated operations.

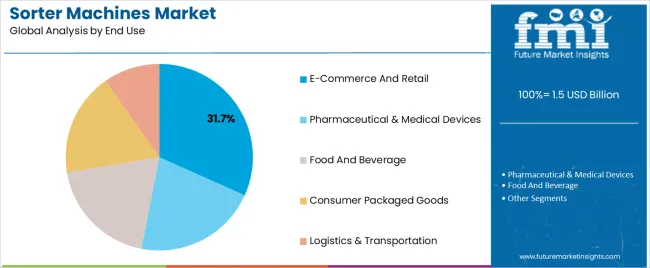
The e-commerce and retail segment is anticipated to account for 31.70% of the sorter machines market revenue in 2025, positioning it as the leading end-use industry. The continuous rise in online shopping volumes and customer expectations for same-day or next-day delivery has intensified the demand for efficient sorting systems. Sorter machines are being increasingly deployed to enhance order accuracy, minimize processing times, and improve fulfillment center efficiency.
The flexibility of sorter systems enables the handling of varied product sizes, packaging types, and return items, which are critical factors in e-commerce operations. Furthermore, retailers are investing in automated infrastructure to streamline inventory management and distribution processes, reducing labor dependency and operational costs.
The integration of data analytics and AI-driven optimization is improving sorting accuracy and throughput efficiency, further supporting adoption As retail and e-commerce companies expand their logistics capabilities, sorter machines are expected to remain integral to achieving operational scalability and customer satisfaction.
The above table presents the expected CAGR for the global sorter machines market over several semi-annual periods spanning from 2025 to 2035. In the first half (H1) of the year from 2025 to 2035, the business is predicted to surge at a CAGR of 2.5%, followed by a slightly lower growth rate of 3.0% in the second half (H2) of the same year.
| Particular | Value CAGR |
|---|---|
| H1 | 2.5% (2025 to 2035) |
| H2 | 3.0% (2025 to 2035) |
| H1 | 2.9% (2025 to 2035) |
| H2 | 2.5% (2025 to 2035) |
Moving into the subsequent period, from H1 2025 to H2 2035, the CAGR is projected to increase slightly to 2.9% in the first half and remain relatively moderate at 2.6% in the second half. In the first half (H1) the market witnessed an increase of 40 BPS while in the second half (H2), the market witnessed a decrease of 50 BPS.
Increasing Demand for Automated Sorting in the Food and Beverage Industry
The food and beverage industry is boosting the demand for sorting machines to meet the quality control and safety standards of the industry. The expansion of the food and beverage industry in recent periods is leading to rising demand for automated sorting machines. Sorting machines will offer increased efficiency in the production process by precise sorting.
These machines ensure accurate identification, remove contaminated and defective materials.
Sorting machines can be equipped with different technologies to sense defective items including optical sensors, x-rays, and AI. These functions will quickly identify the irregularities in shape, size, and other defectives in products and prevent them from getting defective products to the consumers.
Sorting machines ensure high-speed production and maintain product quality up to the mark ensuring consumer safety. The use of machines in the production process of food and beverages reduces human error thereby minimizing the risk of contamination and providing a safe and hygienic process.
Consumers inclining demand for safe and high-quality food products is rising which is increasing the adoption of automated sorting machines in the food and beverage sector.
Rapid Growth of E-commerce has increased the Volume of Packages
The E-commerce sector has been experiencing rapid growth in recent times due to the increased prevalence of online shopping. This growth has increased the volume of package shipping which is effectively increasing the demand for sorting machines. The shipping and logistics are handling a lot of parcels which needs to be managed efficiently.
Consumers are doing more online shopping and expecting the fastest delivery. This has also created competitive pressure on e-commerce and logistics companies to properly optimize operations and delivery.
Sorting machines when used in e-commerce and logistics can quickly sort a large volume of products irrespective of weight, size, destination, and other factors. These machines will reduce the need for manual sorting which will also reduce the errors and result in accurate sorting. These machines will also improve the efficiency of the process thereby fulfilling the consumers’ demands on time.
These machines can be used with advanced technologies which will further increase the precision and throughput of the sorting process. These machines are flexible and scalable which will help in handling different types of packages for seasonal spikes and varying demands.
The continued growth of e-commerce is anticipated to generate more demand for sorting machines as they are a crucial part of business for maintaining a competitive edge and consumer satisfaction.
High Initial Investment Cost Hamper Adoption
Small-scale companies find it unnecessary to invest in sorting machines as they require high purchasing and investments at the time of installation. Such companies have to also invest in maintenance, staff training, system integration, and other related expenses. This can be unfeasible to small and mid-sized players thus prohibiting its adoption.
Companies operating within low to medium production volume have less utilization of the machine resulting in high idle time. Small-scale enterprises are lacking in financial stability and have a lack of budget. Consequently, the high initial cost of the sorter machine poses a significant challenge for the market leading to its limited adoption especially by SME.
The global sorter machines industry recorded a CAGR of 2.1% during the historical period between 2020 and 2025. The growth of the sorter machines industry was positive as it reached a value of USD 1,419.1 million in 2025 from USD 1,282.2 million in 2020.
Sorter machines sort a variety of products, such as consumer goods, food, and other items, according to their endpoints. Demand for sorting machines increases as they use optical sorting, digital sorting, sensor sorting, magnet sorting, and other sorting techniques to efficiently detect and sort certain objects, which is expanding the sorting machines' market share.
In a programmed manner, these systems identify products based on their colour, weight, form, structural qualities, and so on, which creates an attractive market for the sales of sorting machines.
Sorter machines provide higher productivity, ease of use, and serviceability, as well as ultimate sorting performance and maximum capacity, which boost the sales of sorting machines. Such characteristics of sorting machines are projected to expand their use for diverse sorting applications.
Automated sorter equipment lines are critical in ensuring that commodities and products are appropriately categorized and distributed across a variety of sectors. Various enterprises are realizing the value of speed and accuracy in their production lines, and are turning to sorter machines to organize their varied products, which promotes the sales of sorter machines.
With high-capacity sorting, sorter machines have been shown to boost productivity and throughput. Over the foreseeable term, such factors are likely to drive significant demand for sorter machines.
In the next few years, rising production capacity in various end sectors, such as food, drinks, consumer goods, and others, combined with rising demand for automated sorting systems, is expected to increase demand for sorter machines. In many manufacturing industries, precision is crucial.
The sorter machines have been shown to work faster and more cost-effectively, without affecting product quality and enhancing the sales of sorter machines. During the projected period, these factors are expected to propel the worldwide sorter machines market share forward. Overall, the worldwide sorter machines market is expected to grow at a moderate pace over the forecast period.
Tier 1 companies comprise market leaders with a market revenue of above USD 50 million capturing a significant market share of 10% to 20% in the global market. These market leaders are characterized by high production capacity and a wide product portfolio.
These players are distinguished by their extensive expertise in manufacturing across multiple products across different applications and a broad geographical reach, underpinned by a robust consumer base. They provide a wide range of products utilizing the latest technology and meeting the regulatory standards providing the highest quality.
Prominent companies within Tier 1 encompass Daifuku Co., Ltd., BEUMER Group GmbH & Co. KG, Vanderlande Industries, Murata Machinery, Ltd., and Fives Intralogistics.
Tier 2 companies include mid-size players with revenue of USD 10 to 50 million having presence in specific regions and highly influencing the regional market. These are characterized by a limited international presence and well-maintained market knowledge. These market players have good technology and ensure regulatory compliance but may not have advanced technology and wide global reach.
Prominent companies in tier 2 include Bastian Solutions, Inc., Central Conveyor Company, Interroll Holding AG, TGW Logistics Group GmbH, Mantissa Corporation, Nido Machineries Pvt. Ltd., EuroSort Systems BV, Optimus Sorter Technology BV, Alstef Automation S.A., and Honeywell International.
Tier 3 includes the majority of small-scale companies operating at the local presence and serving niche markets having revenue below USD 10 million. These companies are notably oriented towards fulfilling local market demands and are consequently classified within the tier 3 share segment.
They are small-scale players and have very limited geographical reach. Tier 3, within this context, is recognized as an unorganized market, denoting a sector characterized by a lack of extensive structure and formalization when compared to organized competitors.
The section below covers the industry analysis of the sorter machines market for different countries. Market demand analysis on key countries in several regions of the globe, including North America, South Asia & Pacific, East Asia, Western Europe, Eastern Europe, and others, is provided.
In Europe, Germany is anticipated to register a moderate growth at 1.1% through 2035. China in East Asia and India in South Asia is expected to continue at the forefront in terms of market share and growth rate of sorter machines. In East Asia, China is projected to witness a growth rate of 4.9% by 2035 end.
| Countries | Value CAGR (2025 to 2035) |
|---|---|
| USA | 1.6% |
| Germany | 1.1% |
| UK | 1.5% |
| Canada | 1.4% |
| India | 4.9% |
| China | 4.1% |
| Japan | 1.9% |
| Thailand | 3.6% |

The retail sector has gone through enormous changes and has accelerated its digital offerings by adapting to consumer demands. The pandemic has come forth as a surprise and developed many existing trends of fulfilment and logistics. The number of retail stores continues to rise with the industry growth and the expansive economy, despite the continuously expanding share of e-commerce.
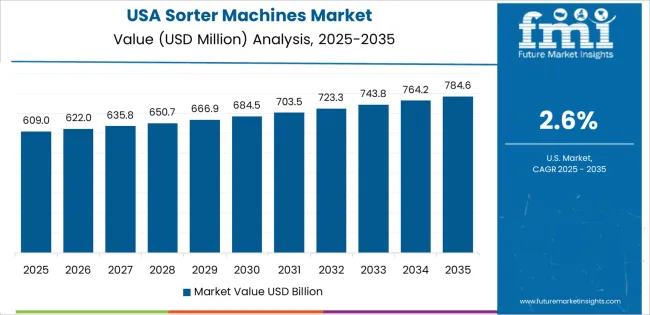
The role of brick-and-mortar stores, hypermarkets, and supermarkets has evolved to support all kinds of sales channels. Retail sales in the United States increased by 8.0% from USD 6,519.8 billion in 2024 to USD 7,041.0 billion in 2025, as per the reports of the USA Census Bureau’s 2025 Annual Retail Trade Survey (ARTS).
The number of retail establishments is increasing continually which shows that the expansion of the retail sector in the USA is blooming. The United States is expected to advance at a growth rate of 1.6% during 2025 to 2035.

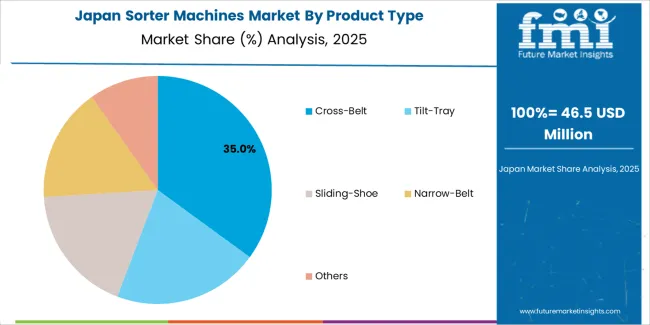
The food retail industry in Japan is anticipated to create numerous opportunities for the sorter machines market. According to the report published by the United States Department of Agriculture (USDA), the retail total sales of food and beverage industry in Japan has recorded the sales of USD 327 billion in the year 2025.
Supermarkets has recorded the bulk of sales in the retail food market, which is about 35%, while convenience stores, drugstores and internet sales of food and beverages accounts for rest of the market. The increasing retail sales of food and beverage Japan will accelerate the need for sorting machines in the country. Japan is anticipated to recording a 1.9% CAGR during the forecast years.
The section contains information about the leading segments in the industry. By product type, cross-belt is anticipated to capture 35.3% of value share through 2035. Among end use, E-commerce and retail is projected to showcase significant growth at 31.7% of market share through 2035.
| Product Type | Cross-belt |
|---|---|
| Value Share (2035) | 35.3% |
Cross-belt sorter machines are used prominently in the global market as they can handle large amounts of products very quickly and efficiently. Cross-belt sorter machines are ideal for large-volume industries like retail, e-commerce, and logistics. These machines have an accurate sorting mechanism which is useful in reducing errors and helps maintain consumer satisfaction along with excess cost reduction.
The cross belt machine can handle a variety of items irrespective of shape and size. Cross belt machines are space efficient which is essential in warehouses and distribution centers having less space. The machine has a modular design which allows it to easily integrate into existing production lines without many modifications.
This has fueled the demand for the cross belt sorter machine market capturing more than 35% of the market share in the global market.
| End Use | E-commerce and Retail |
|---|---|
| Value Share (2035) | 31.7% |
The significant growth of e-commerce and the retail sector in the global market is boosting the demand for sorter machines in future. The rising demand for products via online platforms has necessitated the need for sorting machines. The industry has been dealing with a large number of products daily that need to be processed and delivered to consumers within the stipulated period.
Proper sorting systems are becoming an essential part of the e-commerce and retail industry for handling large volumes of products. Speed and efficiency are critical in this sector thus generating the need for faster operations to ensure timely delivery. These sectors are dealing with fluctuations in order and volume and seasonal variations.
These machines will help the companies to deal with such peak demands without affecting the efficiency of the products. E-commerce and retail are set to gain more than 31% of the market share in the upcoming period.

Several prominent players in the sorter machines market are significantly investing in innovation, research, and development to discover new applications and enhance their offerings. Leveraging technology, these companies prioritize safety, product quality, and customer satisfaction to expand their customer base.
Key manufacturers of sorter machines are focusing on developing recycled material packaging and developing packaging solutions to meet sustainability demand. They are adopting a merger & acquisition strategy to expand their resources and are developing new products to meet customer needs.
Recent Industry Developments in Sorter Machines Market
In terms of product type, the industry is divided into cross-belt, tilt-tray, sliding-shoe, narrow-belt, and others.
In terms of throughput, the industry is segregated below 5,000, 5,000-10,000, 10,000-15,000, and above 15,000.
The industry is classified by end use as pharmaceutical & medical devices, food and beverage, e-commerce and retail, consumer packaged goods, and logistics & transportation.
Key countries of North America, Latin America, Western Europe, Eastern Europe, South Asia & Pacific, East Asia, and Middle East and Africa (MEA), have been covered in the report.
The global sorter machines market is estimated to be valued at USD 1.5 billion in 2025.
The market size for the sorter machines market is projected to reach USD 2.0 billion by 2035.
The sorter machines market is expected to grow at a 2.7% CAGR between 2025 and 2035.
The key product types in sorter machines market are cross-belt, tilt-tray, sliding-shoe, narrow-belt and others.
In terms of throughput (units/hour), 5,000-10,000 segment to command 40.0% share in the sorter machines market in 2025.


Our Research Products

The "Full Research Suite" delivers actionable market intel, deep dives on markets or technologies, so clients act faster, cut risk, and unlock growth.

The Leaderboard benchmarks and ranks top vendors, classifying them as Established Leaders, Leading Challengers, or Disruptors & Challengers.

Locates where complements amplify value and substitutes erode it, forecasting net impact by horizon

We deliver granular, decision-grade intel: market sizing, 5-year forecasts, pricing, adoption, usage, revenue, and operational KPIs—plus competitor tracking, regulation, and value chains—across 60 countries broadly.

Spot the shifts before they hit your P&L. We track inflection points, adoption curves, pricing moves, and ecosystem plays to show where demand is heading, why it is changing, and what to do next across high-growth markets and disruptive tech

Real-time reads of user behavior. We track shifting priorities, perceptions of today’s and next-gen services, and provider experience, then pace how fast tech moves from trial to adoption, blending buyer, consumer, and channel inputs with social signals (#WhySwitch, #UX).

Partner with our analyst team to build a custom report designed around your business priorities. From analysing market trends to assessing competitors or crafting bespoke datasets, we tailor insights to your needs.
Supplier Intelligence
Discovery & Profiling
Capacity & Footprint
Performance & Risk
Compliance & Governance
Commercial Readiness
Who Supplies Whom
Scorecards & Shortlists
Playbooks & Docs
Category Intelligence
Definition & Scope
Demand & Use Cases
Cost Drivers
Market Structure
Supply Chain Map
Trade & Policy
Operating Norms
Deliverables
Buyer Intelligence
Account Basics
Spend & Scope
Procurement Model
Vendor Requirements
Terms & Policies
Entry Strategy
Pain Points & Triggers
Outputs
Pricing Analysis
Benchmarks
Trends
Should-Cost
Indexation
Landed Cost
Commercial Terms
Deliverables
Brand Analysis
Positioning & Value Prop
Share & Presence
Customer Evidence
Go-to-Market
Digital & Reputation
Compliance & Trust
KPIs & Gaps
Outputs
Full Research Suite comprises of:
Market outlook & trends analysis
Interviews & case studies
Strategic recommendations
Vendor profiles & capabilities analysis
5-year forecasts
8 regions and 60+ country-level data splits
Market segment data splits
12 months of continuous data updates
DELIVERED AS:
PDF EXCEL ONLINE
Fiber Sorter Market Size and Share Forecast Outlook 2025 to 2035
Lathe Machines Market
Letter Sorters Market Analysis by Growth, Trends and Forecast from 2025 to 2035
Virtual Machines Market by Type, by Enterprise Size, by Industry & Region Forecast till 2035
Bandsaw Machines Market Growth - Trends & Forecast 2025 to 2035
Wrapping Machines for Handkerchiefs Market Size and Share Forecast Outlook 2025 to 2035
Sleeving Machines Market Size and Share Forecast Outlook 2025 to 2035
Drilling Machines Market Size and Share Forecast Outlook 2025 to 2035
Spinning Machines Market Size and Share Forecast Outlook 2025 to 2035
Knitting Machines Market Size and Share Forecast Outlook 2025 to 2035
Stamping Machines Market Growth and Outlook 2025 to 2035
Twist Tie Machines Market Size and Share Forecast Outlook 2025 to 2035
Cartoning Machines Market from 2025 to 2035
Flow Wrap Machines Market by Horizontal & Vertical Systems Through 2025 to 2035
Flake Ice Machines Market - Industry Growth & Market Demand 2025 to 2035
Flow Wrap Machines Market Analysis – Size, Share & Industry Trends 2025-2035
Ice Maker Machines Market
Tilt tray sorter Market
Granulator Machines Market Size and Share Forecast Outlook 2025 to 2035
Laminating Machines Market Size and Share Forecast Outlook 2025 to 2035

Thank you!
You will receive an email from our Business Development Manager. Please be sure to check your SPAM/JUNK folder too.
Chat With
MaRIA