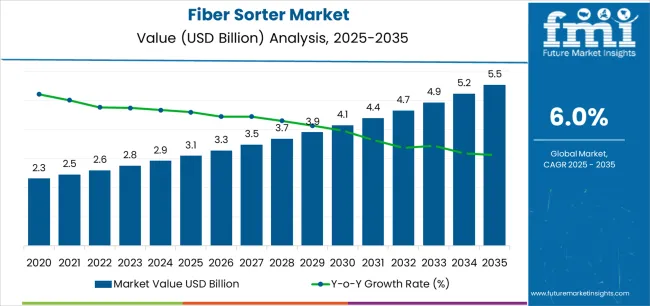
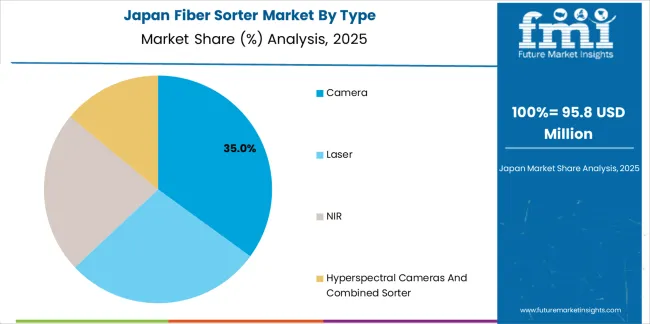
The Fiber Sorter Market size was valued at USD 2,824.2 million in 2023. Over the forecast period 2024 to 2034, fiber sorter demand is anticipated to rise at 6.3% CAGR. Total market value is predicted to increase from USD 2,914.6 million in 2024 to USD 5,369.2 million in 2034.
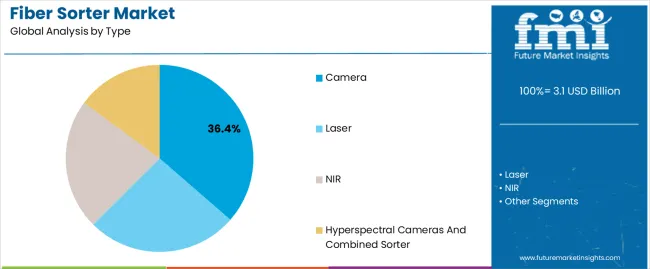
Demand for near-infrared spectroscopy (NIRS) in terms of type is projected to remain high in the fiber sorter industry. The latest analysis shows that the near-infrared spectroscopy segment is projected to thrive at 6.3% CAGR during the evaluation period.
Global Fiber Sorter Market Trends
Attributes | Key Insights |
---|---|
Fiber Sorter Market Size in 2023 | USD 2,824.2 million |
Estimated Fiber Sorter Market Value (2024E) | USD 2,914.6 million |
Projected Fiber Sorter Market Revenue (2034F) | USD 5,369.2 million |
Value-based Fiber Sorter Market CAGR (2024 to 2034) | 6.3% |
Collective Value Share: Top 5 Countries (2024E) | 53% |
Fiber Sorter Market to Expand Nearly 1.7X through 2034
The fiber sorter market is predicted to expand around 1.7X through 2034, accompanied by a 3.2% increase in the expected CAGR compared to the historical one. Fiber sorters are set to enable precise separation and classification of fibers.
The novel systems are anticipated to improve manufacturing processes, product quality, and resource utilization. From textiles to recycling, fiber sorters ensure optimal performance, driving advancements in diverse sectors. The fiber sorter industry is set to reach USD 5,369.2 million by 2034.
East Asia to be the Future of Automated Fiber Sorting Technology
East Asia is expected to hold around 28.9% of the global fiber sorter market share in 2034. This is attributed to the following factors:
Presence of a Large Textile Industry: As the world’s largest exporter of textiles, China is at the forefront with state-of-the-art facilities and a large workforce. Known for its technological innovations, Japan focuses on high-end clothing and fashion.
South Korea excels in advanced yarn processing and textile technology. Collectively, these countries contribute significantly to global textile production.
The countries are providing a wide range of products, from textiles to industrial garments. The region’s strategic investments, skilled labor, and technological prowess make East Asia an important player in the global textile industry.
Rapid Industrialization: East Asia is witnessing rapid industrialization, led by powerful economies such as China, Japan, and South Korea. As a leading manufacturing hub, China plays an important role in regulating industries.
Japan’s technological equity boom contributes significantly, while South Korea’s technological prowess expands into areas such as electronics and automotive. This technological boom not only expands the region’s economy but also its supply chain. Rising industrialization underscores the region’s transformation into an economic powerhouse.
Research & Development and Partnerships: East Asia has seen a remarkable increase in research & development activities, with China, Japan, and South Korea promoting innovation. Investments in science and technology are set to stimulate growth in several sectors.
Collaborations between academia, government, and industry are flourishing, creating a dynamic research & development ecosystem. Joint ventures, partnerships, and international cooperation underscore the region’s commitment to knowledge-driven growth.
As East Asia increasingly becomes a global innovation hub, collaborative efforts, and research & development programs are important to drive advancements. These are likely to shape the future of the industry and contribute to the region’s economic growth.
The fiber sorter market value grew at a CAGR of 3.1% between 2019 and 2023. Total market revenue reached about USD 2,824.2 million in 2023. In the forecast period, the fiber sorter industry is set to thrive at a CAGR of 6.3%.
Historical CAGR (2019 to 2023) | 3.1% |
---|---|
Forecast CAGR (2024 to 2034) | 6.3% |
The fiber sorter industry witnessed moderate growth between 2019 and 2023. It was attributed to economic growth in emerging markets, which led to the expansion of the textile and food industries.
Fiber Sorter Market Forecast
High Demand for Contamination-free Products in Textile Industry
Growing Awareness of Product Quality and Safety Standards
Regulatory Concerns are Affecting the Fiber Sorter Market
Lack of Awareness is a Crucial Concern for Market Growth
The table below shows the estimated growth rates of several countries in the global fiber sorter market. India, China, and Turkiye are set to record high CAGRs of 5.9%, 3.7%, and 2.8% respectively, through 2034.
Countries | Projected Fiber Sorter Market CAGR (2024 to 2034) |
---|---|
India | 5.9% |
China | 3.7% |
Turkiye | 2.8% |
Mexico | 2.1% |
Canada | 1.7% |
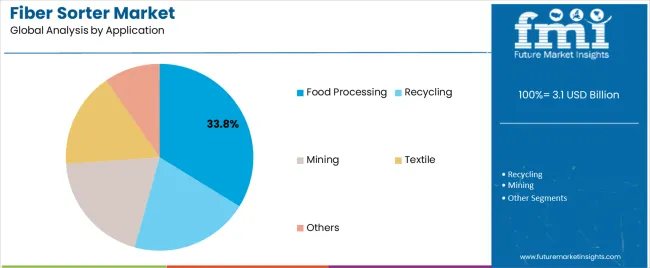
The section below shows the food processing segment dominating based on application. It is forecast to thrive at 6.7% CAGR between 2024 and 2034.
Based on type, the laser segment is anticipated to hold a dominant share through 2034. It is set to exhibit a CAGR of 6.9% during the forecast period.
Top Segment (Application) | Food Processing |
---|---|
Predicted CAGR (2024 to 2034) | 6.7% |
Top Segment (Type) | Laser |
---|---|
Projected CAGR (2024 to 2034) | 6.9% |
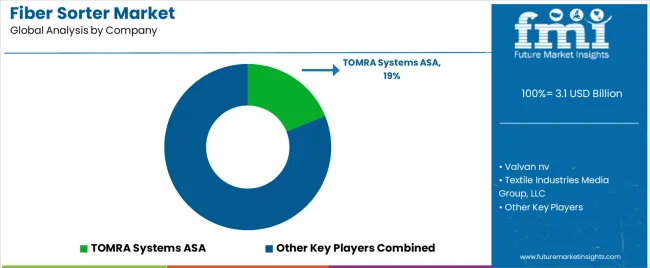
The fiber sorter market is fairly consolidated, with leading players accounting for about 60% to 65% share. Valvan NV, Textile Industries Media Group, Jingwei Textile Machinery Co., Ltd, Suzhou Deedo Machinery Co., Ltd, ALLGAIER WERKE GmbH, AsmSrl, Binder+Co, Bühler AG, A/S Cimbria, CP Manufacturing, Inc., EMS Turnkey Waste Recycling Solutions, Fowler Westrup, Key Technology, NATIONAL RECOVERY TECHNOLOGIES, LLC., Newtec A/S, and TOMRA Systems ASA are the leading manufacturers and suppliers of fiber sorter market listed in the report.
Key companies operating in the global fiber sorting machine market are focusing on launching state-of-the-art products to attract more customers. They are mainly using machine learning and artificial intelligence (AI) in their sorters to introduce innovative features and gain momentum in the market.
Recent Developments in the Fiber Sorter Market
Attribute | Details |
---|---|
Estimated Fiber Sorter Market Size (2024) | USD 2,914.6 million |
Projected Fiber Sorter Market Size (2034) | USD 5,369.2 million |
Anticipated Growth Rate (2024 to 2034) | 6.3% CAGR |
Historical Data | 2019 to 2023 |
Forecast Period | 2024 to 2034 |
Quantitative Units | Value (USD million) and Volume (tons) |
Report Coverage | Revenue Forecast, Volume Forecast, Company Ranking, Competitive Landscape, Growth Factors, Trends, and Pricing Analysis |
Fiber Sorter Market Segments Covered | Type, Platform, Application, Region |
Key Countries Covered | North America; Latin America; Western Europe; Eastern Europe; East Asia; South Asia Pacific; Middle East & Africa |
Key Companies Profiled | Valvan nv; Textile Industries Media Group, LLC; Jingwei Textile Machinery Co., Ltd.; Suzhou Deedo Machinery Co., Ltd; Zhengzhou Textile Machinery; ALLGAIER WERKE GmbH; AsmSrl; Binder+Co; Bühler AG; A/S Cimbria; CP Manufacturing Inc.; EMS Turnkey Waste Recycling Solutions; Fowler Westrup; Key Technology; NATIONAL RECOVERY TECHNOLOGIES, LLC; Newtec A/S; TOMRA Systems ASA |
Table 1: Global Market Value (US$ million) Forecast by Region, 2019 & 2034
Table 2: Global Market Volume (ton) Forecast by Region, 2019 & 2034
Table 3: Global Market Value (US$ million) Forecast by Type, 2019 & 2034
Table 4: Global Market Volume (ton) Forecast by Type, 2019 & 2034
Table 5: Global Market Value (US$ million) Forecast by Platform, 2019 & 2034
Table 6: Global Market Volume (ton) Forecast by Platform, 2019 & 2034
Table 7: Global Market Value (US$ million) Forecast by Application, 2019 & 2034
Table 8: Global Market Volume (ton) Forecast by Application, 2019 & 2034
Table 9: North America Market Value (US$ million) Forecast by Country, 2019 & 2034
Table 10: North America Market Volume (ton) Forecast by Country, 2019 & 2034
Table 11: North America Market Value (US$ million) Forecast by Type, 2019 & 2034
Table 12: North America Market Volume (ton) Forecast by Type, 2019 & 2034
Table 13: North America Market Value (US$ million) Forecast by Platform, 2019 & 2034
Table 14: North America Market Volume (ton) Forecast by Platform, 2019 & 2034
Table 15: North America Market Value (US$ million) Forecast by Application, 2019 & 2034
Table 16: North America Market Volume (ton) Forecast by Application, 2019 & 2034
Table 17: Latin America Market Value (US$ million) Forecast by Country, 2019 & 2034
Table 18: Latin America Market Volume (ton) Forecast by Country, 2019 & 2034
Table 19: Latin America Market Value (US$ million) Forecast by Type, 2019 & 2034
Table 20: Latin America Market Volume (ton) Forecast by Type, 2019 & 2034
Table 21: Latin America Market Value (US$ million) Forecast by Platform, 2019 & 2034
Table 22: Latin America Market Volume (ton) Forecast by Platform, 2019 & 2034
Table 23: Latin America Market Value (US$ million) Forecast by Application, 2019 & 2034
Table 24: Latin America Market Volume (ton) Forecast by Application, 2019 & 2034
Table 25: Western Europe Market Value (US$ million) Forecast by Country, 2019 & 2034
Table 26: Western Europe Market Volume (ton) Forecast by Country, 2019 & 2034
Table 27: Western Europe Market Value (US$ million) Forecast by Type, 2019 & 2034
Table 28: Western Europe Market Volume (ton) Forecast by Type, 2019 & 2034
Table 29: Western Europe Market Value (US$ million) Forecast by Platform, 2019 & 2034
Table 30: Western Europe Market Volume (ton) Forecast by Platform, 2019 & 2034
Table 31: Western Europe Market Value (US$ million) Forecast by Application, 2019 & 2034
Table 32: Western Europe Market Volume (ton) Forecast by Application, 2019 & 2034
Table 33: Eastern Europe Market Value (US$ million) Forecast by Country, 2019 & 2034
Table 34: Eastern Europe Market Volume (ton) Forecast by Country, 2019 & 2034
Table 35: Eastern Europe Market Value (US$ million) Forecast by Type, 2019 & 2034
Table 36: Eastern Europe Market Volume (ton) Forecast by Type, 2019 & 2034
Table 37: Eastern Europe Market Value (US$ million) Forecast by Platform, 2019 & 2034
Table 38: Eastern Europe Market Volume (ton) Forecast by Platform, 2019 & 2034
Table 39: Eastern Europe Market Value (US$ million) Forecast by Application, 2019 & 2034
Table 40: Eastern Europe Market Volume (ton) Forecast by Application, 2019 & 2034
Table 41: East Asia Market Value (US$ million) Forecast by Country, 2019 & 2034
Table 42: East Asia Market Volume (ton) Forecast by Country, 2019 & 2034
Table 43: East Asia Market Value (US$ million) Forecast by Type, 2019 & 2034
Table 44: East Asia Market Volume (ton) Forecast by Type, 2019 & 2034
Table 45: East Asia Market Value (US$ million) Forecast by Platform, 2019 & 2034
Table 46: East Asia Market Volume (ton) Forecast by Platform, 2019 & 2034
Table 47: East Asia Market Value (US$ million) Forecast by Application, 2019 & 2034
Table 48: East Asia Market Volume (ton) Forecast by Application, 2019 & 2034
Table 49: South Asia Pacific Market Value (US$ million) Forecast by Country, 2019 & 2034
Table 50: South Asia Pacific Market Volume (ton) Forecast by Country, 2019 & 2034
Table 51: South Asia Pacific Market Value (US$ million) Forecast by Type, 2019 & 2034
Table 52: South Asia Pacific Market Volume (ton) Forecast by Type, 2019 & 2034
Table 53: South Asia Pacific Market Value (US$ million) Forecast by Platform, 2019 & 2034
Table 54: South Asia Pacific Market Volume (ton) Forecast by Platform, 2019 & 2034
Table 55: South Asia Pacific Market Value (US$ million) Forecast by Application, 2019 & 2034
Table 56: South Asia Pacific Market Volume (ton) Forecast by Application, 2019 & 2034
Table 57: Middle East & Africa Market Value (US$ million) Forecast by Country, 2019 & 2034
Table 58: Middle East & Africa Market Volume (ton) Forecast by Country, 2019 & 2034
Table 59: Middle East & Africa Market Value (US$ million) Forecast by Type, 2019 & 2034
Table 60: Middle East & Africa Market Volume (ton) Forecast by Type, 2019 & 2034
Table 61: Middle East & Africa Market Value (US$ million) Forecast by Platform, 2019 & 2034
Table 62: Middle East & Africa Market Volume (ton) Forecast by Platform, 2019 & 2034
Table 63: Middle East & Africa Market Value (US$ million) Forecast by Application, 2019 & 2034
Table 64: Middle East & Africa Market Volume (ton) Forecast by Application, 2019 & 2034
Figure 1: Global Market Value (US$ million) by Type, 2024 & 2034
Figure 2: Global Market Value (US$ million) by Platform, 2024 & 2034
Figure 3: Global Market Value (US$ million) by Application, 2024 & 2034
Figure 4: Global Market Value (US$ million) by Region, 2024 & 2034
Figure 5: Global Market Value (US$ million) Analysis by Region, 2019 & 2034
Figure 6: Global Market Volume (ton) Analysis by Region, 2019 & 2034
Figure 7: Global Market Value Share (%) and BPS Analysis by Region, 2024 & 2034
Figure 8: Global Market Y-o-Y Growth (%) Projections by Region, 2024 to 2034
Figure 9: Global Market Value (US$ million) Analysis by Type, 2019 & 2034
Figure 10: Global Market Volume (ton) Analysis by Type, 2019 & 2034
Figure 11: Global Market Value Share (%) and BPS Analysis by Type, 2024 & 2034
Figure 12: Global Market Y-o-Y Growth (%) Projections by Type, 2024 to 2034
Figure 13: Global Market Value (US$ million) Analysis by Platform, 2019 & 2034
Figure 14: Global Market Volume (ton) Analysis by Platform, 2019 & 2034
Figure 15: Global Market Value Share (%) and BPS Analysis by Platform, 2024 & 2034
Figure 16: Global Market Y-o-Y Growth (%) Projections by Platform, 2024 to 2034
Figure 17: Global Market Value (US$ million) Analysis by Application, 2019 & 2034
Figure 18: Global Market Volume (ton) Analysis by Application, 2019 & 2034
Figure 19: Global Market Value Share (%) and BPS Analysis by Application, 2024 & 2034
Figure 20: Global Market Y-o-Y Growth (%) Projections by Application, 2024 to 2034
Figure 21: Global Market Attractiveness by Type, 2024 to 2034
Figure 22: Global Market Attractiveness by Platform, 2024 to 2034
Figure 23: Global Market Attractiveness by Application, 2024 to 2034
Figure 24: Global Market Attractiveness by Region, 2024 to 2034
Figure 25: North America Market Value (US$ million) by Type, 2024 & 2034
Figure 26: North America Market Value (US$ million) by Platform, 2024 & 2034
Figure 27: North America Market Value (US$ million) by Application, 2024 & 2034
Figure 28: North America Market Value (US$ million) by Country, 2024 & 2034
Figure 29: North America Market Value (US$ million) Analysis by Country, 2019 & 2034
Figure 30: North America Market Volume (ton) Analysis by Country, 2019 & 2034
Figure 31: North America Market Value Share (%) and BPS Analysis by Country, 2024 & 2034
Figure 32: North America Market Y-o-Y Growth (%) Projections by Country, 2024 to 2034
Figure 33: North America Market Value (US$ million) Analysis by Type, 2019 & 2034
Figure 34: North America Market Volume (ton) Analysis by Type, 2019 & 2034
Figure 35: North America Market Value Share (%) and BPS Analysis by Type, 2024 & 2034
Figure 36: North America Market Y-o-Y Growth (%) Projections by Type, 2024 to 2034
Figure 37: North America Market Value (US$ million) Analysis by Platform, 2019 & 2034
Figure 38: North America Market Volume (ton) Analysis by Platform, 2019 & 2034
Figure 39: North America Market Value Share (%) and BPS Analysis by Platform, 2024 & 2034
Figure 40: North America Market Y-o-Y Growth (%) Projections by Platform, 2024 to 2034
Figure 41: North America Market Value (US$ million) Analysis by Application, 2019 & 2034
Figure 42: North America Market Volume (ton) Analysis by Application, 2019 & 2034
Figure 43: North America Market Value Share (%) and BPS Analysis by Application, 2024 & 2034
Figure 44: North America Market Y-o-Y Growth (%) Projections by Application, 2024 to 2034
Figure 45: North America Market Attractiveness by Type, 2024 to 2034
Figure 46: North America Market Attractiveness by Platform, 2024 to 2034
Figure 47: North America Market Attractiveness by Application, 2024 to 2034
Figure 48: North America Market Attractiveness by Country, 2024 to 2034
Figure 49: Latin America Market Value (US$ million) by Type, 2024 & 2034
Figure 50: Latin America Market Value (US$ million) by Platform, 2024 & 2034
Figure 51: Latin America Market Value (US$ million) by Application, 2024 & 2034
Figure 52: Latin America Market Value (US$ million) by Country, 2024 & 2034
Figure 53: Latin America Market Value (US$ million) Analysis by Country, 2019 & 2034
Figure 54: Latin America Market Volume (ton) Analysis by Country, 2019 & 2034
Figure 55: Latin America Market Value Share (%) and BPS Analysis by Country, 2024 & 2034
Figure 56: Latin America Market Y-o-Y Growth (%) Projections by Country, 2024 to 2034
Figure 57: Latin America Market Value (US$ million) Analysis by Type, 2019 & 2034
Figure 58: Latin America Market Volume (ton) Analysis by Type, 2019 & 2034
Figure 59: Latin America Market Value Share (%) and BPS Analysis by Type, 2024 & 2034
Figure 60: Latin America Market Y-o-Y Growth (%) Projections by Type, 2024 to 2034
Figure 61: Latin America Market Value (US$ million) Analysis by Platform, 2019 & 2034
Figure 62: Latin America Market Volume (ton) Analysis by Platform, 2019 & 2034
Figure 63: Latin America Market Value Share (%) and BPS Analysis by Platform, 2024 & 2034
Figure 64: Latin America Market Y-o-Y Growth (%) Projections by Platform, 2024 to 2034
Figure 65: Latin America Market Value (US$ million) Analysis by Application, 2019 & 2034
Figure 66: Latin America Market Volume (ton) Analysis by Application, 2019 & 2034
Figure 67: Latin America Market Value Share (%) and BPS Analysis by Application, 2024 & 2034
Figure 68: Latin America Market Y-o-Y Growth (%) Projections by Application, 2024 to 2034
Figure 69: Latin America Market Attractiveness by Type, 2024 to 2034
Figure 70: Latin America Market Attractiveness by Platform, 2024 to 2034
Figure 71: Latin America Market Attractiveness by Application, 2024 to 2034
Figure 72: Latin America Market Attractiveness by Country, 2024 to 2034
Figure 73: Western Europe Market Value (US$ million) by Type, 2024 & 2034
Figure 74: Western Europe Market Value (US$ million) by Platform, 2024 & 2034
Figure 75: Western Europe Market Value (US$ million) by Application, 2024 & 2034
Figure 76: Western Europe Market Value (US$ million) by Country, 2024 & 2034
Figure 77: Western Europe Market Value (US$ million) Analysis by Country, 2019 & 2034
Figure 78: Western Europe Market Volume (ton) Analysis by Country, 2019 & 2034
Figure 79: Western Europe Market Value Share (%) and BPS Analysis by Country, 2024 & 2034
Figure 80: Western Europe Market Y-o-Y Growth (%) Projections by Country, 2024 to 2034
Figure 81: Western Europe Market Value (US$ million) Analysis by Type, 2019 & 2034
Figure 82: Western Europe Market Volume (ton) Analysis by Type, 2019 & 2034
Figure 83: Western Europe Market Value Share (%) and BPS Analysis by Type, 2024 & 2034
Figure 84: Western Europe Market Y-o-Y Growth (%) Projections by Type, 2024 to 2034
Figure 85: Western Europe Market Value (US$ million) Analysis by Platform, 2019 & 2034
Figure 86: Western Europe Market Volume (ton) Analysis by Platform, 2019 & 2034
Figure 87: Western Europe Market Value Share (%) and BPS Analysis by Platform, 2024 & 2034
Figure 88: Western Europe Market Y-o-Y Growth (%) Projections by Platform, 2024 to 2034
Figure 89: Western Europe Market Value (US$ million) Analysis by Application, 2019 & 2034
Figure 90: Western Europe Market Volume (ton) Analysis by Application, 2019 & 2034
Figure 91: Western Europe Market Value Share (%) and BPS Analysis by Application, 2024 & 2034
Figure 92: Western Europe Market Y-o-Y Growth (%) Projections by Application, 2024 to 2034
Figure 93: Western Europe Market Attractiveness by Type, 2024 to 2034
Figure 94: Western Europe Market Attractiveness by Platform, 2024 to 2034
Figure 95: Western Europe Market Attractiveness by Application, 2024 to 2034
Figure 96: Western Europe Market Attractiveness by Country, 2024 to 2034
Figure 97: Eastern Europe Market Value (US$ million) by Type, 2024 & 2034
Figure 98: Eastern Europe Market Value (US$ million) by Platform, 2024 & 2034
Figure 99: Eastern Europe Market Value (US$ million) by Application, 2024 & 2034
Figure 100: Eastern Europe Market Value (US$ million) by Country, 2024 & 2034
Figure 101: Eastern Europe Market Value (US$ million) Analysis by Country, 2019 & 2034
Figure 102: Eastern Europe Market Volume (ton) Analysis by Country, 2019 & 2034
Figure 103: Eastern Europe Market Value Share (%) and BPS Analysis by Country, 2024 & 2034
Figure 104: Eastern Europe Market Y-o-Y Growth (%) Projections by Country, 2024 to 2034
Figure 105: Eastern Europe Market Value (US$ million) Analysis by Type, 2019 & 2034
Figure 106: Eastern Europe Market Volume (ton) Analysis by Type, 2019 & 2034
Figure 107: Eastern Europe Market Value Share (%) and BPS Analysis by Type, 2024 & 2034
Figure 108: Eastern Europe Market Y-o-Y Growth (%) Projections by Type, 2024 to 2034
Figure 109: Eastern Europe Market Value (US$ million) Analysis by Platform, 2019 & 2034
Figure 110: Eastern Europe Market Volume (ton) Analysis by Platform, 2019 & 2034
Figure 111: Eastern Europe Market Value Share (%) and BPS Analysis by Platform, 2024 & 2034
Figure 112: Eastern Europe Market Y-o-Y Growth (%) Projections by Platform, 2024 to 2034
Figure 113: Eastern Europe Market Value (US$ million) Analysis by Application, 2019 & 2034
Figure 114: Eastern Europe Market Volume (ton) Analysis by Application, 2019 & 2034
Figure 115: Eastern Europe Market Value Share (%) and BPS Analysis by Application, 2024 & 2034
Figure 116: Eastern Europe Market Y-o-Y Growth (%) Projections by Application, 2024 to 2034
Figure 117: Eastern Europe Market Attractiveness by Type, 2024 to 2034
Figure 118: Eastern Europe Market Attractiveness by Platform, 2024 to 2034
Figure 119: Eastern Europe Market Attractiveness by Application, 2024 to 2034
Figure 120: Eastern Europe Market Attractiveness by Country, 2024 to 2034
Figure 121: East Asia Market Value (US$ million) by Type, 2024 & 2034
Figure 122: East Asia Market Value (US$ million) by Platform, 2024 & 2034
Figure 123: East Asia Market Value (US$ million) by Application, 2024 & 2034
Figure 124: East Asia Market Value (US$ million) by Country, 2024 & 2034
Figure 125: East Asia Market Value (US$ million) Analysis by Country, 2019 & 2034
Figure 126: East Asia Market Volume (ton) Analysis by Country, 2019 & 2034
Figure 127: East Asia Market Value Share (%) and BPS Analysis by Country, 2024 & 2034
Figure 128: East Asia Market Y-o-Y Growth (%) Projections by Country, 2024 to 2034
Figure 129: East Asia Market Value (US$ million) Analysis by Type, 2019 & 2034
Figure 130: East Asia Market Volume (ton) Analysis by Type, 2019 & 2034
Figure 131: East Asia Market Value Share (%) and BPS Analysis by Type, 2024 & 2034
Figure 132: East Asia Market Y-o-Y Growth (%) Projections by Type, 2024 to 2034
Figure 133: East Asia Market Value (US$ million) Analysis by Platform, 2019 & 2034
Figure 134: East Asia Market Volume (ton) Analysis by Platform, 2019 & 2034
Figure 135: East Asia Market Value Share (%) and BPS Analysis by Platform, 2024 & 2034
Figure 136: East Asia Market Y-o-Y Growth (%) Projections by Platform, 2024 to 2034
Figure 137: East Asia Market Value (US$ million) Analysis by Application, 2019 & 2034
Figure 138: East Asia Market Volume (ton) Analysis by Application, 2019 & 2034
Figure 139: East Asia Market Value Share (%) and BPS Analysis by Application, 2024 & 2034
Figure 140: East Asia Market Y-o-Y Growth (%) Projections by Application, 2024 to 2034
Figure 141: East Asia Market Attractiveness by Type, 2024 to 2034
Figure 142: East Asia Market Attractiveness by Platform, 2024 to 2034
Figure 143: East Asia Market Attractiveness by Application, 2024 to 2034
Figure 144: East Asia Market Attractiveness by Country, 2024 to 2034
Figure 145: South Asia Pacific Market Value (US$ million) by Type, 2024 & 2034
Figure 146: South Asia Pacific Market Value (US$ million) by Platform, 2024 & 2034
Figure 147: South Asia Pacific Market Value (US$ million) by Application, 2024 & 2034
Figure 148: South Asia Pacific Market Value (US$ million) by Country, 2024 & 2034
Figure 149: South Asia Pacific Market Value (US$ million) Analysis by Country, 2019 & 2034
Figure 150: South Asia Pacific Market Volume (ton) Analysis by Country, 2019 & 2034
Figure 151: South Asia Pacific Market Value Share (%) and BPS Analysis by Country, 2024 & 2034
Figure 152: South Asia Pacific Market Y-o-Y Growth (%) Projections by Country, 2024 to 2034
Figure 153: South Asia Pacific Market Value (US$ million) Analysis by Type, 2019 & 2034
Figure 154: South Asia Pacific Market Volume (ton) Analysis by Type, 2019 & 2034
Figure 155: South Asia Pacific Market Value Share (%) and BPS Analysis by Type, 2024 & 2034
Figure 156: South Asia Pacific Market Y-o-Y Growth (%) Projections by Type, 2024 to 2034
Figure 157: South Asia Pacific Market Value (US$ million) Analysis by Platform, 2019 & 2034
Figure 158: South Asia Pacific Market Volume (ton) Analysis by Platform, 2019 & 2034
Figure 159: South Asia Pacific Market Value Share (%) and BPS Analysis by Platform, 2024 & 2034
Figure 160: South Asia Pacific Market Y-o-Y Growth (%) Projections by Platform, 2024 to 2034
Figure 161: South Asia Pacific Market Value (US$ million) Analysis by Application, 2019 & 2034
Figure 162: South Asia Pacific Market Volume (ton) Analysis by Application, 2019 & 2034
Figure 163: South Asia Pacific Market Value Share (%) and BPS Analysis by Application, 2024 & 2034
Figure 164: South Asia Pacific Market Y-o-Y Growth (%) Projections by Application, 2024 to 2034
Figure 165: South Asia Pacific Market Attractiveness by Type, 2024 to 2034
Figure 166: South Asia Pacific Market Attractiveness by Platform, 2024 to 2034
Figure 167: South Asia Pacific Market Attractiveness by Application, 2024 to 2034
Figure 168: South Asia Pacific Market Attractiveness by Country, 2024 to 2034
Figure 169: Middle East & Africa Market Value (US$ million) by Type, 2024 & 2034
Figure 170: Middle East & Africa Market Value (US$ million) by Platform, 2024 & 2034
Figure 171: Middle East & Africa Market Value (US$ million) by Application, 2024 & 2034
Figure 172: Middle East & Africa Market Value (US$ million) by Country, 2024 & 2034
Figure 173: Middle East & Africa Market Value (US$ million) Analysis by Country, 2019 & 2034
Figure 174: Middle East & Africa Market Volume (ton) Analysis by Country, 2019 & 2034
Figure 175: Middle East & Africa Market Value Share (%) and BPS Analysis by Country, 2024 & 2034
Figure 176: Middle East & Africa Market Y-o-Y Growth (%) Projections by Country, 2024 to 2034
Figure 177: Middle East & Africa Market Value (US$ million) Analysis by Type, 2019 & 2034
Figure 178: Middle East & Africa Market Volume (ton) Analysis by Type, 2019 & 2034
Figure 179: Middle East & Africa Market Value Share (%) and BPS Analysis by Type, 2024 & 2034
Figure 180: Middle East & Africa Market Y-o-Y Growth (%) Projections by Type, 2024 to 2034
Figure 181: Middle East & Africa Market Value (US$ million) Analysis by Platform, 2019 & 2034
Figure 182: Middle East & Africa Market Volume (ton) Analysis by Platform, 2019 & 2034
Figure 183: Middle East & Africa Market Value Share (%) and BPS Analysis by Platform, 2024 & 2034
Figure 184: Middle East & Africa Market Y-o-Y Growth (%) Projections by Platform, 2024 to 2034
Figure 185: Middle East & Africa Market Value (US$ million) Analysis by Application, 2019 & 2034
Figure 186: Middle East & Africa Market Volume (ton) Analysis by Application, 2019 & 2034
Figure 187: Middle East & Africa Market Value Share (%) and BPS Analysis by Application, 2024 & 2034
Figure 188: Middle East & Africa Market Y-o-Y Growth (%) Projections by Application, 2024 to 2034
Figure 189: Middle East & Africa Market Attractiveness by Type, 2024 to 2034
Figure 190: Middle East & Africa Market Attractiveness by Platform, 2024 to 2034
Figure 191: Middle East & Africa Market Attractiveness by Application, 2024 to 2034
Figure 192: Middle East & Africa Market Attractiveness by Country, 2024 to 2034
The global fiber sorter industry was valued at USD 2,824.2 million in 2023.
The fiber sorter industry value is set to reach USD 2,914.6 million in 2024.
Global fiber sorter demand is anticipated to rise at 6.3% CAGR.
The fiber sorter industry size is set to reach USD 5,369.2 million by 2034.
Food processing is expected to lead the market during the forecast period.
The laser segment is expected to dominate the fiber sorter industry.
Explore Operational Equipment Insights
Thank you!
You will receive an email from our Business Development Manager. Please be sure to check your SPAM/JUNK folder too.