Reports

- Global Locations -

Headquarters

Future Market Insights, Inc.

Christiana Corporate, 200
Continental Drive, Suite 401,
Newark, Delaware - 19713,
United States

T: +1-845-579-5705

Americas

Future Market Insights, Inc.

616 Corporate Way, Suite 2-9018,
Valley Cottage, NY 10989, United States

T: +1-347-918-3531

MEA

Future Market Insights

1602-6 Jumeirah Bay X2 Tower, Plot No: JLT-PH2-X2A,
Jumeirah Lakes Towers, Dubai,
United Arab Emirates

Europe

Future Market Insights

3rd Floor, 207 Regent Street,
W1B 3HH London
United Kingdom

T: + 44 (0) 20 8123 9659
D: +44 (0) 20 3287 4268

Asia Pacific

Future Market Insights

IndiaLand Global Tech Park, Unit UG-1, Behind Grand HighStreet, Phase 1, Hinjawadi, MH, Pune – 411057, India

Fiber Reinforced Polymer Panel and Sheet Market Outlook from 2024 to 2034

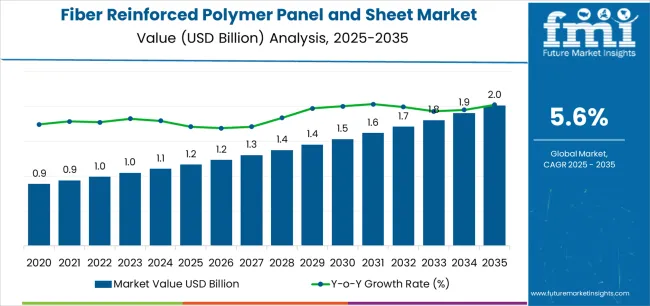
The fiber reinforced polymer panel and sheet market is projected to be worth US$ 1.1 billion in 2024. The market is anticipated to reach US$ 1.9 billion by 2034. The market is further expected to surge at a CAGR of 5.9% during the forecast period 2024 to 2034.

Key Market Trends and Highlights

Fiber reinforced polymer panels and sheets are increasingly being used in the construction industry due to their lightweight nature, durability, and resistance to corrosion. The demand for these are expected to rise, with the growth of construction activities globally.

  • Fiber reinforced polymer panels and sheets offer advantages over traditional materials such as wood, metal, and concrete. They are lightweight, strong, corrosion resistant, and require minimal maintenance, making them attractive for various applications including infrastructure, automotive, aerospace, and marine industries.
  • Increasing regulations and standards regarding environmental sustainability and safety are driving the demand for materials like fiber reinforced polymer that offer superior performance while meeting regulatory requirements.
  • Ongoing technological advancements in manufacturing processes, such as improved resin formulations and production techniques, are enhancing the performance characteristics of fiber reinforced polymer panels and sheets.
Attributes Key Insights
Fiber Reinforced Polymer Panel and Sheet Market Estimated Size in 2024 US$ 1.1 billion
Projected Market Value in 2034 US$ 1.9 billion
Value-based CAGR from 2024 to 2034 5.9%

Don't pay for what you don't need

Customize your report by selecting specific countries or regions and save 30%!

2019 to 2023 Historical Analysis vs. 2024 to 2034 Market Forecast Projections

The scope for fiber reinforced polymer panel and sheet rose at a 7.5% CAGR between 2019 and 2023. The global market is anticipated to grow at a moderate CAGR of 5.9% over the forecast period 2024 to 2034.

The market experienced steady growth during the historical period from 2019 to 2023, driven by factors such as increasing infrastructure development, demand for lightweight and durable materials, and advancements in manufacturing technology.

Fiber reinforced polymer materials were increasingly adopted across various industries including construction, automotive, aerospace, marine, and renewable energy sectors due to their superior performance characteristics and cost effectiveness.

Ongoing technological advancements in fiber reinforced polymer manufacturing processes led to the development of innovative products with enhanced properties such as improved strength, durability, fire resistance, and environmental sustainability.

Looking ahead to the forecast period from 2024 to 2034, the market is expected to witness significant growth. New applications and technologies are likely to emerge, expanding the market opportunities for fiber reinforced polymer materials in areas such as biocomposites, digital manufacturing, and smart building solutions.

Rapid urbanization and population growth, particularly in emerging economies, will fuel the demand for affordable and sustainable housing solutions, creating opportunities for fiber reinforced polymer based construction systems and prefabricated building components.

Fiber Reinforced Polymer Panel and Sheet Market Key Drivers

Infrastructure development projects, particularly in emerging economies, are driving the demand for construction materials including fiber reinforced polymer panels and sheets. The need for durable, cost effective, and sustainable materials in infrastructure projects such as bridges, buildings, and transportation facilities presents significant growth opportunities for the fiber reinforced polymer market.

  • The demand for fiber reinforced polymer materials is expected to rise, as automotive manufacturers and aerospace companies seek to meet stringent regulations and consumer demand for fuel efficient and environmentally friendly vehicles.
  • There is a rising demand for building materials that offer thermal insulation properties, with a growing focus on energy efficiency and sustainability across industries. Fiber reinforced polymer panels and sheets can contribute to energy efficiency by providing effective thermal insulation, which is driving their adoption in the construction sector.
  • Fiber reinforced polymer panels and sheets exhibit excellent resistance to harsh environmental conditions such as extreme temperatures, humidity, and chemical exposure, which makes them ideal for applications in industries like chemical processing, wastewater treatment, and marine environments where traditional materials may degrade quickly.
Nikhil Kaitwade
Nikhil Kaitwade

Principal Consultant

Talk to Analyst

Find your sweet spots for generating winning opportunities in this market.

Challenges in the Fiber Reinforced Polymer Panel and Sheet Market

The initial investment costs associated with fiber reinforced polymer materials, including raw materials, manufacturing equipment, and specialized production processes, can be relatively high compared to traditional materials, which is expected to deter some potential customers, particularly in industries with limited capital or budget constraints.

  • There may be limited awareness and understanding among end users about the applications, performance characteristics, and long term advantages of fiber reinforced polymer panels and sheets, which can hinder market growth and adoption rates.
  • In some cases, there may be a perception among end users that fiber reinforced polymer materials are of inferior quality compared to traditional materials such as steel, aluminum, or concrete, which can impede market acceptance and adoption.
  • There may be concerns among end users about their long term performance, durability, and resistance of the fibers, to environmental factors such as UV exposure, moisture, and chemical corrosion.

Comparative View of Adjacent Industries

Future Market Insights has compared two other industries, advanced polymer composites market, and polyimide fibers market. Rapid urbanization and population growth in emerging economies are driving the demand for affordable and sustainable housing solutions.

Stringent regulations and standards related to environmental sustainability, safety, and fuel efficiency are driving the adoption of advanced polymer composites in various industries.

Polyimide fibers exhibit high strength to weight ratios, making them ideal for applications where lightweight materials with excellent mechanical properties are required. The fibers are commonly used in aerospace and automotive industries for components such as aircraft parts, automotive interiors, and lightweight structural reinforcements.

Fiber Reinforced Polymer Panel and Sheet Market:

Attributes Fiber Reinforced Polymer Panel and Sheet Market
CAGR from 2024 to 2034 5.9%
Key Trends
  • Fiber reinforced polymer panels and sheets offer cost effective solutions with high strength to weight ratios, making them suitable for transportation infrastructure projects.
  • Manufacturers are increasingly offering customizable fiber reinforced polymer panels and sheets with a wide range of colors, textures, and finishes to meet the aesthetic and design requirements of architects, designers, and end users.
Opportunity
  • Fiber reinforced polymer panels and sheets offer lightweight alternatives to traditional materials like steel and aluminum, enabling manufacturers to reduce vehicle weight without compromising on strength or safety.
  • Continued investment in research and development initiatives is driving innovation in fiber reinforced polymer materials, leading to the development of advanced composites with enhanced mechanical properties, fire resistance, and environmental sustainability.

Advanced Polymer Composites Market:

Attributes Advanced Polymer Composites Market
CAGR from 2022 to 2032 5.9%
Key Trends
  • Ongoing advancements in polymer chemistry, manufacturing processes, and composite materials technology are expanding the capabilities and performance characteristics of advanced polymer composites.
  • Advanced polymer composites offer significant weight savings compared to traditional materials like metal and concrete, making them attractive for structural components, interior parts, and exterior panels in vehicles and aircraft.
Opportunity
  • Infrastructure development projects, including bridges, roads, buildings, and energy facilities, are driving the demand for advanced polymer composites for structural reinforcement, corrosion protection, and seismic resilience.
  • The adoption of additive manufacturing technologies, particularly in the aerospace, automotive, and healthcare industries, is creating new opportunities for advanced polymer composites.

Polyimide Fibers Market:

Attributes Polyimide Fibers Market
CAGR from 2023 to 2033 5.4%
Key Trends
  • Polyimide fibers possess exceptional thermal stability and resistance to high temperatures, making them suitable for use in extreme environments.
  • Polyimide fibers demonstrate excellent resistance to a wide range of chemicals, including acids, bases, solvents, and fuels.
Opportunity

Get the data you need at a Fraction of the cost

Personalize your report by choosing insights you need
and save 40%!

Country-wise Insights

The below table showcases revenues in terms of the top 5 leading countries, spearheaded by Korea and Japan. The countries are expected to lead the market through 2034.

Countries Forecast CAGRs from 2024 to 2034
The United States 6.2%
China 6.4%
The United Kingdom 6.5%
Japan 7.2%
Korea 7.8%

Infrastructure Investment Driving the Market in the United States

The fiber reinforced polymer panel and sheet market in the United States expected to expand at a CAGR of 6.2% through 2034. Increased infrastructure investment by the government and private sectors in the country is driving the demand for durable and sustainable construction materials like fiber reinforced polymer panels and sheets.

The country is witnessing significant growth in renewable energy projects, including wind farms, solar power plants, and hydropower installations. Fiber reinforced polymer panels and sheets are used in renewable energy infrastructure for applications such as turbine blades, nacelles, solar panel enclosures, and hydroelectric components, driving market growth in the renewable energy sector.

Aerospace Manufacturing to Accelerate Market Growth in the United Kingdom

The fiber reinforced polymer panel and sheet market in the United Kingdom is anticipated to expand at a CAGR of 6.5% through 2034. The aerospace industry in the country is a significant consumer of fiber reinforced polymer panels and sheets for aircraft production.

The maritime industry in the country relies on fiber reinforced polymer panels and sheets for marine and naval applications, including boat building, shipbuilding, offshore platforms, and port infrastructure. Fiber reinforced polymer materials offer resistance to corrosion, UV degradation, and harsh marine environments, driving market growth in the marine sector.

Automotive Manufacturing Spearhead the Market in China

Fiber reinforced polymer panel and sheet trends in China are taking a turn for the better. A 6.4% CAGR is forecast for the country from 2024 to 2034. The country is the largest automotive market in the world, with increasing demand for lightweight and high performance materials in vehicle production.

Fiber reinforced polymer panels and sheets offer lightweight alternatives to traditional materials like steel and aluminum, enabling automakers to achieve weight reduction targets without compromising on safety or structural integrity.

Ongoing advancements in fiber reinforced polymer manufacturing technologies, resin formulations, and composite materials enhance product performance, quality, and cost effectiveness in China. Manufacturers are investing in research and development to develop innovative fiber reinforced polymer solutions that meet the evolving needs of customers and regulatory requirements in diverse industries.

Government Initiatives and Incentives Fueling the Market in Japan

The fiber reinforced polymer panel and sheet market in Japan is poised to expand at a CAGR of 7.2% through 2034. Government initiatives and incentives, such as subsidies, tax breaks, and funding for research and development, encourage the adoption of advanced materials like fiber reinforced polymer panels and sheets in Japan.

The incentives promote innovation, investment, and market growth in industries that utilize fiber reinforced polymer materials for infrastructure development, renewable energy projects, transportation, and manufacturing.

Increasing market expansion and collaboration among industry stakeholders, including manufacturers, suppliers, distributors, and end users, contribute to the growth of the fiber reinforced polymer panel and sheet market in Japan. Collaborative efforts to develop new applications, expand product offerings, and address customer needs drive market expansion and competitiveness in the industry.

Electronics Industry Demand Driving the Demand in Korea

The fiber reinforced polymer panel and sheet market in Korea is anticipated to expand at a CAGR of 7.8% through 2034. Korea is a leading hub for electronics manufacturing, including consumer electronics, semiconductors, and displays. Fiber reinforced polymer panels and sheets find applications in the electronics industry for components such as printed circuit boards, housing enclosures, and structural supports due to their lightweight, durable, and insulating properties.

Korea is investing in water and wastewater treatment infrastructure to address environmental concerns and ensure access to clean water. Fiber reinforced polymer panels and sheets are used in water treatment facilities for applications such as tanks, pipes, and structural supports due to their corrosion resistance and durability in harsh chemical environments.

Category-wise Insights

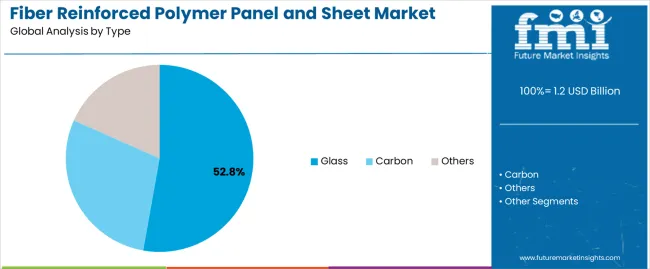
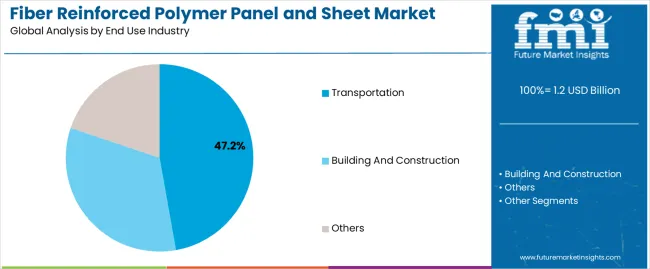
The below table highlights how glass segment is projected to lead the market in terms of fiber type, and is expected to account for a CAGR of 5.8% through 2034. Based on end user industry, the transportation segment is expected to account for a CAGR of 5.7% through 2034.

Category CAGR from 2024 to 2034
Glass 5.8%
Transportation 5.7%

Glass Claims High Demand for Fiber Reinforced Polymer Panel and Sheet

Based on fiber type, the glass segment is expected to continue dominating the fiber reinforced polymer panel and sheet market. Glass fibers offer excellent strength to weight ratios, making them ideal reinforcement materials for polymer matrices in fiber reinforced polymer panels and sheets.

Glass fibers exhibit excellent resistance to corrosion, moisture, and chemical exposure, making them suitable for use in harsh environmental conditions. Fiber reinforced polymer panels and sheets reinforced with glass fibers are commonly used in marine, automotive, chemical processing, and infrastructure applications where corrosion resistance is essential for long term performance.

Transportation Segment to Hold High Demand for Fiber Reinforced Polymer Panel and Sheet

In terms of end user industry, the transportation segment is expected to continue dominating the fiber reinforced polymer panel and sheet market. The transportation industry, including automotive, aerospace, and marine sectors, is increasingly focused on reducing vehicle weight to improve fuel efficiency and meet regulatory standards for emissions reduction.

Fiber reinforced polymer panels and sheets offer significant weight savings compared to traditional materials like steel, aluminum, and fiberglass, making them attractive for lightweighting applications in vehicles, aircraft, ships, and trains.

Fiber reinforced polymer panels and sheets reinforced with fibers such as glass, carbon, and aramid offer excellent strength to weight ratios, making them suitable for structural components and exterior body panels in transportation vehicles.
Competitive Landscape

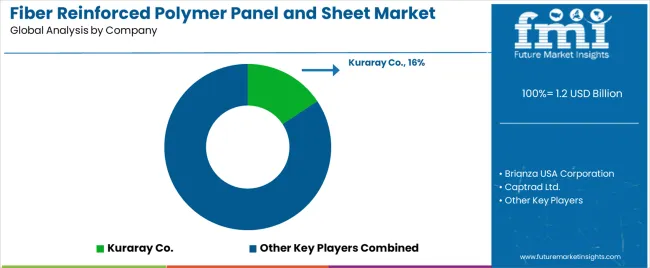
The competitive landscape of the fiber reinforced polymer panel and sheet market is characterized by a diverse array of players, ranging from multinational corporations to regional manufacturers and niche suppliers.

Competition within the fiber reinforced polymer panel and sheet market intensifies, as the demand for lightweight, durable, and sustainable construction materials continues to rise across various industries, driven by factors such as innovation, product differentiation, quality standards, and customer service.

Company Portfolio

  • Brianza USA Corporation specializes in the design, manufacturing, and distribution of fiber reinforced polymer panels and sheets for various industries such as construction, transportation, and marine applications. Their products offer durability, corrosion resistance, and design flexibility.
  • Captrad Ltd. is a United Kingdom based company that manufactures and supplies a wide range of fiber reinforced polymer panels and sheets for applications including architectural cladding, roofing systems, and industrial enclosures. Their offerings focus on high quality materials and customized solutions.

Report Scope

Attribute Details
Estimated Market Size in 2024 US$ 1.1 billion
Projected Market Valuation in 2034 US$ 1.9 billion
Value-based CAGR 2024 to 2034 5.9%
Forecast Period 2024 to 2034
Historical Data Available for 2019 to 2023
Market Analysis Value in US$ billion
Key Regions Covered
  • North America
  • Latin America
  • Western Europe
  • Eastern Europe
  • South Asia and Pacific
  • East Asia
  • The Middle East & Africa
Key Market Segments Covered
  • Fiber Type
  • End User Industry
  • Region
Key Countries Profiled
  • The United States
  • Canada
  • Brazil
  • Mexico
  • Germany
  • France
  • France
  • Spain
  • Italy
  • Russia
  • Poland
  • Czech Republic
  • Romania
  • India
  • Bangladesh
  • Australia
  • New Zealand
  • China
  • Japan
  • South Korea
  • GCC countries
  • South Africa
  • Israel
Key Companies Profiled
  • Brianza USA Corporation
  • Captrad Ltd.
  • Crane Composites Inc.
  • Dofrp (Miyabi FRP)
  • Hill & Smith Holdings PLC
  • Kal-Lite
  • Kalwall
  • Krempel GmbH
  • Panolam Industries International Inc.
  • Redwood Plastics and Rubber

Segmentation Analysis of the Fiber Reinforced Polymer Panel and Sheet Market

By Fiber Type:

  • Glass
  • Carbon
  • Others

By End Use Industry:

  • Transportation
  • Building and Construction
  • Others

By Region:

  • North America
  • Latin America
  • Western Europe
  • Eastern Europe
  • South Asia and Pacific
  • East Asia
  • The Middle East and Africa

Frequently Asked Questions

What is the anticipated value of the Fiber Reinforced Polymer Panel and Sheet market in 2024?

The fiber reinforced polymer panel and sheet market is projected to reach a valuation of US$ 1.1 billion in 2024.

What is the expected CAGR for the Fiber Reinforced Polymer Panel and Sheet market until 2034?

The fiber reinforced polymer panel and sheet industry is set to expand by a CAGR of 5.9% through 2034.

How much valuation is projected for the Fiber Reinforced Polymer Panel and Sheet market in 2034?

The fiber reinforced polymer panel and sheet market is forecast to reach US$ 1.9 billion by 2034.

Which country is projected to lead the Fiber Reinforced Polymer Panel and Sheet market?

Korea is expected to be the top performing market, exhibiting a CAGR of 7.8% through 2034.

Which is the dominant fiber type in the Fiber Reinforced Polymer Panel and Sheet domain?

Glass segment is preferred, and is expected to account for a CAGR of 5.8% through 2034.

Table of Content

1. Executive Summary

    1.1. Global Market Outlook

    1.2. Demand-side Trends

    1.3. Supply-side Trends

    1.4. Technology Roadmap Analysis

    1.5. Analysis and Recommendations

2. Market Overview

    2.1. Market Coverage / Taxonomy

    2.2. Market Definition / Scope / Limitations

3. Market Background

    3.1. Market Dynamics

        3.1.1. Drivers

        3.1.2. Restraints

        3.1.3. Opportunity

        3.1.4. Trends

    3.2. Scenario Forecast

        3.2.1. Demand in Optimistic Scenario

        3.2.2. Demand in Likely Scenario

        3.2.3. Demand in Conservative Scenario

    3.3. Opportunity Map Analysis

    3.4. Product Life Cycle Analysis

    3.5. Supply Chain Analysis

        3.5.1. Supply Side Participants and their Roles

            3.5.1.1. Producers

            3.5.1.2. Mid-Level Participants (Traders/ Agents/ Brokers)

            3.5.1.3. Wholesalers and Distributors

        3.5.2. Value Added and Value Created at Node in the Supply Chain

        3.5.3. List of Raw Material Suppliers

        3.5.4. List of Existing and Potential Buyer’s

    3.6. Investment Feasibility Matrix

    3.7. Value Chain Analysis

        3.7.1. Profit Margin Analysis

        3.7.2. Wholesalers and Distributors

        3.7.3. Retailers

    3.8. PESTLE and Porter’s Analysis

    3.9. Regulatory Landscape

        3.9.1. By Key Regions

        3.9.2. By Key Countries

    3.10. Regional Parent Market Outlook

    3.11. Production and Consumption Statistics

    3.12. Import and Export Statistics

4. Global Market Analysis 2019 to 2023 and Forecast, 2024 to 2034

    4.1. Historical Market Size Value (US$ Million) & Volume (Square Feet) Analysis, 2019 to 2023

    4.2. Current and Future Market Size Value (US$ Million) & Volume (Square Feet) Projections, 2024 to 2034

        4.2.1. Y-o-Y Growth Trend Analysis

        4.2.2. Absolute $ Opportunity Analysis

5. Global Market Analysis 2019 to 2023 and Forecast 2024 to 2034, By Fiber Type

    5.1. Introduction / Key Findings

    5.2. Historical Market Size Value (US$ Million) & Volume (Square Feet) Analysis By Fiber Type, 2019 to 2023

    5.3. Current and Future Market Size Value (US$ Million) & Volume (Square Feet) Analysis and Forecast By Fiber Type, 2024 to 2034

        5.3.1. Glass

        5.3.2. Carbon

        5.3.3. Others

    5.4. Y-o-Y Growth Trend Analysis By Fiber Type, 2019 to 2023

    5.5. Absolute $ Opportunity Analysis By Fiber Type, 2024 to 2034

6. Global Market Analysis 2019 to 2023 and Forecast 2024 to 2034, By End-user Industry

    6.1. Introduction / Key Findings

    6.2. Historical Market Size Value (US$ Million) & Volume (Square Feet) Analysis By End-user Industry, 2019 to 2023

    6.3. Current and Future Market Size Value (US$ Million) & Volume (Square Feet) Analysis and Forecast By End-user Industry, 2024 to 2034

        6.3.1. Transportation

        6.3.2. Building & Construction

        6.3.3. Others

    6.4. Y-o-Y Growth Trend Analysis By End-user Industry, 2019 to 2023

    6.5. Absolute $ Opportunity Analysis By End-user Industry, 2024 to 2034

7. Global Market Analysis 2019 to 2023 and Forecast 2024 to 2034, By Region

    7.1. Introduction

    7.2. Historical Market Size Value (US$ Million) & Volume (Square Feet) Analysis By Region, 2019 to 2023

    7.3. Current Market Size Value (US$ Million) & Volume (Square Feet) Analysis and Forecast By Region, 2024 to 2034

        7.3.1. North America

        7.3.2. Latin America

        7.3.3. Western Europe

        7.3.4. Eastern Europe

        7.3.5. South Asia and Pacific

        7.3.6. East Asia

        7.3.7. Middle East and Africa

    7.4. Market Attractiveness Analysis By Region

8. North America Market Analysis 2019 to 2023 and Forecast 2024 to 2034, By Country

    8.1. Historical Market Size Value (US$ Million) & Volume (Square Feet) Trend Analysis By Market Taxonomy, 2019 to 2023

    8.2. Market Size Value (US$ Million) & Volume (Square Feet) Forecast By Market Taxonomy, 2024 to 2034

        8.2.1. By Country

            8.2.1.1. USA

            8.2.1.2. Canada

        8.2.2. By Fiber Type

        8.2.3. By End-user Industry

    8.3. Market Attractiveness Analysis

        8.3.1. By Country

        8.3.2. By Fiber Type

        8.3.3. By End-user Industry

    8.4. Key Takeaways

9. Latin America Market Analysis 2019 to 2023 and Forecast 2024 to 2034, By Country

    9.1. Historical Market Size Value (US$ Million) & Volume (Square Feet) Trend Analysis By Market Taxonomy, 2019 to 2023

    9.2. Market Size Value (US$ Million) & Volume (Square Feet) Forecast By Market Taxonomy, 2024 to 2034

        9.2.1. By Country

            9.2.1.1. Brazil

            9.2.1.2. Mexico

            9.2.1.3. Rest of Latin America

        9.2.2. By Fiber Type

        9.2.3. By End-user Industry

    9.3. Market Attractiveness Analysis

        9.3.1. By Country

        9.3.2. By Fiber Type

        9.3.3. By End-user Industry

    9.4. Key Takeaways

10. Western Europe Market Analysis 2019 to 2023 and Forecast 2024 to 2034, By Country

    10.1. Historical Market Size Value (US$ Million) & Volume (Square Feet) Trend Analysis By Market Taxonomy, 2019 to 2023

    10.2. Market Size Value (US$ Million) & Volume (Square Feet) Forecast By Market Taxonomy, 2024 to 2034

        10.2.1. By Country

            10.2.1.1. Germany

            10.2.1.2. UK

            10.2.1.3. France

            10.2.1.4. Spain

            10.2.1.5. Italy

            10.2.1.6. Rest of Western Europe

        10.2.2. By Fiber Type

        10.2.3. By End-user Industry

    10.3. Market Attractiveness Analysis

        10.3.1. By Country

        10.3.2. By Fiber Type

        10.3.3. By End-user Industry

    10.4. Key Takeaways

11. Eastern Europe Market Analysis 2019 to 2023 and Forecast 2024 to 2034, By Country

    11.1. Historical Market Size Value (US$ Million) & Volume (Square Feet) Trend Analysis By Market Taxonomy, 2019 to 2023

    11.2. Market Size Value (US$ Million) & Volume (Square Feet) Forecast By Market Taxonomy, 2024 to 2034

        11.2.1. By Country

            11.2.1.1. Poland

            11.2.1.2. Russia

            11.2.1.3. Czech Republic

            11.2.1.4. Romania

            11.2.1.5. Rest of Eastern Europe

        11.2.2. By Fiber Type

        11.2.3. By End-user Industry

    11.3. Market Attractiveness Analysis

        11.3.1. By Country

        11.3.2. By Fiber Type

        11.3.3. By End-user Industry

    11.4. Key Takeaways

12. South Asia and Pacific Market Analysis 2019 to 2023 and Forecast 2024 to 2034, By Country

    12.1. Historical Market Size Value (US$ Million) & Volume (Square Feet) Trend Analysis By Market Taxonomy, 2019 to 2023

    12.2. Market Size Value (US$ Million) & Volume (Square Feet) Forecast By Market Taxonomy, 2024 to 2034

        12.2.1. By Country

            12.2.1.1. India

            12.2.1.2. Bangladesh

            12.2.1.3. Australia

            12.2.1.4. New Zealand

            12.2.1.5. Rest of South Asia and Pacific

        12.2.2. By Fiber Type

        12.2.3. By End-user Industry

    12.3. Market Attractiveness Analysis

        12.3.1. By Country

        12.3.2. By Fiber Type

        12.3.3. By End-user Industry

    12.4. Key Takeaways

13. East Asia Market Analysis 2019 to 2023 and Forecast 2024 to 2034, By Country

    13.1. Historical Market Size Value (US$ Million) & Volume (Square Feet) Trend Analysis By Market Taxonomy, 2019 to 2023

    13.2. Market Size Value (US$ Million) & Volume (Square Feet) Forecast By Market Taxonomy, 2024 to 2034

        13.2.1. By Country

            13.2.1.1. China

            13.2.1.2. Japan

            13.2.1.3. South Korea

        13.2.2. By Fiber Type

        13.2.3. By End-user Industry

    13.3. Market Attractiveness Analysis

        13.3.1. By Country

        13.3.2. By Fiber Type

        13.3.3. By End-user Industry

    13.4. Key Takeaways

14. Middle East and Africa Market Analysis 2019 to 2023 and Forecast 2024 to 2034, By Country

    14.1. Historical Market Size Value (US$ Million) & Volume (Square Feet) Trend Analysis By Market Taxonomy, 2019 to 2023

    14.2. Market Size Value (US$ Million) & Volume (Square Feet) Forecast By Market Taxonomy, 2024 to 2034

        14.2.1. By Country

            14.2.1.1. GCC Countries

            14.2.1.2. South Africa

            14.2.1.3. Israel

            14.2.1.4. Rest of MEA

        14.2.2. By Fiber Type

        14.2.3. By End-user Industry

    14.3. Market Attractiveness Analysis

        14.3.1. By Country

        14.3.2. By Fiber Type

        14.3.3. By End-user Industry

    14.4. Key Takeaways

15. Key Countries Market Analysis

    15.1. USA

        15.1.1. Pricing Analysis

        15.1.2. Market Share Analysis, 2023

            15.1.2.1. By Fiber Type

            15.1.2.2. By End-user Industry

    15.2. Canada

        15.2.1. Pricing Analysis

        15.2.2. Market Share Analysis, 2023

            15.2.2.1. By Fiber Type

            15.2.2.2. By End-user Industry

    15.3. Brazil

        15.3.1. Pricing Analysis

        15.3.2. Market Share Analysis, 2023

            15.3.2.1. By Fiber Type

            15.3.2.2. By End-user Industry

    15.4. Mexico

        15.4.1. Pricing Analysis

        15.4.2. Market Share Analysis, 2023

            15.4.2.1. By Fiber Type

            15.4.2.2. By End-user Industry

    15.5. Germany

        15.5.1. Pricing Analysis

        15.5.2. Market Share Analysis, 2023

            15.5.2.1. By Fiber Type

            15.5.2.2. By End-user Industry

    15.6. UK

        15.6.1. Pricing Analysis

        15.6.2. Market Share Analysis, 2023

            15.6.2.1. By Fiber Type

            15.6.2.2. By End-user Industry

    15.7. France

        15.7.1. Pricing Analysis

        15.7.2. Market Share Analysis, 2023

            15.7.2.1. By Fiber Type

            15.7.2.2. By End-user Industry

    15.8. Spain

        15.8.1. Pricing Analysis

        15.8.2. Market Share Analysis, 2023

            15.8.2.1. By Fiber Type

            15.8.2.2. By End-user Industry

    15.9. Italy

        15.9.1. Pricing Analysis

        15.9.2. Market Share Analysis, 2023

            15.9.2.1. By Fiber Type

            15.9.2.2. By End-user Industry

    15.10. Poland

        15.10.1. Pricing Analysis

        15.10.2. Market Share Analysis, 2023

            15.10.2.1. By Fiber Type

            15.10.2.2. By End-user Industry

    15.11. Russia

        15.11.1. Pricing Analysis

        15.11.2. Market Share Analysis, 2023

            15.11.2.1. By Fiber Type

            15.11.2.2. By End-user Industry

    15.12. Czech Republic

        15.12.1. Pricing Analysis

        15.12.2. Market Share Analysis, 2023

            15.12.2.1. By Fiber Type

            15.12.2.2. By End-user Industry

    15.13. Romania

        15.13.1. Pricing Analysis

        15.13.2. Market Share Analysis, 2023

            15.13.2.1. By Fiber Type

            15.13.2.2. By End-user Industry

    15.14. India

        15.14.1. Pricing Analysis

        15.14.2. Market Share Analysis, 2023

            15.14.2.1. By Fiber Type

            15.14.2.2. By End-user Industry

    15.15. Bangladesh

        15.15.1. Pricing Analysis

        15.15.2. Market Share Analysis, 2023

            15.15.2.1. By Fiber Type

            15.15.2.2. By End-user Industry

    15.16. Australia

        15.16.1. Pricing Analysis

        15.16.2. Market Share Analysis, 2023

            15.16.2.1. By Fiber Type

            15.16.2.2. By End-user Industry

    15.17. New Zealand

        15.17.1. Pricing Analysis

        15.17.2. Market Share Analysis, 2023

            15.17.2.1. By Fiber Type

            15.17.2.2. By End-user Industry

    15.18. China

        15.18.1. Pricing Analysis

        15.18.2. Market Share Analysis, 2023

            15.18.2.1. By Fiber Type

            15.18.2.2. By End-user Industry

    15.19. Japan

        15.19.1. Pricing Analysis

        15.19.2. Market Share Analysis, 2023

            15.19.2.1. By Fiber Type

            15.19.2.2. By End-user Industry

    15.20. South Korea

        15.20.1. Pricing Analysis

        15.20.2. Market Share Analysis, 2023

            15.20.2.1. By Fiber Type

            15.20.2.2. By End-user Industry

    15.21. GCC Countries

        15.21.1. Pricing Analysis

        15.21.2. Market Share Analysis, 2023

            15.21.2.1. By Fiber Type

            15.21.2.2. By End-user Industry

    15.22. South Africa

        15.22.1. Pricing Analysis

        15.22.2. Market Share Analysis, 2023

            15.22.2.1. By Fiber Type

            15.22.2.2. By End-user Industry

    15.23. Israel

        15.23.1. Pricing Analysis

        15.23.2. Market Share Analysis, 2023

            15.23.2.1. By Fiber Type

            15.23.2.2. By End-user Industry

16. Market Structure Analysis

    16.1. Competition Dashboard

    16.2. Competition Benchmarking

    16.3. Market Share Analysis of Top Players

        16.3.1. By Regional

        16.3.2. By Fiber Type

        16.3.3. By End-user Industry

17. Competition Analysis

    17.1. Competition Deep Dive

        17.1.1. Brianza USA Corporation

            17.1.1.1. Overview

            17.1.1.2. Product Portfolio

            17.1.1.3. Profitability by Market Segments

            17.1.1.4. Sales Footprint

            17.1.1.5. Strategy Overview

                17.1.1.5.1. Marketing Strategy

                17.1.1.5.2. Product Strategy

                17.1.1.5.3. Channel Strategy

        17.1.2. Captrad Ltd

            17.1.2.1. Overview

            17.1.2.2. Product Portfolio

            17.1.2.3. Profitability by Market Segments

            17.1.2.4. Sales Footprint

            17.1.2.5. Strategy Overview

                17.1.2.5.1. Marketing Strategy

                17.1.2.5.2. Product Strategy

                17.1.2.5.3. Channel Strategy

        17.1.3. Crane Composites, Inc. (Crane CO.)

            17.1.3.1. Overview

            17.1.3.2. Product Portfolio

            17.1.3.3. Profitability by Market Segments

            17.1.3.4. Sales Footprint

            17.1.3.5. Strategy Overview

                17.1.3.5.1. Marketing Strategy

                17.1.3.5.2. Product Strategy

                17.1.3.5.3. Channel Strategy

        17.1.4. Dofrp (Miyabi FRP)

            17.1.4.1. Overview

            17.1.4.2. Product Portfolio

            17.1.4.3. Profitability by Market Segments

            17.1.4.4. Sales Footprint

            17.1.4.5. Strategy Overview

                17.1.4.5.1. Marketing Strategy

                17.1.4.5.2. Product Strategy

                17.1.4.5.3. Channel Strategy

        17.1.5. Hill & Smith Holdings PLC

            17.1.5.1. Overview

            17.1.5.2. Product Portfolio

            17.1.5.3. Profitability by Market Segments

            17.1.5.4. Sales Footprint

            17.1.5.5. Strategy Overview

                17.1.5.5.1. Marketing Strategy

                17.1.5.5.2. Product Strategy

                17.1.5.5.3. Channel Strategy

        17.1.6. Kal-Lite

            17.1.6.1. Overview

            17.1.6.2. Product Portfolio

            17.1.6.3. Profitability by Market Segments

            17.1.6.4. Sales Footprint

            17.1.6.5. Strategy Overview

                17.1.6.5.1. Marketing Strategy

                17.1.6.5.2. Product Strategy

                17.1.6.5.3. Channel Strategy

        17.1.7. Kalwall

            17.1.7.1. Overview

            17.1.7.2. Product Portfolio

            17.1.7.3. Profitability by Market Segments

            17.1.7.4. Sales Footprint

            17.1.7.5. Strategy Overview

                17.1.7.5.1. Marketing Strategy

                17.1.7.5.2. Product Strategy

                17.1.7.5.3. Channel Strategy

        17.1.8. Krempel GmbH

            17.1.8.1. Overview

            17.1.8.2. Product Portfolio

            17.1.8.3. Profitability by Market Segments

            17.1.8.4. Sales Footprint

            17.1.8.5. Strategy Overview

                17.1.8.5.1. Marketing Strategy

                17.1.8.5.2. Product Strategy

                17.1.8.5.3. Channel Strategy

        17.1.9. Panolam Industries International, Inc.

            17.1.9.1. Overview

            17.1.9.2. Product Portfolio

            17.1.9.3. Profitability by Market Segments

            17.1.9.4. Sales Footprint

            17.1.9.5. Strategy Overview

                17.1.9.5.1. Marketing Strategy

                17.1.9.5.2. Product Strategy

                17.1.9.5.3. Channel Strategy

        17.1.10. Redwood Plastics and Rubber

            17.1.10.1. Overview

            17.1.10.2. Product Portfolio

            17.1.10.3. Profitability by Market Segments

            17.1.10.4. Sales Footprint

            17.1.10.5. Strategy Overview

                17.1.10.5.1. Marketing Strategy

                17.1.10.5.2. Product Strategy

                17.1.10.5.3. Channel Strategy

18. Assumptions & Acronyms Used

19. Research Methodology

List of Tables

Table 1: Global Market Value (US$ Million) Forecast by Region, 2019 to 2034

Table 2: Global Market Volume (Square Feet) Forecast by Region, 2019 to 2034

Table 3: Global Market Value (US$ Million) Forecast by Fiber Type, 2019 to 2034

Table 4: Global Market Volume (Square Feet) Forecast by Fiber Type, 2019 to 2034

Table 5: Global Market Value (US$ Million) Forecast by End-user Industry, 2019 to 2034

Table 6: Global Market Volume (Square Feet) Forecast by End-user Industry, 2019 to 2034

Table 7: North America Market Value (US$ Million) Forecast by Country, 2019 to 2034

Table 8: North America Market Volume (Square Feet) Forecast by Country, 2019 to 2034

Table 9: North America Market Value (US$ Million) Forecast by Fiber Type, 2019 to 2034

Table 10: North America Market Volume (Square Feet) Forecast by Fiber Type, 2019 to 2034

Table 11: North America Market Value (US$ Million) Forecast by End-user Industry, 2019 to 2034

Table 12: North America Market Volume (Square Feet) Forecast by End-user Industry, 2019 to 2034

Table 13: Latin America Market Value (US$ Million) Forecast by Country, 2019 to 2034

Table 14: Latin America Market Volume (Square Feet) Forecast by Country, 2019 to 2034

Table 15: Latin America Market Value (US$ Million) Forecast by Fiber Type, 2019 to 2034

Table 16: Latin America Market Volume (Square Feet) Forecast by Fiber Type, 2019 to 2034

Table 17: Latin America Market Value (US$ Million) Forecast by End-user Industry, 2019 to 2034

Table 18: Latin America Market Volume (Square Feet) Forecast by End-user Industry, 2019 to 2034

Table 19: Western Europe Market Value (US$ Million) Forecast by Country, 2019 to 2034

Table 20: Western Europe Market Volume (Square Feet) Forecast by Country, 2019 to 2034

Table 21: Western Europe Market Value (US$ Million) Forecast by Fiber Type, 2019 to 2034

Table 22: Western Europe Market Volume (Square Feet) Forecast by Fiber Type, 2019 to 2034

Table 23: Western Europe Market Value (US$ Million) Forecast by End-user Industry, 2019 to 2034

Table 24: Western Europe Market Volume (Square Feet) Forecast by End-user Industry, 2019 to 2034

Table 25: Eastern Europe Market Value (US$ Million) Forecast by Country, 2019 to 2034

Table 26: Eastern Europe Market Volume (Square Feet) Forecast by Country, 2019 to 2034

Table 27: Eastern Europe Market Value (US$ Million) Forecast by Fiber Type, 2019 to 2034

Table 28: Eastern Europe Market Volume (Square Feet) Forecast by Fiber Type, 2019 to 2034

Table 29: Eastern Europe Market Value (US$ Million) Forecast by End-user Industry, 2019 to 2034

Table 30: Eastern Europe Market Volume (Square Feet) Forecast by End-user Industry, 2019 to 2034

Table 31: South Asia and Pacific Market Value (US$ Million) Forecast by Country, 2019 to 2034

Table 32: South Asia and Pacific Market Volume (Square Feet) Forecast by Country, 2019 to 2034

Table 33: South Asia and Pacific Market Value (US$ Million) Forecast by Fiber Type, 2019 to 2034

Table 34: South Asia and Pacific Market Volume (Square Feet) Forecast by Fiber Type, 2019 to 2034

Table 35: South Asia and Pacific Market Value (US$ Million) Forecast by End-user Industry, 2019 to 2034

Table 36: South Asia and Pacific Market Volume (Square Feet) Forecast by End-user Industry, 2019 to 2034

Table 37: East Asia Market Value (US$ Million) Forecast by Country, 2019 to 2034

Table 38: East Asia Market Volume (Square Feet) Forecast by Country, 2019 to 2034

Table 39: East Asia Market Value (US$ Million) Forecast by Fiber Type, 2019 to 2034

Table 40: East Asia Market Volume (Square Feet) Forecast by Fiber Type, 2019 to 2034

Table 41: East Asia Market Value (US$ Million) Forecast by End-user Industry, 2019 to 2034

Table 42: East Asia Market Volume (Square Feet) Forecast by End-user Industry, 2019 to 2034

Table 43: Middle East and Africa Market Value (US$ Million) Forecast by Country, 2019 to 2034

Table 44: Middle East and Africa Market Volume (Square Feet) Forecast by Country, 2019 to 2034

Table 45: Middle East and Africa Market Value (US$ Million) Forecast by Fiber Type, 2019 to 2034

Table 46: Middle East and Africa Market Volume (Square Feet) Forecast by Fiber Type, 2019 to 2034

Table 47: Middle East and Africa Market Value (US$ Million) Forecast by End-user Industry, 2019 to 2034

Table 48: Middle East and Africa Market Volume (Square Feet) Forecast by End-user Industry, 2019 to 2034

List of Charts

Figure 1: Global Market Value (US$ Million) by Fiber Type, 2024 to 2034

Figure 2: Global Market Value (US$ Million) by End-user Industry, 2024 to 2034

Figure 3: Global Market Value (US$ Million) by Region, 2024 to 2034

Figure 4: Global Market Value (US$ Million) Analysis by Region, 2019 to 2034

Figure 5: Global Market Volume (Square Feet) Analysis by Region, 2019 to 2034

Figure 6: Global Market Value Share (%) and BPS Analysis by Region, 2024 to 2034

Figure 7: Global Market Y-o-Y Growth (%) Projections by Region, 2024 to 2034

Figure 8: Global Market Value (US$ Million) Analysis by Fiber Type, 2019 to 2034

Figure 9: Global Market Volume (Square Feet) Analysis by Fiber Type, 2019 to 2034

Figure 10: Global Market Value Share (%) and BPS Analysis by Fiber Type, 2024 to 2034

Figure 11: Global Market Y-o-Y Growth (%) Projections by Fiber Type, 2024 to 2034

Figure 12: Global Market Value (US$ Million) Analysis by End-user Industry, 2019 to 2034

Figure 13: Global Market Volume (Square Feet) Analysis by End-user Industry, 2019 to 2034

Figure 14: Global Market Value Share (%) and BPS Analysis by End-user Industry, 2024 to 2034

Figure 15: Global Market Y-o-Y Growth (%) Projections by End-user Industry, 2024 to 2034

Figure 16: Global Market Attractiveness by Fiber Type, 2024 to 2034

Figure 17: Global Market Attractiveness by End-user Industry, 2024 to 2034

Figure 18: Global Market Attractiveness by Region, 2024 to 2034

Figure 19: North America Market Value (US$ Million) by Fiber Type, 2024 to 2034

Figure 20: North America Market Value (US$ Million) by End-user Industry, 2024 to 2034

Figure 21: North America Market Value (US$ Million) by Country, 2024 to 2034

Figure 22: North America Market Value (US$ Million) Analysis by Country, 2019 to 2034

Figure 23: North America Market Volume (Square Feet) Analysis by Country, 2019 to 2034

Figure 24: North America Market Value Share (%) and BPS Analysis by Country, 2024 to 2034

Figure 25: North America Market Y-o-Y Growth (%) Projections by Country, 2024 to 2034

Figure 26: North America Market Value (US$ Million) Analysis by Fiber Type, 2019 to 2034

Figure 27: North America Market Volume (Square Feet) Analysis by Fiber Type, 2019 to 2034

Figure 28: North America Market Value Share (%) and BPS Analysis by Fiber Type, 2024 to 2034

Figure 29: North America Market Y-o-Y Growth (%) Projections by Fiber Type, 2024 to 2034

Figure 30: North America Market Value (US$ Million) Analysis by End-user Industry, 2019 to 2034

Figure 31: North America Market Volume (Square Feet) Analysis by End-user Industry, 2019 to 2034

Figure 32: North America Market Value Share (%) and BPS Analysis by End-user Industry, 2024 to 2034

Figure 33: North America Market Y-o-Y Growth (%) Projections by End-user Industry, 2024 to 2034

Figure 34: North America Market Attractiveness by Fiber Type, 2024 to 2034

Figure 35: North America Market Attractiveness by End-user Industry, 2024 to 2034

Figure 36: North America Market Attractiveness by Country, 2024 to 2034

Figure 37: Latin America Market Value (US$ Million) by Fiber Type, 2024 to 2034

Figure 38: Latin America Market Value (US$ Million) by End-user Industry, 2024 to 2034

Figure 39: Latin America Market Value (US$ Million) by Country, 2024 to 2034

Figure 40: Latin America Market Value (US$ Million) Analysis by Country, 2019 to 2034

Figure 41: Latin America Market Volume (Square Feet) Analysis by Country, 2019 to 2034

Figure 42: Latin America Market Value Share (%) and BPS Analysis by Country, 2024 to 2034

Figure 43: Latin America Market Y-o-Y Growth (%) Projections by Country, 2024 to 2034

Figure 44: Latin America Market Value (US$ Million) Analysis by Fiber Type, 2019 to 2034

Figure 45: Latin America Market Volume (Square Feet) Analysis by Fiber Type, 2019 to 2034

Figure 46: Latin America Market Value Share (%) and BPS Analysis by Fiber Type, 2024 to 2034

Figure 47: Latin America Market Y-o-Y Growth (%) Projections by Fiber Type, 2024 to 2034

Figure 48: Latin America Market Value (US$ Million) Analysis by End-user Industry, 2019 to 2034

Figure 49: Latin America Market Volume (Square Feet) Analysis by End-user Industry, 2019 to 2034

Figure 50: Latin America Market Value Share (%) and BPS Analysis by End-user Industry, 2024 to 2034

Figure 51: Latin America Market Y-o-Y Growth (%) Projections by End-user Industry, 2024 to 2034

Figure 52: Latin America Market Attractiveness by Fiber Type, 2024 to 2034

Figure 53: Latin America Market Attractiveness by End-user Industry, 2024 to 2034

Figure 54: Latin America Market Attractiveness by Country, 2024 to 2034

Figure 55: Western Europe Market Value (US$ Million) by Fiber Type, 2024 to 2034

Figure 56: Western Europe Market Value (US$ Million) by End-user Industry, 2024 to 2034

Figure 57: Western Europe Market Value (US$ Million) by Country, 2024 to 2034

Figure 58: Western Europe Market Value (US$ Million) Analysis by Country, 2019 to 2034

Figure 59: Western Europe Market Volume (Square Feet) Analysis by Country, 2019 to 2034

Figure 60: Western Europe Market Value Share (%) and BPS Analysis by Country, 2024 to 2034

Figure 61: Western Europe Market Y-o-Y Growth (%) Projections by Country, 2024 to 2034

Figure 62: Western Europe Market Value (US$ Million) Analysis by Fiber Type, 2019 to 2034

Figure 63: Western Europe Market Volume (Square Feet) Analysis by Fiber Type, 2019 to 2034

Figure 64: Western Europe Market Value Share (%) and BPS Analysis by Fiber Type, 2024 to 2034

Figure 65: Western Europe Market Y-o-Y Growth (%) Projections by Fiber Type, 2024 to 2034

Figure 66: Western Europe Market Value (US$ Million) Analysis by End-user Industry, 2019 to 2034

Figure 67: Western Europe Market Volume (Square Feet) Analysis by End-user Industry, 2019 to 2034

Figure 68: Western Europe Market Value Share (%) and BPS Analysis by End-user Industry, 2024 to 2034

Figure 69: Western Europe Market Y-o-Y Growth (%) Projections by End-user Industry, 2024 to 2034

Figure 70: Western Europe Market Attractiveness by Fiber Type, 2024 to 2034

Figure 71: Western Europe Market Attractiveness by End-user Industry, 2024 to 2034

Figure 72: Western Europe Market Attractiveness by Country, 2024 to 2034

Figure 73: Eastern Europe Market Value (US$ Million) by Fiber Type, 2024 to 2034

Figure 74: Eastern Europe Market Value (US$ Million) by End-user Industry, 2024 to 2034

Figure 75: Eastern Europe Market Value (US$ Million) by Country, 2024 to 2034

Figure 76: Eastern Europe Market Value (US$ Million) Analysis by Country, 2019 to 2034

Figure 77: Eastern Europe Market Volume (Square Feet) Analysis by Country, 2019 to 2034

Figure 78: Eastern Europe Market Value Share (%) and BPS Analysis by Country, 2024 to 2034

Figure 79: Eastern Europe Market Y-o-Y Growth (%) Projections by Country, 2024 to 2034

Figure 80: Eastern Europe Market Value (US$ Million) Analysis by Fiber Type, 2019 to 2034

Figure 81: Eastern Europe Market Volume (Square Feet) Analysis by Fiber Type, 2019 to 2034

Figure 82: Eastern Europe Market Value Share (%) and BPS Analysis by Fiber Type, 2024 to 2034

Figure 83: Eastern Europe Market Y-o-Y Growth (%) Projections by Fiber Type, 2024 to 2034

Figure 84: Eastern Europe Market Value (US$ Million) Analysis by End-user Industry, 2019 to 2034

Figure 85: Eastern Europe Market Volume (Square Feet) Analysis by End-user Industry, 2019 to 2034

Figure 86: Eastern Europe Market Value Share (%) and BPS Analysis by End-user Industry, 2024 to 2034

Figure 87: Eastern Europe Market Y-o-Y Growth (%) Projections by End-user Industry, 2024 to 2034

Figure 88: Eastern Europe Market Attractiveness by Fiber Type, 2024 to 2034

Figure 89: Eastern Europe Market Attractiveness by End-user Industry, 2024 to 2034

Figure 90: Eastern Europe Market Attractiveness by Country, 2024 to 2034

Figure 91: South Asia and Pacific Market Value (US$ Million) by Fiber Type, 2024 to 2034

Figure 92: South Asia and Pacific Market Value (US$ Million) by End-user Industry, 2024 to 2034

Figure 93: South Asia and Pacific Market Value (US$ Million) by Country, 2024 to 2034

Figure 94: South Asia and Pacific Market Value (US$ Million) Analysis by Country, 2019 to 2034

Figure 95: South Asia and Pacific Market Volume (Square Feet) Analysis by Country, 2019 to 2034

Figure 96: South Asia and Pacific Market Value Share (%) and BPS Analysis by Country, 2024 to 2034

Figure 97: South Asia and Pacific Market Y-o-Y Growth (%) Projections by Country, 2024 to 2034

Figure 98: South Asia and Pacific Market Value (US$ Million) Analysis by Fiber Type, 2019 to 2034

Figure 99: South Asia and Pacific Market Volume (Square Feet) Analysis by Fiber Type, 2019 to 2034

Figure 100: South Asia and Pacific Market Value Share (%) and BPS Analysis by Fiber Type, 2024 to 2034

Figure 101: South Asia and Pacific Market Y-o-Y Growth (%) Projections by Fiber Type, 2024 to 2034

Figure 102: South Asia and Pacific Market Value (US$ Million) Analysis by End-user Industry, 2019 to 2034

Figure 103: South Asia and Pacific Market Volume (Square Feet) Analysis by End-user Industry, 2019 to 2034

Figure 104: South Asia and Pacific Market Value Share (%) and BPS Analysis by End-user Industry, 2024 to 2034

Figure 105: South Asia and Pacific Market Y-o-Y Growth (%) Projections by End-user Industry, 2024 to 2034

Figure 106: South Asia and Pacific Market Attractiveness by Fiber Type, 2024 to 2034

Figure 107: South Asia and Pacific Market Attractiveness by End-user Industry, 2024 to 2034

Figure 108: South Asia and Pacific Market Attractiveness by Country, 2024 to 2034

Figure 109: East Asia Market Value (US$ Million) by Fiber Type, 2024 to 2034

Figure 110: East Asia Market Value (US$ Million) by End-user Industry, 2024 to 2034

Figure 111: East Asia Market Value (US$ Million) by Country, 2024 to 2034

Figure 112: East Asia Market Value (US$ Million) Analysis by Country, 2019 to 2034

Figure 113: East Asia Market Volume (Square Feet) Analysis by Country, 2019 to 2034

Figure 114: East Asia Market Value Share (%) and BPS Analysis by Country, 2024 to 2034

Figure 115: East Asia Market Y-o-Y Growth (%) Projections by Country, 2024 to 2034

Figure 116: East Asia Market Value (US$ Million) Analysis by Fiber Type, 2019 to 2034

Figure 117: East Asia Market Volume (Square Feet) Analysis by Fiber Type, 2019 to 2034

Figure 118: East Asia Market Value Share (%) and BPS Analysis by Fiber Type, 2024 to 2034

Figure 119: East Asia Market Y-o-Y Growth (%) Projections by Fiber Type, 2024 to 2034

Figure 120: East Asia Market Value (US$ Million) Analysis by End-user Industry, 2019 to 2034

Figure 121: East Asia Market Volume (Square Feet) Analysis by End-user Industry, 2019 to 2034

Figure 122: East Asia Market Value Share (%) and BPS Analysis by End-user Industry, 2024 to 2034

Figure 123: East Asia Market Y-o-Y Growth (%) Projections by End-user Industry, 2024 to 2034

Figure 124: East Asia Market Attractiveness by Fiber Type, 2024 to 2034

Figure 125: East Asia Market Attractiveness by End-user Industry, 2024 to 2034

Figure 126: East Asia Market Attractiveness by Country, 2024 to 2034

Figure 127: Middle East and Africa Market Value (US$ Million) by Fiber Type, 2024 to 2034

Figure 128: Middle East and Africa Market Value (US$ Million) by End-user Industry, 2024 to 2034

Figure 129: Middle East and Africa Market Value (US$ Million) by Country, 2024 to 2034

Figure 130: Middle East and Africa Market Value (US$ Million) Analysis by Country, 2019 to 2034

Figure 131: Middle East and Africa Market Volume (Square Feet) Analysis by Country, 2019 to 2034

Figure 132: Middle East and Africa Market Value Share (%) and BPS Analysis by Country, 2024 to 2034

Figure 133: Middle East and Africa Market Y-o-Y Growth (%) Projections by Country, 2024 to 2034

Figure 134: Middle East and Africa Market Value (US$ Million) Analysis by Fiber Type, 2019 to 2034

Figure 135: Middle East and Africa Market Volume (Square Feet) Analysis by Fiber Type, 2019 to 2034

Figure 136: Middle East and Africa Market Value Share (%) and BPS Analysis by Fiber Type, 2024 to 2034

Figure 137: Middle East and Africa Market Y-o-Y Growth (%) Projections by Fiber Type, 2024 to 2034

Figure 138: Middle East and Africa Market Value (US$ Million) Analysis by End-user Industry, 2019 to 2034

Figure 139: Middle East and Africa Market Volume (Square Feet) Analysis by End-user Industry, 2019 to 2034

Figure 140: Middle East and Africa Market Value Share (%) and BPS Analysis by End-user Industry, 2024 to 2034

Figure 141: Middle East and Africa Market Y-o-Y Growth (%) Projections by End-user Industry, 2024 to 2034

Figure 142: Middle East and Africa Market Attractiveness by Fiber Type, 2024 to 2034

Figure 143: Middle East and Africa Market Attractiveness by End-user Industry, 2024 to 2034

Figure 144: Middle East and Africa Market Attractiveness by Country, 2024 to 2034

Recommendations

Chemicals & Materials

Polyimide Fibers Market

Published : June 2023

Chemicals & Materials

Glass Fiber Reinforced Plastic (GFRP) Composites Market

Published : February 2023

Chemicals & Materials

Advanced Polymer Composites Market

Published : November 2022

Chemicals & Materials

Aromatic Ketone Polymers Market

Published : October 2022

Explore Chemicals & Materials Insights

View Reports

Fiber Reinforced Polymer Panel and Sheet Market