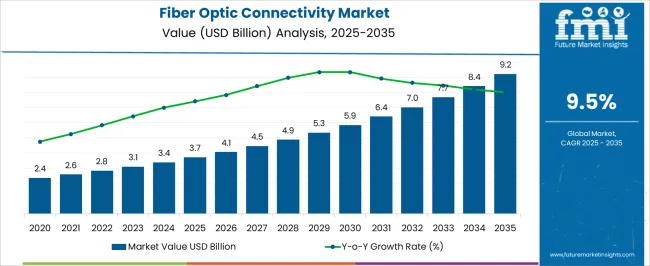
The Fiber Optic Connectivity Market is estimated to be valued at USD 3.7 billion in 2025 and is projected to reach USD 9.2 billion by 2035, registering a compound annual growth rate (CAGR) of 9.5% over the forecast period.

| Metric | Value |
|---|---|
| Fiber Optic Connectivity Market Estimated Value in (2025 E) | USD 3.7 billion |
| Fiber Optic Connectivity Market Forecast Value in (2035 F) | USD 9.2 billion |
| Forecast CAGR (2025 to 2035) | 9.5% |
The fiber optic connectivity market is expanding steadily due to growing demand for high speed data transmission, low latency communication, and the increasing reliance on cloud based services. Rising adoption of fiber optics across industries is being supported by global initiatives to modernize digital infrastructure and enhance network resilience.
Advancements in 5G deployment, data center expansion, and industrial automation have further accelerated market penetration. Additionally, the need for reliable connectivity in remote and high demand environments has reinforced investment in robust fiber networks.
Regulatory focus on digital transformation and sustainability goals has encouraged the integration of fiber optics as a long term solution to reduce energy consumption while ensuring scalability. The market outlook remains favorable as industries seek enhanced bandwidth, secure connections, and future ready infrastructure aligned with digital economy requirements..

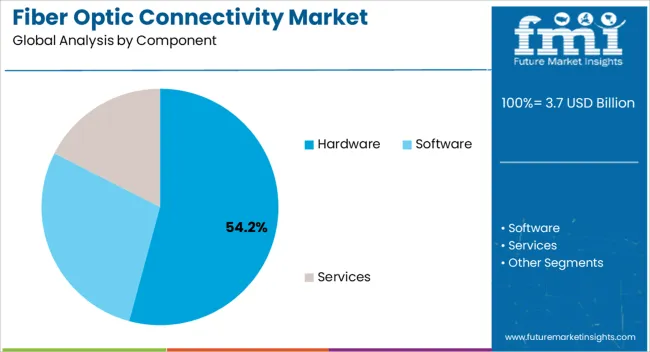
The hardware segment is expected to hold 54.20% of total revenue by 2025 within the component category, making it the dominant segment. This leadership is attributed to the critical role of physical infrastructure such as cables, connectors, and transceivers in enabling high speed data transfer and network reliability.
Increasing deployment of fiber optic cables in telecommunications, cloud computing, and enterprise networking has reinforced the importance of hardware. Moreover, investments in upgrading legacy copper networks to fiber based systems have intensified hardware demand.
The segment continues to grow as hardware innovations deliver enhanced durability, scalability, and lower maintenance costs, strengthening its dominance in the fiber optic connectivity market.

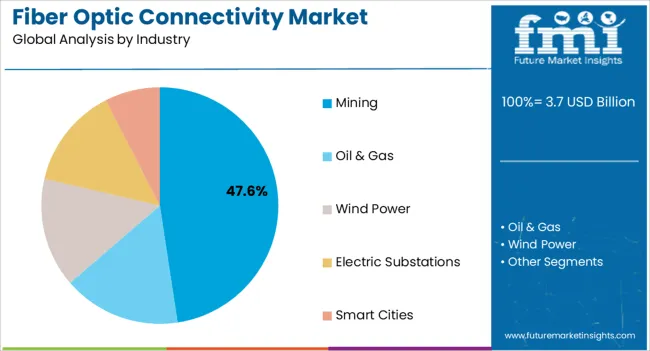
The mining industry segment is projected to account for 47.60% of overall market revenue by 2025, positioning it as the leading industry application. Growth in this segment is driven by the need for reliable, high bandwidth communication systems in remote and hazardous environments.
Fiber optic connectivity enables real time monitoring, automated operations, and improved safety management in mining sites. Enhanced resilience to electromagnetic interference and environmental factors has further supported adoption in the sector.
With digital transformation initiatives reshaping mining operations, the integration of fiber optics has become essential for efficiency, productivity, and safety. These advantages continue to make mining the largest and fastest growing end use segment within the fiber optic connectivity market.
A few factors act as obstacles and hinder the market growth during the forecast period such as:
Some of the key trends of the fiber optics connectivity market include the growing adoption of electronic gadgets and the formation of a high volume of data traffic by many customers. The increasing demand for the Internet and initiatives to improve connectivity in emerging countries are creating opportunities, fueling the demand for the fiber optics connectivity market during the forecast period.
The global demand for the Internet, coupled with the rising need for FTTx, is a significant factor driving the fiber optics industry growth. IoT is an online integration of daily use devices (mostly machine-to-machine).
The increasing number of connected devices is estimated to result in great demand for high bandwidth, which is estimated to result in the growth of IoT.
Data center colocation services that use fiber optics to transfer information are estimated to also help to boost the growth of IoT. Several other factors, such as an increase in the number of connected devices in homes, growth in demand for OTT video content, and an increase in internet access, drive the demand for the Internet.
All these factors have increased the number of Internet users, which, in turn, has led to the increased use of optical fiber cables to transfer information over the Internet, driving the fiber optics market.
The market was valued at USD 2.4 billion in 2020 and secured USD 3.7 billion in 2025. The market is anticipated to secure a CAGR of 7.4% between 2020 and 2025.
The market grew steadily by increasing demand for reliable, high-speed internet connections, cloud computing services, and Internet of Things devices. The growing investments in regions such as Asia Pacific, North America, and Europe fueled the global market between 2020 and 2025.
The demand for fiber optic connectivity is rising in developing industries such as telecommunication, enterprises, and data centers. The government also played an essential role in expanding the broadband infrastructure, with several implemented programs surging the demand for fiber optic connectivity.
The market has been highly competitive in the recent period by present players and new market entrants to offer a wide range of fiber optic connectivity solutions. The increasing adoption of 5G networks and high capability expands the global market.
The global market can be segmented based on Component, Industry, and Region. Based on the Component, the market can be segmented into Hardware, Software, and Services.
According to the FMI, the market by Component for Hardware is projected to expand at a share of 61.3% in the global market during the forecast period.
Based on Industry, the market can be segmented into Mining, Oil & Gas, Wind Power, Electric Substation, and Smart Cities. Throughout the research, the Smart Cities segment is predicted to expand at a CAGR of 10.5% during the forecast period. The smart cities sector is anticipated to secure a share of 39.4% in the global market by 2035.s
| Countries | CAGR % 2035 to End of Forecast (2035) |
|---|---|
| The United States | 20.1% |
| Germany | 8.7% |
| Japan | 6.2% |
| Australia | 2.9% |
| China | 11.6% |
| India | 10.3% |
| The United Kingdom | 9.2% |
The global market is divided into North America, South America, Europe, Asia Pacific, the Middle East, and Africa based on geography. In 2025, the sales of fiber optic connectivity solutions in the United States were worth USD 9.2 million. The market in the United States is likely to reach a valuation of USD 1 billion by 2035 with a CAGR of 20.1%.
China is expected to reach a market size of USD 0.4 billion by 2035, representing a CAGR of 11.6% over the forecast period. Japan and the United Kingdom are expected to reach the same market size of USD 0.3 billion each by 2035, representing growth forecasts of 6.2% and 9.2%, respectively, throughout the forecast period.
North America region is expected to dominate the fiber optic connectivity market during the forecast period, attributed to the increase in web usage, online music, downloading files, watching videos on demand, etc., in the United States. Further, Europe and Asia Pacific are expected to generate maximum demand for fiber optic connectivity.
India is expected to reach a market size of USD 0.2 billion in 2035, representing a CAGR of 10.3% during the forecast period. India is the second leading telecom market in the world over a billion mobile subscribers. In India, high demand for next-gen services such as 5G, Internet of Things, and Artificial Intelligence is coming from both industry and government.

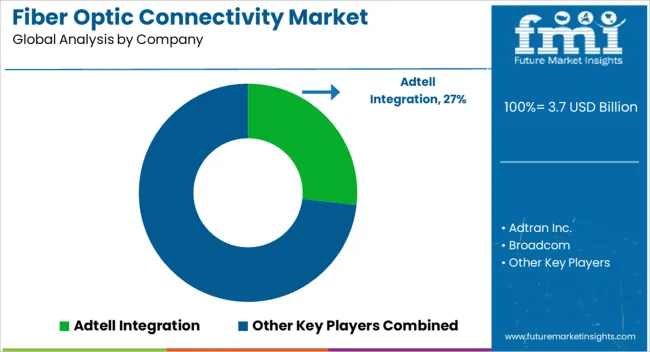
Adtell Integration, Adtran Inc., Broadcom, Cisco Systems Inc., Corning Incorporated, Fiber Optic Services (FOS), Finisar Corporation, Fujitsu Optical Components Ltd., Hamamatsu Photonics K.K., Huawei Technologies Co., HUBER+SUHNER AG, Infinera Corporation are the top companies in the global market.
With a sizable global market share, these main firms are concentrating on growing their consumer base in new countries. These businesses use strategic collaboration initiatives to grow their market share and profits.
Mid-size and small businesses, on the other hand, are expanding their market presence by gaining new contracts and entering new markets, thanks to technical developments and product innovations. The key companies that are adopting various marketing strategies to upsurge the global market include mergers, acquisitions, partnerships, agreements, and collaborations.
Recent Developments in the Global Market:
| Attribute | Details |
|---|---|
| Forecast Period | 2025 to 2035 |
| Historical Data Available for | 2020 to 2025 |
| Market Analysis | USD billion for Value |
| Key Countries Covered | The United States, The United Kingdom, Japan, India, China, Australia, Germany |
| Key Segments Covered |
Component, Industry, Region |
| Key Companies Profiled |
Adtell Integration; Adtran Inc.; Broadcom; Cisco Systems Inc.; Corning Incorporated; Fiber Optic Services (FOS); Finisar Corporation; Fujitsu Optical Components Ltd.; Hamamatsu Photonics K.K.; Huawei Technologies Co.; HUBER+SUHNER AG; Infinera Corporation; OptiLayer GmbH; Optiwave Systems, Inc.; ZTE Corporation |
| Report Coverage | Market Forecast, Company Share Analysis, Competition Intelligence, DROT Analysis, Market Dynamics and Challenges, and Strategic Growth Initiatives |
| Customization & Pricing | Available upon Request |
The global fiber optic connectivity market is estimated to be valued at USD 3.7 billion in 2025.
The market size for the fiber optic connectivity market is projected to reach USD 9.2 billion by 2035.
The fiber optic connectivity market is expected to grow at a 9.5% CAGR between 2025 and 2035.
The key product types in fiber optic connectivity market are hardware, software and services.
In terms of industry, mining segment to command 47.6% share in the fiber optic connectivity market in 2025.


Our Research Products

The "Full Research Suite" delivers actionable market intel, deep dives on markets or technologies, so clients act faster, cut risk, and unlock growth.

The Leaderboard benchmarks and ranks top vendors, classifying them as Established Leaders, Leading Challengers, or Disruptors & Challengers.

Locates where complements amplify value and substitutes erode it, forecasting net impact by horizon

We deliver granular, decision-grade intel: market sizing, 5-year forecasts, pricing, adoption, usage, revenue, and operational KPIs—plus competitor tracking, regulation, and value chains—across 60 countries broadly.

Spot the shifts before they hit your P&L. We track inflection points, adoption curves, pricing moves, and ecosystem plays to show where demand is heading, why it is changing, and what to do next across high-growth markets and disruptive tech

Real-time reads of user behavior. We track shifting priorities, perceptions of today’s and next-gen services, and provider experience, then pace how fast tech moves from trial to adoption, blending buyer, consumer, and channel inputs with social signals (#WhySwitch, #UX).

Partner with our analyst team to build a custom report designed around your business priorities. From analysing market trends to assessing competitors or crafting bespoke datasets, we tailor insights to your needs.
Supplier Intelligence
Discovery & Profiling
Capacity & Footprint
Performance & Risk
Compliance & Governance
Commercial Readiness
Who Supplies Whom
Scorecards & Shortlists
Playbooks & Docs
Category Intelligence
Definition & Scope
Demand & Use Cases
Cost Drivers
Market Structure
Supply Chain Map
Trade & Policy
Operating Norms
Deliverables
Buyer Intelligence
Account Basics
Spend & Scope
Procurement Model
Vendor Requirements
Terms & Policies
Entry Strategy
Pain Points & Triggers
Outputs
Pricing Analysis
Benchmarks
Trends
Should-Cost
Indexation
Landed Cost
Commercial Terms
Deliverables
Brand Analysis
Positioning & Value Prop
Share & Presence
Customer Evidence
Go-to-Market
Digital & Reputation
Compliance & Trust
KPIs & Gaps
Outputs
Full Research Suite comprises of:
Market outlook & trends analysis
Interviews & case studies
Strategic recommendations
Vendor profiles & capabilities analysis
5-year forecasts
8 regions and 60+ country-level data splits
Market segment data splits
12 months of continuous data updates
DELIVERED AS:
PDF EXCEL ONLINE
Optical Fiber Connectivity Market Size and Share Forecast Outlook 2025 to 2035
Fiber Optic Probe Hydrophone (FOPH) Market Size and Share Forecast Outlook 2025 to 2035
Fiber Optic Tester Market Size and Share Forecast Outlook 2025 to 2035
Fiber Optic Collimating Lens Market Size and Share Forecast Outlook 2025 to 2035
Fiber Optics Testing Market Size and Share Forecast Outlook 2025 to 2035
Fiber Optics Market Size and Share Forecast Outlook 2025 to 2035
Fiber Optic Test Equipment Market Outlook - Size, Share & Forecast 2025 to 2035
Fiber Optic Gyroscope Market Analysis - Size, Share & Forecast 2025 to 2035
Fiber Optic Gyroscope Industry Analysis in Western Europe - Trends & Forecast 2025 to 2035
Fiber Optic Labels Market Growth - Trends & Forecast 2025 to 2035
Fiber Optic Connectors Market Growth – Trends & Forecast through 2034
Fiber Optic Development Tools Market
Fiber Optic Switch Market
Fiber Optic Cables Market
Optical Fiber Cold Joint Market Size and Share Forecast Outlook 2025 to 2035
Optical Fiber Market Size and Share Forecast Outlook 2025 to 2035
LC Fiber Optic Adapters Market Size and Share Forecast Outlook 2025 to 2035
Korea fiber optic gyroscope market Growth – Trends & Forecast 2025 to 2035
Japan Fiber Optic Gyroscope Market Growth – Trends & Forecast 2025 to 2035
Modular Fiber Optical Spectrometers Market Size and Share Forecast Outlook 2025 to 2035

Thank you!
You will receive an email from our Business Development Manager. Please be sure to check your SPAM/JUNK folder too.
Chat With
MaRIA