Fiber Based Packaging Market
FMI Report Wraps Up the Key Aspects that Make Fiber Based Packaging a Suitable Eco-Friendly Option!
Fiber Based Packaging Market by Product Type, Discard Process, End-user & Region | Forecast 2022 to 2032
Fiber Based Packaging Market Outlook (2022 to 2032)
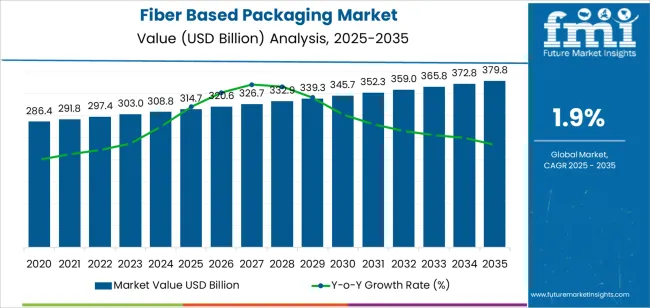
[309 Pages Report] The global fiber based packaging market is forecasted to be appraised at US$ 437,124.3 Million by 2032, up from US$ 319,012.7 Million in 2022, advancing at a CAGR of 3.2% during the forecast period. The fiber based packaging market is likely to grow owing to the shift in the approach of buying and producing/selling products by consumers and manufacturers, respectively, as a result of rising concerns regarding global warming.
Although the fiber based packaging market growth may be obstructed due to the availability of substitutes in the market, such as expanded polystyrene (EPS) and other plastics, the contrary, manufacturers are setting new production targets with eco-friendly moulded pulp materials to boost their credibility. Taking efforts to gain patents in enzyme pulping processes is estimated to bring about lucrative opportunities for the fiber based packaging market share.
Report Attribute |
Details |
Fiber Based Packaging Market Value (2022) |
US$ 319,012.7 Million |
Fiber Based Packaging Market Anticipated Value (2032) |
US$ 437,124.3 Million |
Fiber Based Packaging Market Growth Rate (2032) |
3.2% |
Fiber based packaging market participants are producing inserts, cartons, partitions, etc., to heighten the consumer’s consumption sensory experience. They are further concentrating on adding tactile appeal, which renders a true velvet feel through soft touch pack products.
Nowadays, people prefer sustainable packaging owing to their upbringing and constant reminders of environmental degradation. For this reason, this particular segment of consumers is willing to pay more for this type of packaging, as fiber based packaging comes across as an attractive and practical option boosting the fiber based packaging market trends.
Let us know your requirement to get
100% FREE customization
Elucidation of the Factors Trending the Fiber Based Packaging Market
The strong demand for processed foods, packaged merchandise, and other goods in developing economies is expected to drive the fiber based packaging market growth. Moreover, the super vibration and cushioning properties of fiber, have found their application in protective packaging. The production of shipping dunnage, outer packaging, trays, etc., is carried out by manufacturers in the fiber based packaging market.
An increase in the overseas and collections demand for recovered fiber is further estimated to propel the fiber based packaging market share.
Cost-efficient food retailers and organizations are merging with multi-partners, such as the Environmental Defense Fund, WWF, with a goal to decrease various types of ecological risks, creating some indirect opportunities for the global fiber based packaging market. Thus, the utilization of paper-based packaging is likely to broaden and underscore, suggesting the necessary changes in packaging materials.
Lack of Raw Materials & Other Restraints Might Pose as Hindrance for Fiber Based Packaging Market Opportunities
The sourcing of raw materials for the product can pose a challenge for the worldwide fiber based packaging market during the forecast period. This also makes the managing of sourcing and production of packaging material difficult and, in some cases, expensive.
In addition, there may be a fluctuation in the demand and supply of raw materials, which further affects the cost. Moreover, the production of these types of packaging materials requires excessive use of water and electricity supply. These factors are expected to predominantly hinder the fiber based packaging market growth.
Conversely, the fiber based packaging market size is anticipated to expand through ambitious structural reforms and sound macroeconomic policies, especially in developing economies. Furthermore, the launching of advanced machineries, such as manufacturing tools and 3D printing tools, to enhance the packaging quality and production efficiency may inspire fiber based packaging market players to adopt more innovative strategies.
Find your sweet spots for generating winning opportunities in this market.
Talk to AnalystWhat is the condition of the North America Fiber Based Packaging Market?
North America currently holds the largest share of the global fiber based packaging market with a revenue contribution of 24%.
In this region, especially in countries like USA and Canada, multisensory fiber based packaging products are sold on a massive scale since eco-friendly options are growing in popularity.
What is the Growth Outlook for the Europe Fiber Based Packaging Market?
With a revenue of 18%, Europe is the second largest fiber based packaging market. This is owing to the increasing consumption of food & beverage products as consumers change their eating habits and focus on healthy foods.
The Asia-Pacific is also a growing fiber based packaging market owing to the presence of several end-user industries. Additionally, the fiber based packaging market size is likely to expand during the forecast period because of the low cost and availability of raw materials and labor.

A unified Market Research Subscription Platform, built for today's disparate research needs.
Take A Glance at the Start-up Companies Taking Over the Fiber Based Packaging Market!
Start-up companies increasingly recognize the problem of environmental degradation. Hence, they are developing innovative strategies to enhance the quality of sustainable packaging solutions. This includes the option to effectively dispose of packaging waste without contributing to environmental pollution. Here’s more:
- Fiber Interior Packaging - It is a manufacturer of molded fiber packaging products for the packaging of paint cans, health supplements, salsa & sauce jars, truck parts, etc.
- Sustainable Fiber Technologies - It is a provider of molded pulp-based packaging products. Products include cups, trays, plates, boxes, etc.
- WestRock Company - It is a provider of sustainable packaging products for multiple industries. It also offers child-resistant packaging solutions. It provides its services for packaging solutions for pumps and sprays, creams, gels, and ointments.
- Temper Pack - It is a manufacturer of thermal packaging for perishable goods. Manufactures the products using jute fiber, recycled denim, cotton, wool, paper, recycled plastics, and plant oils and starches.
- Coastgrass - It is a Danish start-up promoting biodegradable FMCG packaging. The start-up upcycles eelgrass into packaging material. The start-up combines natural fibers and biodegradable polymers to produce microplastic-free packages.
Key Market Players of the Fiber Based Packaging Market
- Evergreen Packaging - It is a part of Pactiv Evergreen. Their PlantCarton® refrigerated beverage packaging and the products made from their paper and paperboard, all come from trees where responsible forestry practices are used.
- Omya AG - It is a producer of industrial minerals, mainly fillers and pigments derived from calcium carbonate and dolomite. The company's major markets are forest products, polymers, building materials as well as life sciences.
- Orora Packaging Australia Pty Ltd. - They are a global packaging manufacturer, distributor, and visual communication solutions company. They provide fiber based packaging market-leading sustainable packaging solutions for the beverage industry.
- Stora Enso AB - It is a manufacturer of pulp, paper, and other forest products, headquartered in Helsinki, Finland. Stora Enso was formed in 1998 when the Swedish mining and forestry products company Stora AB merged with the Finnish forestry products company Enso Oyj.
- Huhtamäki Oyj - It is a Finnish consumer packaging company whose production includes food packaging, disposable containers, as well as egg cartons, and fruit packaging for quick service restaurants, coffee shops, retail stores, caterers, and vending operators. It operates globally and is headquartered in Espoo, Finland.
Transforming Competitive Landscape Fiber Based Packaging Market
The fiber based packaging market share is likely to have a positive impact on its growth owing to the rising concerns about global warming. The biodegradable material obtained from natural sources is sustainable in the long run. Hence product manufacturers are focusing on the manufacturing of eco-friendly packaging solutions.
A few of the latest developments in the fiber based packaging market are:
- In May 2019, Huhtamäki Oyj, a packaging solution provider, launched its new fiber-based meal trays suitable for conventional and microwave ovens for Waitrose and partners to replace black plastic. These trays are recyclable and certified for composing.
- In March 2022, Solenis, a leading producer of specialty chemicals announced a partnership with PulPac, a fiber-forming technology available to converters, brand owners and. The partnership will help Solenis to create a new and competitive standard in sustainable packaging and work on developing an alternative for single-use plastic.
- In February 2021, International Paper, a renewable fiber-based packaging products supplier, expanded its portfolio with the acquisition of Berkley International’s moulded fiber division Berkley MF.
- In January 2022, Huhtamäki Oyj acquired full ownership of its Polish joint venture company Huhtamäki Smith Anderson sp. z o.o. from Smith Anderson Group Ltd. (SA). This acquisition enables Huhtamaki to invest in and further grow the business in Eastern Europe.
Other Market Participants of Fibber Based Packaging Market
- UFP Technologies Inc.
- Bumaga BV
- Oji Fibre Solutions
- WestRock Company
- Ahlstrom Corporation
- Sonoco Products Company
- Pratt Industries Inc.
- KapStone Paper and Packaging Corp.
- Mayr-Melnhof Karton AG
- Rengo Co. Ltd.
- Mondi Group
- AR Packaging Group AB
- BillerudKorsnäs AB
- USA Corrugated Inc.
- ESCO Technologies Inc.
- Brodrene Hartmann A/S
- International Paper Company
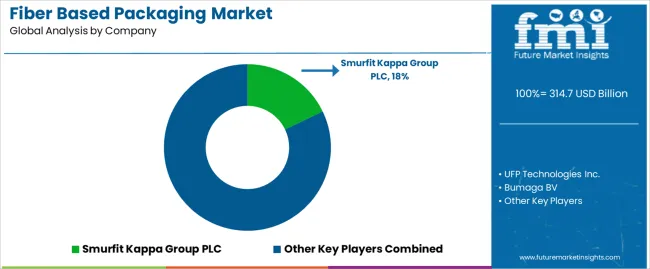
- Smurfit Kappa Group PLC
- Georgia-Pacific LLC
Report Scope
Report Attribute |
Details |
Growth Rate |
CAGR of 3.2% from 2022 to 2032 |
The base year for estimation |
2021 |
Historical data |
2017 to 2021 |
Forecast period |
2022 to 2032 |
Quantitative units |
Revenue in USD million and CAGR from 2022 to 2032 |
Report Coverage |
Revenue forecast, volume forecast, company ranking, competitive landscape, growth factors, and trends, Pricing Analysis, |
Segments Covered |
Product Type, Discard Process, End User, and Region. |
Regional scope |
North America; Western Europe, Eastern Europe, Middle East, Africa, ASEAN, South Asia, Rest of Asia, Australia, and New Zealand |
Country scope |
USA; Canada; Mexico; Germany; UK; France; Italy; Spain; Russia; Belgium; Poland; Czech Republic; China; India; Japan; Australia; Brazil; Argentina; Colombia; Saudi Arabia; UAE; Iran; South Africa |
Key companies profiled |
Evergreen Packaging, Omya AG, Orora Packaging Australia Pty Ltd., Stora Enso AB, Huhtamäki Oyj, UFP Technologies Inc., Bumaga BV, Oji Fibre Solutions, WestRock Company, Ahlstrom Corporation, Sonoco Products Company, Pratt Industries Inc., KapStone Paper and Packaging Corp., Mayr-Melnhof Karton AG, Rengo Co. Ltd., Mondi Group, AR Packaging Group AB, BillerudKorsnäs AB, USA Corrugated Inc., ESCO Technologies Inc., Brodrene Hartmann A/S, International Paper Company, Smurfit Kappa Group PLC, Georgia-Pacific LLC, etc. |
Customization scope |
Free report customization (equivalent to up to 8 analysts' working days) with purchase. Addition or alteration to country, regional & segment scope. |
Pricing and purchase options |
Avail customized purchase options to meet your exact research needs. |
Key Segments Profiled in the Fiber Based Packaging Market Survey
By Product Type:
- Paper Boards
- Corrugated Packaging
- Industrial Bags
- Displays
- Cushioning
- Supports
- Extrusion Coatings
- Release Liners
By Discard Process:
- Recyclable
- Reusable
- Degradable
By End User:
- Chemicals
- Food & Beverages
- Consumer Electronics
- Construction
By Region:
- North America
- Latin America
- Asia Pacific
- Middle East and Africa (MEA)
- Europe
Frequently Asked Questions
How much CAGR can be expected for the Fiber Based Packaging Market?
The fiber based packaging market is likely to garner a CAGR of 3.2% during the forecast period.
What is the Major Restraint of the Fiber Based Packaging Market?
The availability of substitutes in the market, such as expanded polystyrene (EPS) and other plastics.
What will be the Size of the Fiber Based Packaging Market by 2032?
The market is likely to grow to a revenue of US$ 437,124.3 Million by 2032.
Table of Content
1. Executive Summary | Fiber Based Packaging Market 1.1. Global Market Outlook 1.2. Demand-side Trends 1.3. Supply-side Trends 1.4. Technology Roadmap Analysis 1.5. Analysis and Recommendations 2. Market Overview 2.1. Market Coverage / Taxonomy 2.2. Market Definition / Scope / Limitations 3. Market Background 3.1. Market Dynamics 3.1.1. Drivers 3.1.2. Restraints 3.1.3. Opportunity 3.1.4. Trends 3.2. Scenario Forecast 3.2.1. Demand in Optimistic Scenario 3.2.2. Demand in Likely Scenario 3.2.3. Demand in Conservative Scenario 3.3. Opportunity Map Analysis 3.4. Investment Feasibility Matrix 3.5. PESTLE and Porter’s Analysis 3.6. Regulatory Landscape 3.6.1. By Key Regions 3.6.2. By Key Countries 3.7. Regional Parent Market Outlook 4. Global Market Analysis 2017 to 2021 and Forecast, 2022 to 2032 4.1. Historical Market Size Value (US$ Million) Analysis, 2017 to 2021 4.2. Current and Future Market Size Value (US$ Million) Projections, 2022 to 2032 4.2.1. Y-o-Y Growth Trend Analysis 4.2.2. Absolute $ Opportunity Analysis 5. Global Market Analysis 2017 to 2021 and Forecast 2022 to 2032, By Product type 5.1. Introduction / Key Findings 5.2. Historical Market Size Value (US$ Million) Analysis By Product Type, 2017 to 2021 5.3. Current and Future Market Size Value (US$ Million) Analysis and Forecast By Product Type, 2022 to 2032 5.3.1. Paper boards 5.3.2. Corrugated packaging 5.3.3. Industrial bags 5.3.4. Displays 5.3.5. Cushioning 5.3.6. Supports 5.3.7. Extrusion coatings 5.3.8. Release liners 5.4. Y-o-Y Growth Trend Analysis By Product Type, 2017 to 2021 5.5. Absolute $ Opportunity Analysis By Product Type, 2022 to 2032 6. Global Market Analysis 2017 to 2021 and Forecast 2022 to 2032, By End-use 6.1. Introduction / Key Findings 6.2. Historical Market Size Value (US$ Million) Analysis By End-use, 2017 to 2021 6.3. Current and Future Market Size Value (US$ Million) Analysis and Forecast By End-use, 2022 to 2032 6.3.1. Chemicals 6.3.2. Food & Beverages 6.3.3. Consumer electronics 6.3.4. Construction 6.3.5. Others 6.4. Y-o-Y Growth Trend Analysis By End-use, 2017 to 2021 6.5. Absolute $ Opportunity Analysis By End-use, 2022 to 2032 7. Global Market Analysis 2017 to 2021 and Forecast 2022 to 2032, By Discard process 7.1. Introduction / Key Findings 7.2. Historical Market Size Value (US$ Million) Analysis By Discard process, 2017 to 2021 7.3. Current and Future Market Size Value (US$ Million) Analysis and Forecast By Discard process, 2022 to 2032 7.3.1. Recyclable 7.3.2. Reusable 7.3.3. Degradable 7.4. Y-o-Y Growth Trend Analysis By Discard process, 2017 to 2021 7.5. Absolute $ Opportunity Analysis By Discard process, 2022 to 2032 8. Global Market Analysis 2017 to 2021 and Forecast 2022 to 2032, By Region 8.1. Introduction 8.2. Historical Market Size Value (US$ Million) Analysis By Region, 2017 to 2021 8.3. Current Market Size Value (US$ Million) Analysis and Forecast By Region, 2022 to 2032 8.3.1. North America 8.3.2. Latin America 8.3.3. Europe 8.3.4. South Asia 8.3.5. East Asia 8.3.6. Oceania 8.3.7. Middle East and Africa (MEA) 8.4. Market Attractiveness Analysis By Region 9. North America Market Analysis 2017 to 2021 and Forecast 2022 to 2032, By Country 9.1. Historical Market Size Value (US$ Million) Trend Analysis By Market Taxonomy, 2017 to 2021 9.2. Market Size Value (US$ Million) Forecast By Market Taxonomy, 2022 to 2032 9.2.1. By Country 9.2.1.1. United States of America 9.2.1.2. Canada 9.2.2. By Product type 9.2.3. By End-use 9.2.4. By Discard process 9.3. Market Attractiveness Analysis 9.3.1. By Country 9.3.2. By Product type 9.3.3. By End-use 9.3.4. By Discard process 9.4. Key Takeaways 10. Latin America Market Analysis 2017 to 2021 and Forecast 2022 to 2032, By Country 10.1. Historical Market Size Value (US$ Million) Trend Analysis By Market Taxonomy, 2017 to 2021 10.2. Market Size Value (US$ Million) Forecast By Market Taxonomy, 2022 to 2032 10.2.1. By Country 10.2.1.1. Brazil 10.2.1.2. Mexico 10.2.1.3. Rest of Latin America 10.2.2. By Product type 10.2.3. By End-use 10.2.4. By Discard process 10.3. Market Attractiveness Analysis 10.3.1. By Country 10.3.2. By Product type 10.3.3. By End-use 10.3.4. By Discard process 10.4. Key Takeaways 11. Europe Market Analysis 2017 to 2021 and Forecast 2022 to 2032, By Country 11.1. Historical Market Size Value (US$ Million) Trend Analysis By Market Taxonomy, 2017 to 2021 11.2. Market Size Value (US$ Million) Forecast By Market Taxonomy, 2022 to 2032 11.2.1. By Country 11.2.1.1. Germany 11.2.1.2. United Kingdom 11.2.1.3. France 11.2.1.4. Spain 11.2.1.5. Italy 11.2.1.6. Rest of Europe 11.2.2. By Product type 11.2.3. By End-use 11.2.4. By Discard process 11.3. Market Attractiveness Analysis 11.3.1. By Country 11.3.2. By Product type 11.3.3. By End-use 11.3.4. By Discard process 11.4. Key Takeaways 12. South Asia Market Analysis 2017 to 2021 and Forecast 2022 to 2032, By Country 12.1. Historical Market Size Value (US$ Million) Trend Analysis By Market Taxonomy, 2017 to 2021 12.2. Market Size Value (US$ Million) Forecast By Market Taxonomy, 2022 to 2032 12.2.1. By Country 12.2.1.1. India 12.2.1.2. Malaysia 12.2.1.3. Singapore 12.2.1.4. Thailand 12.2.1.5. Rest of South Asia 12.2.2. By Product type 12.2.3. By End-use 12.2.4. By Discard process 12.3. Market Attractiveness Analysis 12.3.1. By Country 12.3.2. By Product type 12.3.3. By End-use 12.3.4. By Discard process 12.4. Key Takeaways 13. East Asia Market Analysis 2017 to 2021 and Forecast 2022 to 2032, By Country 13.1. Historical Market Size Value (US$ Million) Trend Analysis By Market Taxonomy, 2017 to 2021 13.2. Market Size Value (US$ Million) Forecast By Market Taxonomy, 2022 to 2032 13.2.1. By Country 13.2.1.1. China 13.2.1.2. Japan 13.2.1.3. South Korea 13.2.2. By Product type 13.2.3. By End-use 13.2.4. By Discard process 13.3. Market Attractiveness Analysis 13.3.1. By Country 13.3.2. By Product type 13.3.3. By End-use 13.3.4. By Discard process 13.4. Key Takeaways 14. Oceania Market Analysis 2017 to 2021 and Forecast 2022 to 2032, By Country 14.1. Historical Market Size Value (US$ Million) Trend Analysis By Market Taxonomy, 2017 to 2021 14.2. Market Size Value (US$ Million) Forecast By Market Taxonomy, 2022 to 2032 14.2.1. By Country 14.2.1.1. Australia 14.2.1.2. New Zealand 14.2.2. By Product type 14.2.3. By End-use 14.2.4. By Discard process 14.3. Market Attractiveness Analysis 14.3.1. By Country 14.3.2. By Product type 14.3.3. By End-use 14.3.4. By Discard process 14.4. Key Takeaways 15. MEA Market Analysis 2017 to 2021 and Forecast 2022 to 2032, By Country 15.1. Historical Market Size Value (US$ Million) Trend Analysis By Market Taxonomy, 2017 to 2021 15.2. Market Size Value (US$ Million) Forecast By Market Taxonomy, 2022 to 2032 15.2.1. By Country 15.2.1.1. GCC Countries 15.2.1.2. South Africa 15.2.1.3. Israel 15.2.1.4. Rest of MEA 15.2.2. By Product type 15.2.3. By End-use 15.2.4. By Discard process 15.3. Market Attractiveness Analysis 15.3.1. By Country 15.3.2. By Product type 15.3.3. By End-use 15.3.4. By Discard process 15.4. Key Takeaways 16. Key Countries Market Analysis 16.1. United States of America 16.1.1. Pricing Analysis 16.1.2. Market Share Analysis, 2021 16.1.2.1. By Product type 16.1.2.2. By End-use 16.1.2.3. By Discard process 16.2. Canada 16.2.1. Pricing Analysis 16.2.2. Market Share Analysis, 2021 16.2.2.1. By Product type 16.2.2.2. By End-use 16.2.2.3. By Discard process 16.3. Brazil 16.3.1. Pricing Analysis 16.3.2. Market Share Analysis, 2021 16.3.2.1. By Product type 16.3.2.2. By End-use 16.3.2.3. By Discard process 16.4. Mexico 16.4.1. Pricing Analysis 16.4.2. Market Share Analysis, 2021 16.4.2.1. By Product type 16.4.2.2. By End-use 16.4.2.3. By Discard process 16.5. Germany 16.5.1. Pricing Analysis 16.5.2. Market Share Analysis, 2021 16.5.2.1. By Product type 16.5.2.2. By End-use 16.5.2.3. By Discard process 16.6. United Kingdom 16.6.1. Pricing Analysis 16.6.2. Market Share Analysis, 2021 16.6.2.1. By Product type 16.6.2.2. By End-use 16.6.2.3. By Discard process 16.7. France 16.7.1. Pricing Analysis 16.7.2. Market Share Analysis, 2021 16.7.2.1. By Product type 16.7.2.2. By End-use 16.7.2.3. By Discard process 16.8. Spain 16.8.1. Pricing Analysis 16.8.2. Market Share Analysis, 2021 16.8.2.1. By Product type 16.8.2.2. By End-use 16.8.2.3. By Discard process 16.9. Italy 16.9.1. Pricing Analysis 16.9.2. Market Share Analysis, 2021 16.9.2.1. By Product type 16.9.2.2. By End-use 16.9.2.3. By Discard process 16.10. India 16.10.1. Pricing Analysis 16.10.2. Market Share Analysis, 2021 16.10.2.1. By Product type 16.10.2.2. By End-use 16.10.2.3. By Discard process 16.11. Malaysia 16.11.1. Pricing Analysis 16.11.2. Market Share Analysis, 2021 16.11.2.1. By Product type 16.11.2.2. By End-use 16.11.2.3. By Discard process 16.12. Singapore 16.12.1. Pricing Analysis 16.12.2. Market Share Analysis, 2021 16.12.2.1. By Product type 16.12.2.2. By End-use 16.12.2.3. By Discard process 16.13. Thailand 16.13.1. Pricing Analysis 16.13.2. Market Share Analysis, 2021 16.13.2.1. By Product type 16.13.2.2. By End-use 16.13.2.3. By Discard process 16.14. China 16.14.1. Pricing Analysis 16.14.2. Market Share Analysis, 2021 16.14.2.1. By Product type 16.14.2.2. By End-use 16.14.2.3. By Discard process 16.15. Japan 16.15.1. Pricing Analysis 16.15.2. Market Share Analysis, 2021 16.15.2.1. By Product type 16.15.2.2. By End-use 16.15.2.3. By Discard process 16.16. South Korea 16.16.1. Pricing Analysis 16.16.2. Market Share Analysis, 2021 16.16.2.1. By Product type 16.16.2.2. By End-use 16.16.2.3. By Discard process 16.17. Australia 16.17.1. Pricing Analysis 16.17.2. Market Share Analysis, 2021 16.17.2.1. By Product type 16.17.2.2. By End-use 16.17.2.3. By Discard process 16.18. New Zealand 16.18.1. Pricing Analysis 16.18.2. Market Share Analysis, 2021 16.18.2.1. By Product type 16.18.2.2. By End-use 16.18.2.3. By Discard process 16.19. GCC Countries 16.19.1. Pricing Analysis 16.19.2. Market Share Analysis, 2021 16.19.2.1. By Product type 16.19.2.2. By End-use 16.19.2.3. By Discard process 16.20. South Africa 16.20.1. Pricing Analysis 16.20.2. Market Share Analysis, 2021 16.20.2.1. By Product type 16.20.2.2. By End-use 16.20.2.3. By Discard process 16.21. Israel 16.21.1. Pricing Analysis 16.21.2. Market Share Analysis, 2021 16.21.2.1. By Product type 16.21.2.2. By End-use 16.21.2.3. By Discard process 17. Market Structure Analysis 17.1. Competition Dashboard 17.2. Competition Benchmarking 17.3. Market Share Analysis of Top Players 17.3.1. By Regional 17.3.2. By Product type 17.3.3. By End-use 17.3.4. By Discard process 18. Competition Analysis 18.1. Competition Deep Dive 18.1.1. Evergreen packaging 18.1.1.1. Overview 18.1.1.2. Product Portfolio 18.1.1.3. Profitability by Market Segments 18.1.1.4. Sales Footprint 18.1.1.5. Strategy Overview 18.1.1.5.1. Marketing Strategy 18.1.2. Omya AG 18.1.2.1. Overview 18.1.2.2. Product Portfolio 18.1.2.3. Profitability by Market Segments 18.1.2.4. Sales Footprint 18.1.2.5. Strategy Overview 18.1.2.5.1. Marketing Strategy 18.1.3. Orora Packaging Australia Pty Ltd 18.1.3.1. Overview 18.1.3.2. Product Portfolio 18.1.3.3. Profitability by Market Segments 18.1.3.4. Sales Footprint 18.1.3.5. Strategy Overview 18.1.3.5.1. Marketing Strategy 18.1.4. Stora Enso AB 18.1.4.1. Overview 18.1.4.2. Product Portfolio 18.1.4.3. Profitability by Market Segments 18.1.4.4. Sales Footprint 18.1.4.5. Strategy Overview 18.1.4.5.1. Marketing Strategy 18.1.5. Huthamaki Group 18.1.5.1. Overview 18.1.5.2. Product Portfolio 18.1.5.3. Profitability by Market Segments 18.1.5.4. Sales Footprint 18.1.5.5. Strategy Overview 18.1.5.5.1. Marketing Strategy 18.1.6. UFP Technologies, Inc. 18.1.6.1. Overview 18.1.6.2. Product Portfolio 18.1.6.3. Profitability by Market Segments 18.1.6.4. Sales Footprint 18.1.6.5. Strategy Overview 18.1.6.5.1. Marketing Strategy 18.1.7. Bumaga BV 18.1.7.1. Overview 18.1.7.2. Product Portfolio 18.1.7.3. Profitability by Market Segments 18.1.7.4. Sales Footprint 18.1.7.5. Strategy Overview 18.1.7.5.1. Marketing Strategy 18.1.8. Oji Fibre solutions 18.1.8.1. Overview 18.1.8.2. Product Portfolio 18.1.8.3. Profitability by Market Segments 18.1.8.4. Sales Footprint 18.1.8.5. Strategy Overview 18.1.8.5.1. Marketing Strategy 18.1.9. Westrock Company 18.1.9.1. Overview 18.1.9.2. Product Portfolio 18.1.9.3. Profitability by Market Segments 18.1.9.4. Sales Footprint 18.1.9.5. Strategy Overview 18.1.9.5.1. Marketing Strategy 18.1.10. Ahlstrom Corporation 18.1.10.1. Overview 18.1.10.2. Product Portfolio 18.1.10.3. Profitability by Market Segments 18.1.10.4. Sales Footprint 18.1.10.5. Strategy Overview 18.1.10.5.1. Marketing Strategy 19. Assumptions & Acronyms Used 20. Research Methodology
Let us know your requirement to get
100% FREE customization
List of Tables
Table 1: Global Market Value (US$ Million) Forecast by Region, 2017 to 2032 Table 2: Global Market Value (US$ Million) Forecast by Product Type, 2017 to 2032 Table 3: Global Market Value (US$ Million) Forecast by End-use, 2017 to 2032 Table 4: Global Market Value (US$ Million) Forecast by Discard process, 2017 to 2032 Table 5: North America Market Value (US$ Million) Forecast by Country, 2017 to 2032 Table 6: North America Market Value (US$ Million) Forecast by Product Type, 2017 to 2032 Table 7: North America Market Value (US$ Million) Forecast by End-use, 2017 to 2032 Table 8: North America Market Value (US$ Million) Forecast by Discard process, 2017 to 2032 Table 9: Latin America Market Value (US$ Million) Forecast by Country, 2017 to 2032 Table 10: Latin America Market Value (US$ Million) Forecast by Product Type, 2017 to 2032 Table 11: Latin America Market Value (US$ Million) Forecast by End-use, 2017 to 2032 Table 12: Latin America Market Value (US$ Million) Forecast by Discard process, 2017 to 2032 Table 13: Europe Market Value (US$ Million) Forecast by Country, 2017 to 2032 Table 14: Europe Market Value (US$ Million) Forecast by Product Type, 2017 to 2032 Table 15: Europe Market Value (US$ Million) Forecast by End-use, 2017 to 2032 Table 16: Europe Market Value (US$ Million) Forecast by Discard process, 2017 to 2032 Table 17: South Asia Market Value (US$ Million) Forecast by Country, 2017 to 2032 Table 18: South Asia Market Value (US$ Million) Forecast by Product Type, 2017 to 2032 Table 19: South Asia Market Value (US$ Million) Forecast by End-use, 2017 to 2032 Table 20: South Asia Market Value (US$ Million) Forecast by Discard process, 2017 to 2032 Table 21: East Asia Market Value (US$ Million) Forecast by Country, 2017 to 2032 Table 22: East Asia Market Value (US$ Million) Forecast by Product Type, 2017 to 2032 Table 23: East Asia Market Value (US$ Million) Forecast by End-use, 2017 to 2032 Table 24: East Asia Market Value (US$ Million) Forecast by Discard process, 2017 to 2032 Table 25: Oceania Market Value (US$ Million) Forecast by Country, 2017 to 2032 Table 26: Oceania Market Value (US$ Million) Forecast by Product Type, 2017 to 2032 Table 27: Oceania Market Value (US$ Million) Forecast by End-use, 2017 to 2032 Table 28: Oceania Market Value (US$ Million) Forecast by Discard process, 2017 to 2032 Table 29: MEA Market Value (US$ Million) Forecast by Country, 2017 to 2032 Table 30: MEA Market Value (US$ Million) Forecast by Product Type, 2017 to 2032 Table 31: MEA Market Value (US$ Million) Forecast by End-use, 2017 to 2032 Table 32: MEA Market Value (US$ Million) Forecast by Discard process, 2017 to 2032
Find your sweet spots for generating winning opportunities in this market.
Talk to AnalystList of Charts
Figure 1: Global Market Value (US$ Million) by Product Type, 2022 to 2032 Figure 2: Global Market Value (US$ Million) by End-use, 2022 to 2032 Figure 3: Global Market Value (US$ Million) by Discard process, 2022 to 2032 Figure 4: Global Market Value (US$ Million) by Region, 2022 to 2032 Figure 5: Global Market Value (US$ Million) Analysis by Region, 2017 to 2032 Figure 6: Global Market Value Share (%) and BPS Analysis by Region, 2022 to 2032 Figure 7: Global Market Y-o-Y Growth (%) Projections by Region, 2022 to 2032 Figure 8: Global Market Value (US$ Million) Analysis by Product Type, 2017 to 2032 Figure 9: Global Market Value Share (%) and BPS Analysis by Product Type, 2022 to 2032 Figure 10: Global Market Y-o-Y Growth (%) Projections by Product Type, 2022 to 2032 Figure 11: Global Market Value (US$ Million) Analysis by End-use, 2017 to 2032 Figure 12: Global Market Value Share (%) and BPS Analysis by End-use, 2022 to 2032 Figure 13: Global Market Y-o-Y Growth (%) Projections by End-use, 2022 to 2032 Figure 14: Global Market Value (US$ Million) Analysis by Discard process, 2017 to 2032 Figure 15: Global Market Value Share (%) and BPS Analysis by Discard process, 2022 to 2032 Figure 16: Global Market Y-o-Y Growth (%) Projections by Discard process, 2022 to 2032 Figure 17: Global Market Attractiveness by Product Type, 2022 to 2032 Figure 18: Global Market Attractiveness by End-use, 2022 to 2032 Figure 19: Global Market Attractiveness by Discard process, 2022 to 2032 Figure 20: Global Market Attractiveness by Region, 2022 to 2032 Figure 21: North America Market Value (US$ Million) by Product Type, 2022 to 2032 Figure 22: North America Market Value (US$ Million) by End-use, 2022 to 2032 Figure 23: North America Market Value (US$ Million) by Discard process, 2022 to 2032 Figure 24: North America Market Value (US$ Million) by Country, 2022 to 2032 Figure 25: North America Market Value (US$ Million) Analysis by Country, 2017 to 2032 Figure 26: North America Market Value Share (%) and BPS Analysis by Country, 2022 to 2032 Figure 27: North America Market Y-o-Y Growth (%) Projections by Country, 2022 to 2032 Figure 28: North America Market Value (US$ Million) Analysis by Product Type, 2017 to 2032 Figure 29: North America Market Value Share (%) and BPS Analysis by Product Type, 2022 to 2032 Figure 30: North America Market Y-o-Y Growth (%) Projections by Product Type, 2022 to 2032 Figure 31: North America Market Value (US$ Million) Analysis by End-use, 2017 to 2032 Figure 32: North America Market Value Share (%) and BPS Analysis by End-use, 2022 to 2032 Figure 33: North America Market Y-o-Y Growth (%) Projections by End-use, 2022 to 2032 Figure 34: North America Market Value (US$ Million) Analysis by Discard process, 2017 to 2032 Figure 35: North America Market Value Share (%) and BPS Analysis by Discard process, 2022 to 2032 Figure 36: North America Market Y-o-Y Growth (%) Projections by Discard process, 2022 to 2032 Figure 37: North America Market Attractiveness by Product Type, 2022 to 2032 Figure 38: North America Market Attractiveness by End-use, 2022 to 2032 Figure 39: North America Market Attractiveness by Discard process, 2022 to 2032 Figure 40: North America Market Attractiveness by Country, 2022 to 2032 Figure 41: Latin America Market Value (US$ Million) by Product Type, 2022 to 2032 Figure 42: Latin America Market Value (US$ Million) by End-use, 2022 to 2032 Figure 43: Latin America Market Value (US$ Million) by Discard process, 2022 to 2032 Figure 44: Latin America Market Value (US$ Million) by Country, 2022 to 2032 Figure 45: Latin America Market Value (US$ Million) Analysis by Country, 2017 to 2032 Figure 46: Latin America Market Value Share (%) and BPS Analysis by Country, 2022 to 2032 Figure 47: Latin America Market Y-o-Y Growth (%) Projections by Country, 2022 to 2032 Figure 48: Latin America Market Value (US$ Million) Analysis by Product Type, 2017 to 2032 Figure 49: Latin America Market Value Share (%) and BPS Analysis by Product Type, 2022 to 2032 Figure 50: Latin America Market Y-o-Y Growth (%) Projections by Product Type, 2022 to 2032 Figure 51: Latin America Market Value (US$ Million) Analysis by End-use, 2017 to 2032 Figure 52: Latin America Market Value Share (%) and BPS Analysis by End-use, 2022 to 2032 Figure 53: Latin America Market Y-o-Y Growth (%) Projections by End-use, 2022 to 2032 Figure 54: Latin America Market Value (US$ Million) Analysis by Discard process, 2017 to 2032 Figure 55: Latin America Market Value Share (%) and BPS Analysis by Discard process, 2022 to 2032 Figure 56: Latin America Market Y-o-Y Growth (%) Projections by Discard process, 2022 to 2032 Figure 57: Latin America Market Attractiveness by Product Type, 2022 to 2032 Figure 58: Latin America Market Attractiveness by End-use, 2022 to 2032 Figure 59: Latin America Market Attractiveness by Discard process, 2022 to 2032 Figure 60: Latin America Market Attractiveness by Country, 2022 to 2032 Figure 61: Europe Market Value (US$ Million) by Product Type, 2022 to 2032 Figure 62: Europe Market Value (US$ Million) by End-use, 2022 to 2032 Figure 63: Europe Market Value (US$ Million) by Discard process, 2022 to 2032 Figure 64: Europe Market Value (US$ Million) by Country, 2022 to 2032 Figure 65: Europe Market Value (US$ Million) Analysis by Country, 2017 to 2032 Figure 66: Europe Market Value Share (%) and BPS Analysis by Country, 2022 to 2032 Figure 67: Europe Market Y-o-Y Growth (%) Projections by Country, 2022 to 2032 Figure 68: Europe Market Value (US$ Million) Analysis by Product Type, 2017 to 2032 Figure 69: Europe Market Value Share (%) and BPS Analysis by Product Type, 2022 to 2032 Figure 70: Europe Market Y-o-Y Growth (%) Projections by Product Type, 2022 to 2032 Figure 71: Europe Market Value (US$ Million) Analysis by End-use, 2017 to 2032 Figure 72: Europe Market Value Share (%) and BPS Analysis by End-use, 2022 to 2032 Figure 73: Europe Market Y-o-Y Growth (%) Projections by End-use, 2022 to 2032 Figure 74: Europe Market Value (US$ Million) Analysis by Discard process, 2017 to 2032 Figure 75: Europe Market Value Share (%) and BPS Analysis by Discard process, 2022 to 2032 Figure 76: Europe Market Y-o-Y Growth (%) Projections by Discard process, 2022 to 2032 Figure 77: Europe Market Attractiveness by Product Type, 2022 to 2032 Figure 78: Europe Market Attractiveness by End-use, 2022 to 2032 Figure 79: Europe Market Attractiveness by Discard process, 2022 to 2032 Figure 80: Europe Market Attractiveness by Country, 2022 to 2032 Figure 81: South Asia Market Value (US$ Million) by Product Type, 2022 to 2032 Figure 82: South Asia Market Value (US$ Million) by End-use, 2022 to 2032 Figure 83: South Asia Market Value (US$ Million) by Discard process, 2022 to 2032 Figure 84: South Asia Market Value (US$ Million) by Country, 2022 to 2032 Figure 85: South Asia Market Value (US$ Million) Analysis by Country, 2017 to 2032 Figure 86: South Asia Market Value Share (%) and BPS Analysis by Country, 2022 to 2032 Figure 87: South Asia Market Y-o-Y Growth (%) Projections by Country, 2022 to 2032 Figure 88: South Asia Market Value (US$ Million) Analysis by Product Type, 2017 to 2032 Figure 89: South Asia Market Value Share (%) and BPS Analysis by Product Type, 2022 to 2032 Figure 90: South Asia Market Y-o-Y Growth (%) Projections by Product Type, 2022 to 2032 Figure 91: South Asia Market Value (US$ Million) Analysis by End-use, 2017 to 2032 Figure 92: South Asia Market Value Share (%) and BPS Analysis by End-use, 2022 to 2032 Figure 93: South Asia Market Y-o-Y Growth (%) Projections by End-use, 2022 to 2032 Figure 94: South Asia Market Value (US$ Million) Analysis by Discard process, 2017 to 2032 Figure 95: South Asia Market Value Share (%) and BPS Analysis by Discard process, 2022 to 2032 Figure 96: South Asia Market Y-o-Y Growth (%) Projections by Discard process, 2022 to 2032 Figure 97: South Asia Market Attractiveness by Product Type, 2022 to 2032 Figure 98: South Asia Market Attractiveness by End-use, 2022 to 2032 Figure 99: South Asia Market Attractiveness by Discard process, 2022 to 2032 Figure 100: South Asia Market Attractiveness by Country, 2022 to 2032 Figure 101: East Asia Market Value (US$ Million) by Product Type, 2022 to 2032 Figure 102: East Asia Market Value (US$ Million) by End-use, 2022 to 2032 Figure 103: East Asia Market Value (US$ Million) by Discard process, 2022 to 2032 Figure 104: East Asia Market Value (US$ Million) by Country, 2022 to 2032 Figure 105: East Asia Market Value (US$ Million) Analysis by Country, 2017 to 2032 Figure 106: East Asia Market Value Share (%) and BPS Analysis by Country, 2022 to 2032 Figure 107: East Asia Market Y-o-Y Growth (%) Projections by Country, 2022 to 2032 Figure 108: East Asia Market Value (US$ Million) Analysis by Product Type, 2017 to 2032 Figure 109: East Asia Market Value Share (%) and BPS Analysis by Product Type, 2022 to 2032 Figure 110: East Asia Market Y-o-Y Growth (%) Projections by Product Type, 2022 to 2032 Figure 111: East Asia Market Value (US$ Million) Analysis by End-use, 2017 to 2032 Figure 112: East Asia Market Value Share (%) and BPS Analysis by End-use, 2022 to 2032 Figure 113: East Asia Market Y-o-Y Growth (%) Projections by End-use, 2022 to 2032 Figure 114: East Asia Market Value (US$ Million) Analysis by Discard process, 2017 to 2032 Figure 115: East Asia Market Value Share (%) and BPS Analysis by Discard process, 2022 to 2032 Figure 116: East Asia Market Y-o-Y Growth (%) Projections by Discard process, 2022 to 2032 Figure 117: East Asia Market Attractiveness by Product Type, 2022 to 2032 Figure 118: East Asia Market Attractiveness by End-use, 2022 to 2032 Figure 119: East Asia Market Attractiveness by Discard process, 2022 to 2032 Figure 120: East Asia Market Attractiveness by Country, 2022 to 2032 Figure 121: Oceania Market Value (US$ Million) by Product Type, 2022 to 2032 Figure 122: Oceania Market Value (US$ Million) by End-use, 2022 to 2032 Figure 123: Oceania Market Value (US$ Million) by Discard process, 2022 to 2032 Figure 124: Oceania Market Value (US$ Million) by Country, 2022 to 2032 Figure 125: Oceania Market Value (US$ Million) Analysis by Country, 2017 to 2032 Figure 126: Oceania Market Value Share (%) and BPS Analysis by Country, 2022 to 2032 Figure 127: Oceania Market Y-o-Y Growth (%) Projections by Country, 2022 to 2032 Figure 128: Oceania Market Value (US$ Million) Analysis by Product Type, 2017 to 2032 Figure 129: Oceania Market Value Share (%) and BPS Analysis by Product Type, 2022 to 2032 Figure 130: Oceania Market Y-o-Y Growth (%) Projections by Product Type, 2022 to 2032 Figure 131: Oceania Market Value (US$ Million) Analysis by End-use, 2017 to 2032 Figure 132: Oceania Market Value Share (%) and BPS Analysis by End-use, 2022 to 2032 Figure 133: Oceania Market Y-o-Y Growth (%) Projections by End-use, 2022 to 2032 Figure 134: Oceania Market Value (US$ Million) Analysis by Discard process, 2017 to 2032 Figure 135: Oceania Market Value Share (%) and BPS Analysis by Discard process, 2022 to 2032 Figure 136: Oceania Market Y-o-Y Growth (%) Projections by Discard process, 2022 to 2032 Figure 137: Oceania Market Attractiveness by Product Type, 2022 to 2032 Figure 138: Oceania Market Attractiveness by End-use, 2022 to 2032 Figure 139: Oceania Market Attractiveness by Discard process, 2022 to 2032 Figure 140: Oceania Market Attractiveness by Country, 2022 to 2032 Figure 141: MEA Market Value (US$ Million) by Product Type, 2022 to 2032 Figure 142: MEA Market Value (US$ Million) by End-use, 2022 to 2032 Figure 143: MEA Market Value (US$ Million) by Discard process, 2022 to 2032 Figure 144: MEA Market Value (US$ Million) by Country, 2022 to 2032 Figure 145: MEA Market Value (US$ Million) Analysis by Country, 2017 to 2032 Figure 146: MEA Market Value Share (%) and BPS Analysis by Country, 2022 to 2032 Figure 147: MEA Market Y-o-Y Growth (%) Projections by Country, 2022 to 2032 Figure 148: MEA Market Value (US$ Million) Analysis by Product Type, 2017 to 2032 Figure 149: MEA Market Value Share (%) and BPS Analysis by Product Type, 2022 to 2032 Figure 150: MEA Market Y-o-Y Growth (%) Projections by Product Type, 2022 to 2032 Figure 151: MEA Market Value (US$ Million) Analysis by End-use, 2017 to 2032 Figure 152: MEA Market Value Share (%) and BPS Analysis by End-use, 2022 to 2032 Figure 153: MEA Market Y-o-Y Growth (%) Projections by End-use, 2022 to 2032 Figure 154: MEA Market Value (US$ Million) Analysis by Discard process, 2017 to 2032 Figure 155: MEA Market Value Share (%) and BPS Analysis by Discard process, 2022 to 2032 Figure 156: MEA Market Y-o-Y Growth (%) Projections by Discard process, 2022 to 2032 Figure 157: MEA Market Attractiveness by Product Type, 2022 to 2032 Figure 158: MEA Market Attractiveness by End-use, 2022 to 2032 Figure 159: MEA Market Attractiveness by Discard process, 2022 to 2032 Figure 160: MEA Market Attractiveness by Country, 2022 to 2032
Need specific information?
Request CustomizationExplore Packaging Insights
View Reports