The bag closure clips market is projected to grow from USD 1,847 million in 2025 to USD 3,125.2 million by 2035, advancing at a 5.4% CAGR as packaged food consumption, organized retail expansion, and demand for convenient resealable formats continue to rise across global food ecosystems. Adoption is strongest in bakery, fresh produce, and snack packaging, where closure clips serve as critical freshness-preservation tools. Plastic clips, holding a dominant 64% share, lead material usage due to low manufacturing cost, high flexibility, and compatibility with manual and automated bagging lines. Growing emphasis on hygiene, tamper-evidence, and reusability is reinforcing clip adoption across both food processing and retail environments.
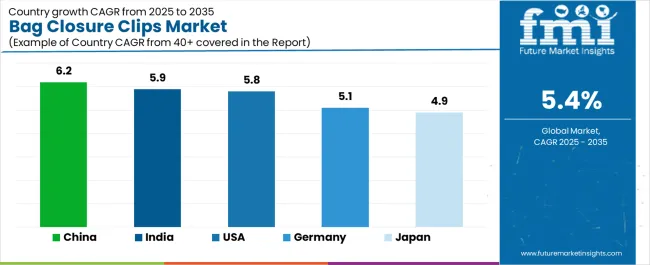
Growth momentum is led by China (6.2% CAGR) and India (5.9%), supported by retail modernization and packaged food penetration, while the United States (5.8%), Germany (5.1%), and Japan (4.9%) drive steady expansion through advanced bakery systems and high-speed packaging operations. North America and Europe remain innovation hubs, while Asia-Pacific contributes high-volume adoption through expanding supermarket networks. Competitive activity is shaped by leading players such as Kwik Lok, Bedford Industries, Schutte Bagclosures, ITW Envopak, and Petersime, who are strengthening their portfolios with tamper-evident clips, customized molding, and emerging bio-based material variants.
A key dynamic behind market expansion is the strong performance of the global bakery sector. Bread loaves, rolls, buns, pastries, and store-baked items rely heavily on closure clips as the primary sealing method due to their reliability, low cost, and suitability for high-speed packaging lines. Clip-sealed bread bags allow consumers to reseal packaging multiple times, directly supporting freshness retention in products with short shelf life. As supermarkets invest in in-store bakery offerings and packaged bakery lines expand across developing economies, demand for closure clips grows proportionally.
On the industrial side, closure clips are used in foodservice, institutional kitchens, and commercial catering, where bulk ingredients and large-format bags require quick resealing during daily operations. Their ease of handling and compatibility with thick-gauge bags support their adoption in high-volume environments.
Innovation in clip materials, shapes, and mechanisms is influencing competitive differentiation. Manufacturers are introducing ergonomic locking systems, color-coded identifiers, premium-grade plastics, reinforced wires, and improved hinges designed for repeated use. Automated clip-application systems used in high-speed food production lines also shape product specifications and require clips with precise tolerances and consistent performance.
Regionally, North America and Europe lead adoption due to strong packaged bakery consumption, advanced retail networks, and high household usage rates. Asia-Pacific is emerging quickly as packaged food penetration rises and snacking trends strengthen in China, India, Indonesia, and Southeast Asia.
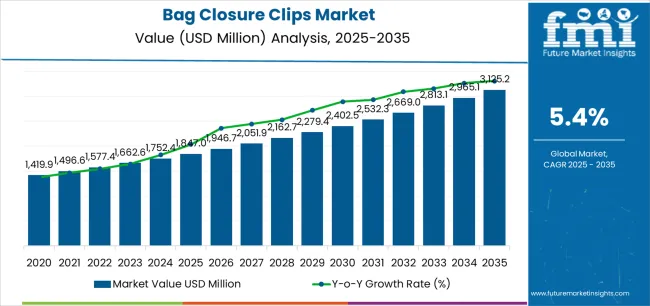
The bag closure clips market demonstrates distinct growth phases with varying market characteristics and competitive dynamics. Between 2025 and 2030, the market progresses through its packaging convenience adoption phase, expanding from USD 1,847 million to USD 2,381 million with steady annual increments averaging 5.2% growth. This period showcases the transition from basic wire clips to advanced systems with enhanced gripping capabilities and integrated tamper-evident features becoming mainstream options.
The 2025-2030 phase adds USD 534 million to market value, representing 42% of total decade expansion. Market maturation factors include standardization of closure specifications, declining material costs for specialty plastics, and increasing retailer awareness of clip benefits reaching 65-70% effectiveness in food packaging applications.
Competitive landscape evolution during this period features established manufacturers like Kwik Lok Corporation and Bedford Industries expanding their product portfolios while new entrants focus on specialized biodegradable solutions and enhanced sealing technology.
From 2030 to 2035, market dynamics shift toward advanced customization and multi-sector deployment, with growth accelerating from USD 2,381 million to USD 3,125.2 million, representing an addition of USD 743 million, or 31% of total expansion.
This phase transition logic centers on universal closure systems, integration with automated bagging equipment, and deployment across diverse application scenarios, thereby becoming a standard rather than a specialized sealing format. The competitive environment matures with focus shifting from basic closure functionality to comprehensive freshness preservation performance and compatibility with high-speed packaging operations.
The market demonstrates strong fundamentals with plastic systems capturing a dominant share through superior flexibility and cost-effective manufacturing capabilities. Food packaging applications drive primary demand, supported by increasing freshness preservation requirements and consumer convenience management solutions.
Geographic expansion remains concentrated in developed markets with established retail infrastructure, while emerging economies show accelerating adoption rates driven by organized retail growth and rising packaged food consumption.
At-a-Glance Metrics
| Metric | Value |
|---|---|
| Market Value (2025) | USD 1,847 million |
| Market Forecast (2035) | USD 3,125.2 million |
| Growth Rate | 5.40% CAGR |
| Leading Material Type | Plastic |
| Primary Application | Food Packaging Segment |
Market expansion rests on three fundamental shifts driving adoption across food packaging and retail sectors.
However, growth faces headwinds from material cost variations that differ across manufacturing sources regarding resin prices and supply chain logistics, potentially limiting profit margins in price-sensitive application categories. Automation compatibility also persists regarding equipment integration and application speed that may increase operational complexity in markets with demanding production throughput standards.
The bag closure clips market represents a compelling intersection of packaging convenience innovation, freshness preservation enhancement, and sealing reliability management. With robust growth projected from USD 1,847 million in 2025 to USD 3,125.2 million by 2035 at a 5.40% CAGR, this market is driven by increasing packaged food trends, bakery product protection requirements, and consumer demand for resealable packaging formats.
The market's expansion reflects a fundamental shift in how food manufacturers and retailers approach product closure infrastructure. Strong growth opportunities exist across diverse applications, from food packaging operations requiring freshness protection to agricultural facilities demanding produce sealing solutions.
Geographic expansion is particularly pronounced in Asia-Pacific markets, led by China (6.2% CAGR) and India (5.9% CAGR), while established markets in North America and Europe drive innovation and specialized segment development.
The dominance of plastic systems and food packaging applications underscores the importance of proven gripping technology and tamper-evidence in driving adoption. Material durability and application complexity remain key challenges, creating opportunities for companies that can deliver reliable performance while maintaining operational efficiency.
Primary Classification: The market segments by material type into plastic, metal, and paper categories, representing the evolution from basic wire closures to advanced polymer-based clips for comprehensive sealing operations.
Secondary Breakdown: Application segmentation divides the market into food packaging, bakery, agriculture, household, industrial, and others sectors, reflecting distinct requirements for grip strength, reusability, and freshness preservation.
Regional Classification: Geographic distribution covers North America, Europe, Asia Pacific, Latin America, and the Middle East & Africa, with developed markets leading innovation while emerging economies show accelerating growth patterns driven by organized retail expansion programs.
The segmentation structure reveals technology progression from standard plastic clips toward integrated tamper-evident platforms with enhanced sealing and color-coding capabilities, while application diversity spans from food packaging operations to agricultural facilities requiring comprehensive freshness protection and long-term reusability solutions.
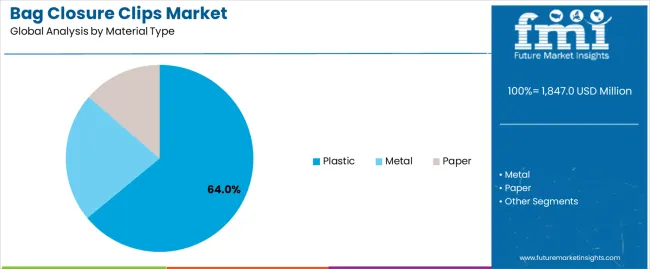
Plastic segment is estimated to account for 64% of the bag closure clips market share in 2025. The segment's leading position stems from its fundamental role as a critical component in food sealing applications and its extensive use across multiple packaging and retail sectors. Plastic's dominance is attributed to its superior flexibility, including molding versatility, color customization, and cost-effective manufacturing that make it indispensable for closure operations.
Market Position: Plastic systems command the leading position in the bag closure clips market through advanced injection molding technologies, including comprehensive design options, size versatility, and reliable gripping performance that enable manufacturers to deploy closure solutions across diverse application environments.
Value Drivers: The segment benefits from food manufacturer preference for proven polymer materials that provide exceptional sealing without requiring complex installation equipment. Cost-effective manufacturing processes enable deployment in bread packaging, produce sealing, and agricultural applications where gripping performance and affordability represent critical selection requirements.
Competitive Advantages: Plastic systems differentiate through excellent grip strength, proven reusability, and compatibility with automated bagging systems that enhance sealing capabilities while maintaining economical operational profiles suitable for diverse food packaging applications.
Key market characteristics:
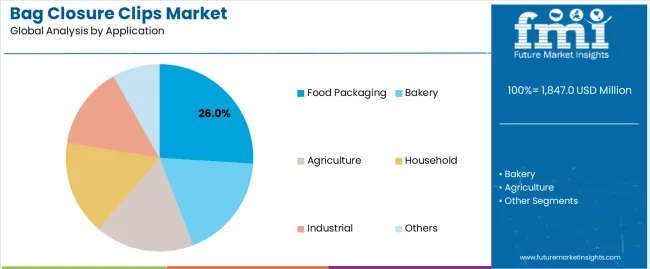
Food packaging segment is projected to hold 48% of the bag closure clips market share in 2025. The segment's market leadership is driven by the extensive use of bag closure clips in bread bagging, produce packaging, snack food sealing, and frozen food closure, where clips serve as both a sealing mechanism and freshness preservation tool. The food industry's consistent investment in packaging materials supports the segment's dominant position.
Market Context: Food packaging applications dominate the market due to widespread adoption of closure clip materials and increasing focus on food safety management, product freshness, and consumer convenience that enhance retail appeal while maintaining product quality.
Appeal Factors: Food manufacturers prioritize freshness preservation, easy resealing, and integration with bagging protocols that enable coordinated deployment across multiple product lines. The segment benefits from substantial food safety requirements and retail standards that emphasize reliable closure for packaged goods and bakery applications.
Growth Drivers: Organized retail expansion programs incorporate bag closure clips as standard components for bread products and fresh produce. At the same time, food industry initiatives are increasing demand for closure systems that comply with food contact regulations and enhance product presentation.
Market Challenges: Material migration concerns and application speed may limit deployment flexibility in high-temperature packaging or extreme production scenarios.
Application dynamics include:
Growth Accelerators: Packaged food consumption drives primary adoption as closure clip systems provide exceptional sealing capabilities that enable freshness preservation without excessive packaging investment, supporting product quality and consumer satisfaction that require convenient resealing formats.
Retail expansion accelerates market growth as grocery chains seek cost-effective closure solutions that maintain product freshness during display while enhancing shelf appeal through reliable sealing mechanisms. Automation increases worldwide, creating sustained demand for closure systems that complement high-speed bagging operations and provide competitive advantages in food manufacturing.
Growth Inhibitors: Material compatibility challenges differ across food contact regulations regarding resin specifications and chemical migration, which may limit market penetration and reliability in direct food contact categories with demanding safety requirements.
Application speed persists regarding manual installation methods and automated system integration that may increase labor costs in large-scale operations with specialized bagging standards. Market fragmentation across multiple clip designs and size specifications creates compatibility concerns between different bagging methods and existing packaging infrastructure.
Market Evolution Patterns: Adoption accelerates in food packaging and bakery sectors where freshness preservation justifies material investments, with geographic concentration in developed markets transitioning toward mainstream adoption in emerging economies driven by organized retail expansion and packaged food modernization.
Technology development focuses on enhanced grip strength, improved tamper-evidence, and integration with automated bagging systems that optimize product sealing and quality assurance. The market could face disruption if alternative closure materials or technology innovations significantly challenge clip advantages in food packaging applications.
| Country | CAGR (2025 to 2035) |
|---|---|
| China | 6.2% |
| India | 5.9% |
| USA | 5.8% |
| Germany | 5.1% |
| Japan | 4.9% |
The bag closure clips market demonstrates varied regional dynamics with Growth Leaders including China (6.2% CAGR) and India (5.9% CAGR) driving expansion through organized retail growth and packaged food modernization. Steady Performers encompass the USA (5.8% CAGR), Germany (5.1% CAGR), and Japan (4.9% CAGR), benefiting from established food packaging sectors and bakery industry adoption.
Regional synthesis reveals Asia-Pacific markets leading growth through retail expansion and food packaging development, while European countries maintain steady expansion supported by specialized bakery applications and food safety requirements. North American markets show strong growth driven by commercial food processing and automated bagging applications.
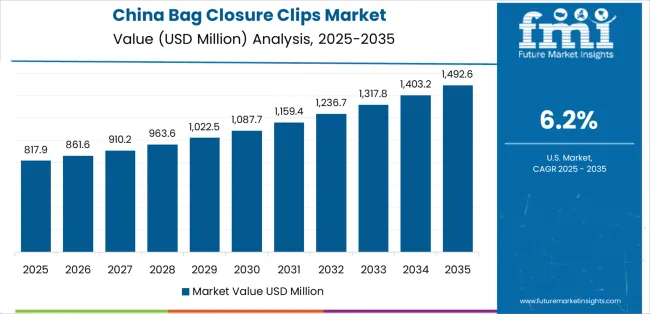
China establishes regional leadership through explosive organized retail expansion and comprehensive packaged food modernization, integrating advanced closure clip systems as standard components in bread packaging and produce sealing applications.
The country's 6.2% CAGR through 2035 reflects government initiatives promoting food safety standards and domestic retail activity that mandate the use of reliable closure systems in food operations. Growth concentrates in major consumption regions, including Beijing-Shanghai-Guangzhou, Yangtze River Delta, and Pearl River Delta, where supermarket chains showcase integrated closure clip systems that appeal to domestic food manufacturers seeking convenient sealing and international quality standards.
Chinese manufacturers are developing innovative closure clip solutions that combine local production advantages with international food safety specifications, including tamper-evident features and advanced grip capabilities.
Strategic Market Indicators:
The Indian market emphasizes food packaging applications, including rapid organized retail development and comprehensive bakery expansion that increasingly incorporates bag closure clips for bread sealing and produce packaging applications.
The country is projected to show a 5.9% CAGR through 2035, driven by massive retail activity under government food safety programs and consumer demand for affordable, reliable closure systems. Indian food manufacturers prioritize cost-effectiveness with closure clips delivering freshness protection through economical material usage and efficient application capabilities.
Technology deployment channels include major bakery chains, retail supermarkets, and food processors that support high-volume usage for domestic and packaged goods applications.
Performance Metrics:
The USA market emphasizes advanced closure clip features, including innovative tamper-evident technologies and integration with comprehensive automated bagging platforms that manage product sealing, freshness preservation, and quality assurance applications through unified packaging systems.
The country is projected to show a 5.8% CAGR through 2035, driven by commercial food processing expansion under retail programs and consumer demand for convenient, reliable sealing systems. American food manufacturers prioritize product freshness with closure clips delivering comprehensive sealing through reinforced grip and easy-release integration.
Technology deployment channels include major bakery operations, food processing facilities, and retail chains that support custom development for high-speed bagging operations.
Performance Metrics:
In Munich, Hamburg, and Frankfurt, German bakeries and food manufacturers are implementing advanced closure clip systems to enhance sealing capabilities and support product freshness that aligns with food safety protocols and quality standards. The German market demonstrates sustained growth with a 5.1% CAGR through 2035, driven by bakery innovation programs and food processing investments that emphasize reliable closure systems for bread and packaged goods applications.
German food facilities are prioritizing closure clip systems that provide exceptional grip strength while maintaining compliance with food contact regulations and minimizing freshness degradation, particularly important in artisanal bakery and organic food operations.
Market expansion benefits from food quality programs that mandate reliable closure in packaging specifications, creating sustained demand across Germany's bakery and food processing sectors, where product integrity and material safety represent critical requirements.
Strategic Market Indicators:
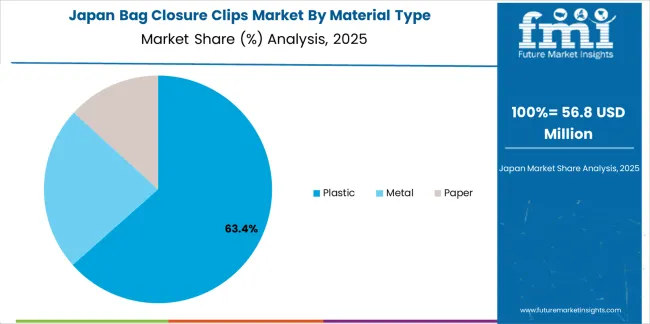
Japan's sophisticated food packaging market demonstrates meticulous closure clip deployment, growing at 4.9% CAGR, with documented operational excellence in bakery protection and food safety applications through integration with existing packaging systems and quality assurance infrastructure.
The country leverages engineering expertise in polymer science and manufacturing precision to maintain market leadership. Food processing centers, including Tokyo, Osaka, and Nagoya, showcase advanced installations where closure clip systems integrate with comprehensive automated bagging platforms and quality management systems to optimize product sealing and freshness preservation.
Japanese food manufacturers prioritize sealing precision and material reliability in product development, creating demand for premium closure clip systems with advanced features, including microbial resistance and integration with modified atmosphere packaging protocols. The market benefits from established food processing infrastructure and willingness to invest in specialized closure technologies that provide superior freshness protection and regulatory compliance.
Market Intelligence Brief:
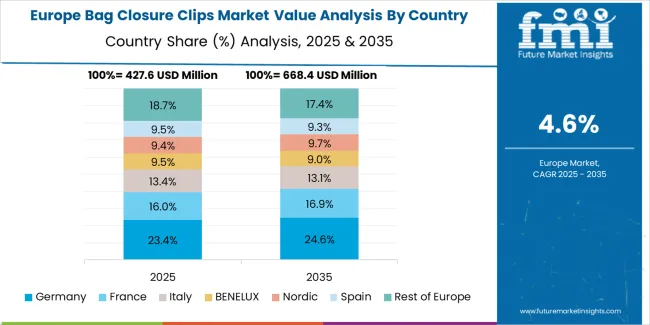
The bag closure clips market in Europe is projected to grow from USD 478 million in 2025 to USD 762 million by 2035, registering a CAGR of 4.8% over the forecast period. Germany is expected to maintain its leadership position with a 32.4% market share in 2025, declining slightly to 31.8% by 2035, supported by its bakery excellence and major food processing centers, including Bavaria and North Rhine-Westphalia.
France follows with a 26.7% share in 2025, projected to reach 27.3% by 2035, driven by comprehensive bakery tradition and artisanal food initiatives. The United Kingdom holds a 19.2% share in 2025, expected to maintain 19.6% by 2035 through established food retail sectors and supermarket chain adoption.
Italy commands an 11.8% share, while Spain accounts for 7.4% in 2025. The Rest of Europe region is anticipated to gain momentum, expanding its collective share from 2.5% to 2.9% by 2035, attributed to increasing organized retail development in Eastern European countries and emerging Nordic food facilities implementing closure clip programs.
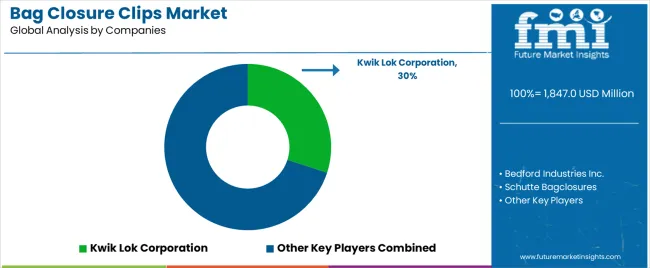
The Bag Closure Clips Market is expanding steadily as food manufacturers, bakeries, fresh produce suppliers, and packaging service providers continue to prioritize secure, tamper-evident, and cost-effective sealing solutions for flexible packaging. Bag closure clips remain indispensable in high-throughput production lines because they offer fast application, reusability, and compatibility with a wide range of plastic and paper bags. Growth is further supported by rising consumption of packaged bakery items, produce, frozen foods, and pet food, where freshness retention and traceability have become essential. Increasing automation in packaging lines and stricter hygiene standards are also pushing companies to adopt more reliable closure systems.
Kwik Lok Corporation and Bedford Industries Inc. lead the global landscape with long-established clip technologies designed for food safety, durability, and ease of use. Their closure systems are widely used in large-scale bakery, produce, meat, and snack packaging applications, supported by robust manufacturing footprints and machine integration capabilities. Schutte Bagclosures and ITW Envopak supply diversified clip formats, including plastic, fiber-based, and tamper-evident versions tailored for automated lines and retail packaging standards.
Niche and regional manufacturers such as Horne Manufacturing, Plas-Ties Co., Anderson & Forrester Ltd, and TruSeal Pty Ltd specialize in clip variants and application equipment suited for small to mid-size food processors. Polyclip System Corp., known for its expertise in clipping systems for meat processing, also plays a key role in technical sealing applications. As sustainability continues to shape packaging choices, companies are increasingly exploring recyclable and fiber-based clip solutions to meet evolving environmental expectations while ensuring reliable product sealing performance.
| Item | Value |
|---|---|
| Quantitative Units | USD 1,847 million |
| Material Type | Plastic, Metal, Paper |
| Application | Food Packaging, Bakery, Agriculture, Household, Industrial, Others |
| Regions Covered | North America, Europe, Asia Pacific, Latin America, Middle East & Africa |
| Countries Covered | U.S., Germany, Japan, China, India, and 25+ additional countries |
| Key Companies Profiled | Kwik Lok Corporation, Bedford Industries Inc., Schutte Bagclosures, ITW Envopak, Petersime NV, Horne Manufacturing, Plas-Ties Co., Anderson & Forrester Ltd, TruSeal Pty Ltd, Polyclip System Corp. |
| Additional Attributes | Dollar sales by material type and application categories, regional adoption trends across North America, Europe, and Asia-Pacific, competitive landscape with polymer manufacturers and packaging suppliers, food manufacturer preferences for grip strength and tamper-evidence, integration with automated bagging equipment and sealing systems, innovations in bio-based materials and color-coding technology, and development of specialized closure solutions with enhanced freshness preservation and food safety capabilities |
The global bag closure clips market is estimated to be valued at USD 1,847.0 million in 2025.
The market size for the bag closure clips market is projected to reach USD 3,125.2 million by 2035.
The bag closure clips market is expected to grow at a 5.4% CAGR between 2025 and 2035.
The key product types in bag closure clips market are plastic, metal and paper.
In terms of application, food packaging segment to command 0.0% share in the bag closure clips market in 2025.


Our Research Products

The "Full Research Suite" delivers actionable market intel, deep dives on markets or technologies, so clients act faster, cut risk, and unlock growth.

The Leaderboard benchmarks and ranks top vendors, classifying them as Established Leaders, Leading Challengers, or Disruptors & Challengers.

Locates where complements amplify value and substitutes erode it, forecasting net impact by horizon

We deliver granular, decision-grade intel: market sizing, 5-year forecasts, pricing, adoption, usage, revenue, and operational KPIs—plus competitor tracking, regulation, and value chains—across 60 countries broadly.

Spot the shifts before they hit your P&L. We track inflection points, adoption curves, pricing moves, and ecosystem plays to show where demand is heading, why it is changing, and what to do next across high-growth markets and disruptive tech

Real-time reads of user behavior. We track shifting priorities, perceptions of today’s and next-gen services, and provider experience, then pace how fast tech moves from trial to adoption, blending buyer, consumer, and channel inputs with social signals (#WhySwitch, #UX).

Partner with our analyst team to build a custom report designed around your business priorities. From analysing market trends to assessing competitors or crafting bespoke datasets, we tailor insights to your needs.
Supplier Intelligence
Discovery & Profiling
Capacity & Footprint
Performance & Risk
Compliance & Governance
Commercial Readiness
Who Supplies Whom
Scorecards & Shortlists
Playbooks & Docs
Category Intelligence
Definition & Scope
Demand & Use Cases
Cost Drivers
Market Structure
Supply Chain Map
Trade & Policy
Operating Norms
Deliverables
Buyer Intelligence
Account Basics
Spend & Scope
Procurement Model
Vendor Requirements
Terms & Policies
Entry Strategy
Pain Points & Triggers
Outputs
Pricing Analysis
Benchmarks
Trends
Should-Cost
Indexation
Landed Cost
Commercial Terms
Deliverables
Brand Analysis
Positioning & Value Prop
Share & Presence
Customer Evidence
Go-to-Market
Digital & Reputation
Compliance & Trust
KPIs & Gaps
Outputs
Full Research Suite comprises of:
Market outlook & trends analysis
Interviews & case studies
Strategic recommendations
Vendor profiles & capabilities analysis
5-year forecasts
8 regions and 60+ country-level data splits
Market segment data splits
12 months of continuous data updates
DELIVERED AS:
PDF EXCEL ONLINE
Competitive Breakdown of Bag Closure Clip Providers
Bag Closures Market Size and Share Forecast Outlook 2025 to 2035
Bag Clips Market Insights – Demand, Trends & Forecast 2025 to 2035
Bag Feed Seal Pouch Packaging Machine Market Size and Share Forecast Outlook 2025 to 2035
Bag in Tube Market Size and Share Forecast Outlook 2025 to 2035
Bagasse Tableware Products Market Size and Share Forecast Outlook 2025 to 2035
Bag-in-box Packaging Market Size and Share Forecast Outlook 2025 to 2035
Bag Making Machine Market Size and Share Forecast Outlook 2025 to 2035
Bag On Valve Product Market Size and Share Forecast Outlook 2025 to 2035
Bagging Equipment Market Size and Share Forecast Outlook 2025 to 2035
Bag Sealer Market Analysis - Size and Share Forecast Outlook 2025 to 2035
Bagging Machine Market Size and Share Forecast Outlook 2025 to 2035
Bag-in-Bottle Market Size and Share Forecast Outlook 2025 to 2035
Bagasse Disposable Cutlery Market Size and Share Forecast Outlook 2025 to 2035
Bagasse Bowls Market Size and Share Forecast Outlook 2025 to 2035
Bag-in-Box Filler Market Insights - Growth & Forecast 2025 to 2035
Bag Market Insights - Growth & Demand 2025 to 2035
Baggage Scanner Market Growth, Trends & Forecast 2025 to 2035
Bag Re-sealer Market Growth – Size, Trends & Forecast 2025 to 2035
Competitive Landscape of Bag-in-Tube Market Share

Thank you!
You will receive an email from our Business Development Manager. Please be sure to check your SPAM/JUNK folder too.
Chat With
MaRIA