Dental Bleaching Agent Market Size and Share Forecast (2023 to 2033)

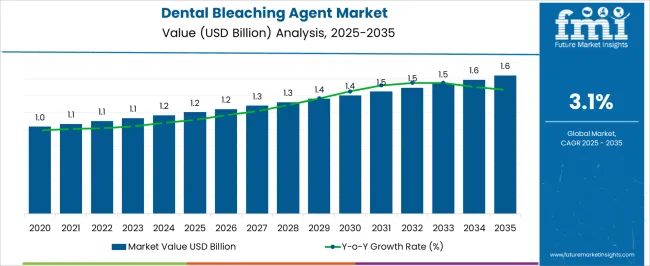
The global dental bleaching agent market size is expected to rise at a CAGR of 3.3% in the anticipated time frame. The market value is projected to increase from USD 1,166.3 million in 2023 to USD 1,608.9 million by 2033. The dental bleaching agent market was valued at USD 1,129.3 million at the end of 2022 and is expected to exhibit a y-o-y growth of 3.3% in 2023.

Attributes Details
Dental Bleaching Agent Market Size (2022A) USD 1,129.3 million
Dental Bleaching Agent Market Estimated Size (2023E) USD 1,166.3 million
Projected Dental Bleaching Agent Market Valuation (2033F) USD 1,608.9 million
Value-based CAGR (2023 to 2033) 3.3%

In the field of cosmetic dentistry, dental bleaching agents are projected to deliver a transformative solution for addressing tooth discoloration and stains resulting from multiple factors. These treatments are expected to be tailored to enhance the whiteness of teeth by effectively breaking down or oxidizing the chromogens in the tooth enamel.

Individuals seeking a brighter smile can trust in the power of dental bleaching to bring about a noticeable change in their teeth's appearance. The market for dental bleaching agents continues to be driven by the need for better dental aesthetics and a brighter smile.

With the surging population choosing to improve their oral aesthetics, the market has made great progress. Emerging countries have created significant disposable income, which is the key reason why the marketplace is expanding strongly.

The general geriatric population has fueled the development of this market with age-related oral diseases. Aspects such as the growing popularity of cosmetic dentistry, rising medical dental tourism, and the overview of countless government initiatives toward public oral well-being care are a handful of the factors.

According to a survey conducted in the United Kingdom in 2018, more people are choosing cosmetic surgery due to motivating factors such as life satisfaction, self-esteem, and physical attractiveness. All of these people had one thing in common: they had been exposed to a lot of media.

Such aspects have led individuals to elect for beauty and restorative measures such as teeth whitening, which is probable to fuel market expansion. Social media alone has played a significant role in endorsing at-home dental whitening procedures.

Historical Analysis vs. Forecast of Dental Bleaching Agent Market (2018 to 2033)

The global dental bleaching agent market recorded a decent CAGR of 2.2% in the last five years, from 2018 to 2022. The market value for dental bleaching agents was around 17.0% of the total USD 6,643.0 million of the global teeth whitening market.

Historical CAGR (2018 to 2022) 2.2%
Forecast CAGR (2023 to 2033) 17.0%

As awareness of aesthetics grows, more and more people want a brighter and whiter smile to improve their appearance. Teeth whitening is a non-invasive and cost-effective way to achieve this. Images of celebrities, influencers, and peers with bright white smiles on social media and in the media are encouraging people to undergo teeth whitening treatment to meet prevailing beauty standards.

Aesthetic issues are also often about self-confidence. A whiter smile can boost self-esteem and self-confidence, which encourages people to undergo teeth whitening. In competitive job markets, a confident and appealing appearance can give job applicants an edge.

A bright smile can make a positive impression during job interviews and motivate people to invest in teeth whitening. For special occasions such as weddings, reunions, or anniversary celebrations, several people value aesthetics. They seek teeth whitening treatments to look good on these occasions.

Certain dietary habits such as coffee, tea, wine, and specific foods can lead to tooth discoloration over time. People with aesthetic concerns are more likely to seek teeth whitening to remove stains and restore their smile.

Over time, more and more emphasis has been placed on creating bleaching agents that are both operative and safe. Several efforts have also been made to reduce tooth sensitivity, a mutual side effect of teeth whitening.

Teeth whitening has become an indispensable part of the cosmetic dentistry procedure. It is repeatedly combined with other treatments such as veneers, bonding, and gum contouring for a complete smile. To meet the growing demand for organic and natural products, manufacturers have begun incorporating these elements into bleaches.

Trends, Challenges, and Opportunities in the Dental Bleaching Agent Sector

Attributes Key Factors
Dental Bleaching Agent Market Trends
  • Demand for cosmetic dental procedures is increasing. Patients are progressively looking for teeth whitening solutions to improve their smiles.
  • New bleaching agents that are effective and safer are being introduced as a result of ongoing research and development. New formulations, delivery methods, and application strategies are among these developments.
  • Growing awareness of oral health and cosmetic dentistry, fueled by social media, online forums, and dental education, has led to an increasing demand for dental and teeth whitening products.
  • Professionally performed in-office teeth whitening procedures are gaining approval due to their immediate outcomes and controlled application.
  • The market for over-the-counter (OTC) teeth whitening kits is growing. These kits offer a more convenient and cost-effective choice for patients who want to whiten their teeth at home.
Growth Hindrances
  • In-office dental bleaching procedures are often more expensive compared to at-home or over-the-counter (OTC) teeth whitening options. The higher cost can deter price-sensitive consumers from seeking professional treatments and lead them to opt for more affordable alternatives.
  • The cost of in-office procedures can restrict access to teeth whitening treatments, particularly for individuals without dental insurance or those with limited financial resources. This can result in a smaller pool of potential patients seeking professional teeth whitening services.
  • A handful of consumers can prioritize cost-effectiveness and seek at-home teeth whitening kits or OTC products as more budget-friendly options. This preference for cost savings can lead to reduced demand for in-office procedures and dental bleaching agents used in these treatments.
  • The perceived high cost of in-office procedures can influence consumer decision-making. Individuals can postpone or forgo teeth whitening altogether, impacting the market for dental bleaching agents.
  • Manufacturers of dental bleaching agents can face competition not only from other professional-grade products but also from a wide range of OTC teeth whitening options.
Upcoming Opportunities
  • Several consumers today are becoming more conscious of the ingredients in the products they use. They prefer natural and organic options over chemical-laden products due to concerns about potential side effects and environmental impacts. This shift in consumer preference opens up a new segment of the market for natural teeth whitening products.
  • Dental bleaching agents used in traditional teeth whitening products can often cause tooth sensitivity and gum irritation. Natural and organic products are perceived as safer and gentler alternatives. Dental professionals can recommend these products to patients who have concerns about the potential risks associated with chemical bleaching agents.
  • The introduction of natural and organic teeth whitening products can expand the market for dental bleaching agents. It can attract a broader customer base that includes individuals who were previously hesitant to use teeth whitening products due to concerns about their safety or environmental impact.
  • Natural and organic products often have more environmentally friendly packaging and sourcing practices. This can appeal to consumers who prioritize sustainability, further increasing the market potential for these products.

Analysis of Top Countries Using Dental Bleaching Agents

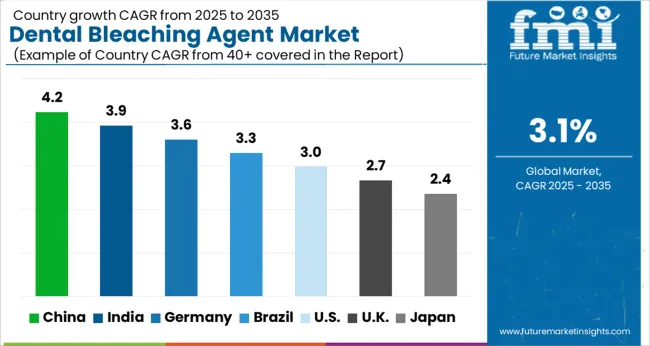
In the table below, the CAGRs of the top 5 countries are given for the review period 2023 to 2033. China and India are expected to remain dominant by exhibiting CAGRs of 6.7% and 6.8%, respectively. Japan and the United Kingdom are expected to follow with CAGRs of 3.0% and 2.0%, respectively.

Market Growth Outlook by Key Countries

Country Value CAGR
United States 1.6%
Germany 1.5%
United Kingdom 2.0%
Japan 3.0%
China 6.7%
India 6.8%

Trend for Personalized Treatment in the United States to Surge Sales

The United States held around 31.6% of the dental bleaching agent market share in 2022. It is projected to continue experiencing high growth throughout the forecast period.

Over the past few years, there has been a steady increase in demand for cosmetic dentistry in the United States. The most popular cosmetic goods include veneers, dental crowns, and bonding agents, even though tooth-whitening procedures have shown a high demand. The American Academy of Cosmetic Dentistry (AACD) estimates that cosmetic dentistry costs the country’s economy over USD 2.75 billion annually.

Celebrities and influencers often promote teeth whitening products, generating awareness and impelling consumer preferences. There is a trend toward natural and safe designs of teeth whitening agents, in line with broader customer preferences for organic and environmentally friendly products.

Dental clinics in the United States often bid personalized treatment plans, including teeth whitening, customized to each patient's needs and preferences. There is a growing market for goods designed to help patients uphold the results of teeth whitening treatments, such as special toothpaste and mouthwashes.

Increasing Popularity of Private Clinics to Spur Growth in China

China is projected to continue experiencing high growth throughout the forecast period. The country held a share of around 2.3% in 2022.

The healthcare system in China has continued to include an independent and separate area for dental care. In contrast to other fields of study, hospitals and independent clinics both offer dental care services in China.

Around 20 years ago, when establishing privately or socially supported healthcare organizations became legal, the private dental business in China started to surge. Particularly in locations where the private sector is more supported by the government and tolerated by the populace, the number of private clinics has rapidly expanded.
Shift toward Organic and Natural Cosmetics to Boost Demand in Germany

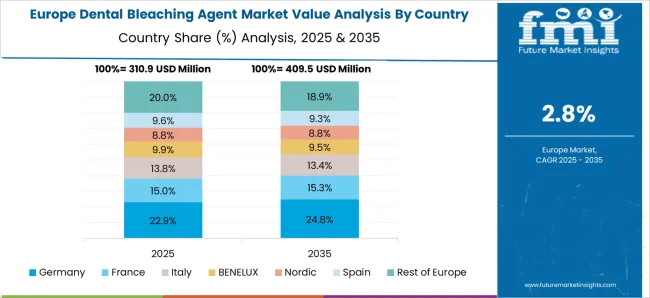
Germany held about 2.2% of the share in the global dental bleaching agent market in 2022. In Germany, dental bleaching is often carried out by dentists in a professional setting or at home with over-the-counter materials. Although OTC treatments are also available, professional teeth whitening is typically regarded as safer and more effective.

One often used active component in tooth whitening products is hydrogen peroxide. The maximum amount of hydrogen peroxide that can be used in such items has been specified by Germany. For over-the-counter products, this restriction is often around 0.1%.

Only dental experts would have access to higher concentrations. Dental bleaching chemicals are being influenced by the inclination toward natural and organic goods in the beauty and cosmetics sector.
Rising Technological Advancements and Innovation in Japan to Surge Demand

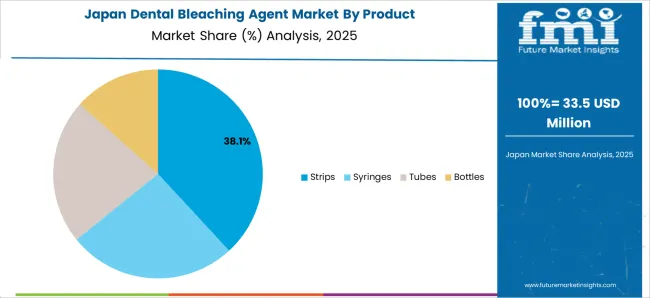
Japan's dental bleaching agent market is projected to expand at a CAGR of 3.0% by 2033. Japan is famous for its beauty and skincare industry. This trend also extends to cosmetic dentistry.

Demand for teeth whitening is increasing among customers who want to improve their smiles. Japan has stable economic development, leading to increased disposable income. This has helped motivate consumers to capitalize on cosmetic procedures, including teeth whitening.

In Japan, professional dental treatment performed in a clinic is preferred. Several consumers also prefer in-office teeth whitening procedures over at-home kits as they find them more effective and safer under professional supervision.

Japan is also known for its technological advancements and innovations. This comprises the dental industry, where current and effective teeth whitening agents and technologies are readily available in clinics.

Increasing Awareness of Dental Health to Support Demand in India

India’s dental bleaching agent market is estimated to surge at a CAGR of 6.8% by 2033. The dental care market in India is very competitive, with domestic and global companies offering a wide range of tooth whiteners and related goods.

India attaches great importance to compliance with regulations and safety standards for medical products, including teeth-whitening agents. Products must meet robust quality and safety requirements.

Increased customer awareness of oral aesthetics and accessibility of dental treatments, counting teeth whitening, have contributed to growth. Recommendations from dental specialists and influencer marketing also play an important role in inducing customer choices regarding dental products and procedures, including fillers.

There is currently a trend toward natural and safe preparations of tooth whiteners, meeting growing consumer demand for natural and environmentally friendly products. The concentration of dental hospitals in urban areas, combined with better access to healthcare services, has enabled the dental bleaching agent market in India to expand.

Dental Bleaching Agent Industry Analysis by Top Investment Segments

The table below signifies leading sub-categories under product, form, and active ingredients categories in the dental bleaching agent market. The syringe is expected to dominate the market for dental bleaching agents by exhibiting a 1.7% CAGR in the evaluation period. Under the form category, the gel segment is projected to lead the dental bleaching agent industry at a 1.6% CAGR.

Market Growth Outlook by Key Segments

Segment Value CAGR
Syringes (Product) 1.7%
Hydrogen Peroxide (Active Ingredients) 1.4%
Gel (Form) 1.6%
Retail Sales (Distribution Channel) 2.2%

Dentists to Utilize Syringes to Apply Bleaching Agents

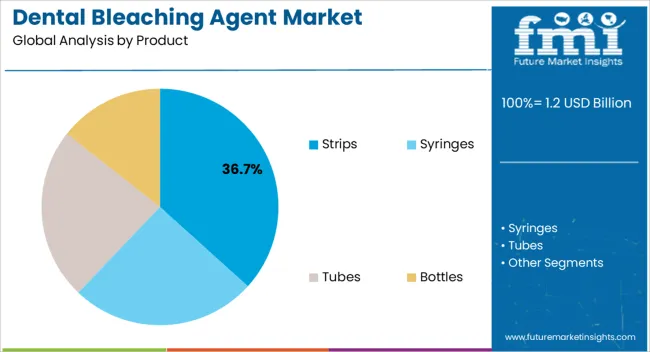
The syringe segment under the product category held a share of 40.6% in 2022. Dental whitening procedures frequently involve the use of syringes. Syringes are set to be used to administer dental bleaching agents such as hydrogen peroxide or carbamide peroxide gels.

The ability of syringes to make it possible to apply bleaching agents to the teeth in a precise and controlled manner would drive demand. These are estimated to be used by dentists or other dental experts to apply the bleaching gel directly to the teeth, ensuring equal coverage and reducing contact with delicate gum tissues.

Hydrogen Peroxide to be Increasingly Popular in Clinics

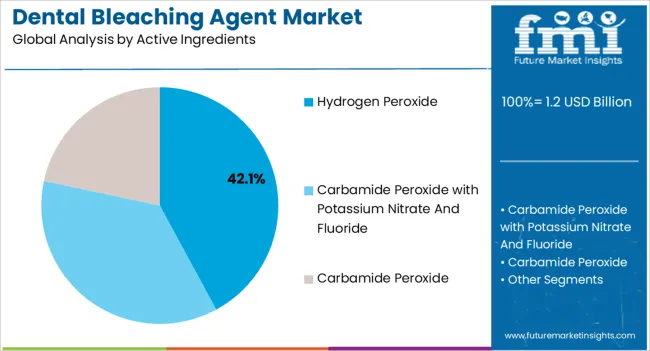
The hydrogen peroxide segment is expected to dominate the global dental bleaching agent market in terms of active ingredients through 2033. It generated a share of about 43.2% in 2022. The ability of hydrogen peroxide to effectively reduce tooth stains brought on by red wine, coffee, tea, smoking, and other sources of discoloration would drive demand.

For dental use, hydrogen peroxide is set to be available in a range of concentrations, from as little as 3% in OTC preparations to greater concentrations in specialist dentistry procedures. Hydrogen peroxide is also considered safe for dental bleaching when used as recommended.

Although hydrogen peroxide is safe for dental use when made as directed, high concentrations or improper use can lead to potential side effects. A handful of them include tooth sensitivity, gum irritation, and soft tissue damage.

Gel-based Teeth Whitening Solutions to Gain Impetus

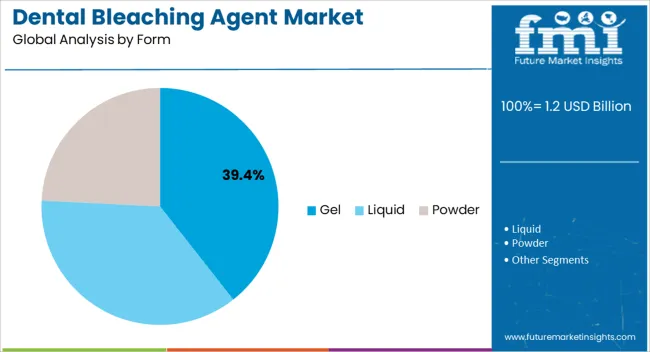
The gel segment held a share of around 46.2% in 2022 based on form. Gel-based teeth whitening products usually include a bleaching ingredient, such as carbamide or hydrogen peroxide.

Using over-the-counter kits that come with pre-filled trays or specially manufactured trays, these gels can be administered directly to the teeth. For a predetermined amount of time, the gel is in contact with the teeth, enabling the bleaching agent to remove stains and brighten the teeth. Controlled administration, which reduces contact with delicate gum tissues, and the option to tailor therapies based on patient requirements are two benefits of gel-based dental bleaching solutions.

Retail Sales of Dental Bleaching Agents to Expand by 2033

The retail sales segment based on distribution channels generated a share of around 57.6% in 2022. Drug stores and retail pharmacies are widely located and easily accessible. They are typically present in both rural and urban regions. This facilitates easy access to healthcare items, over-the-counter pharmaceuticals, and prescription drugs.

Retail pharmacies also provide services such as prescription synchronization, blister packaging, and automatic refills. These would help to enhance adherence to prescribed treatments, helping patients manage their drugs.

Retail channels further provide the key distribution platform for over-the-counter teeth whitening products. These also offer easy access to tooth whiteners, making it easy for customers to browse and buy products. This accessibility underwrites the acceptance of at-home teeth whitening.

Retailers often offer a variety of teeth whitening products, comprising strips, toothpaste, gels, pens, and teeth whitening kits. This variety allows customers to choose goods that suit their preferences and requirements.

Manufacturers of teeth whitening products often use strong marketing and branding approaches to promote their goods in retail stores. This can include packaging design, publicity campaigns, and in-store promotions.
Competitive Landscape and Strategic Positioning

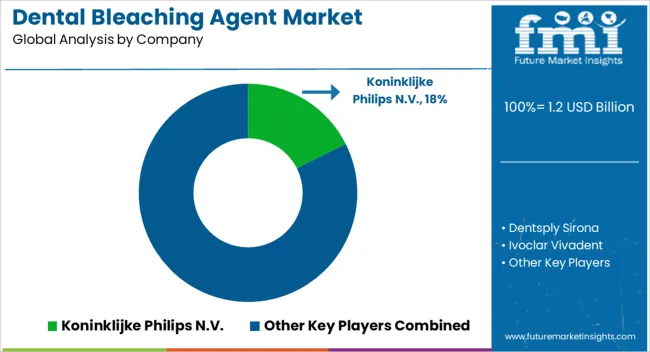
Collaboration and geographic expansions are a priority for leading dental bleaching agent companies as they work to create new product lines and expand their global consumer base. Expansion and partnership is the key strategy of leading manufacturers, such as Koninklijke Philips N.V. and Ultradent Products Inc. They aim to enhance their presence in the market and compete with other players during the assessment period.

For instance,

  • In February 2023, Philips and Candid Care joined together to develop orthodontic solutions. Through this partnership, dental professionals will be able to offer comprehensive oral healthcare that includes tooth whitening and orthodontic procedures.
  • In September 2023, Dentsply Sirona and 3Shape expanded their workflow integrations. This integration offers dentists and dental technicians simplified, secure, and interconnected technology solutions, fostering effective collaboration.
  • In 2020, Wellness launched teeth whitening toothpaste that contains no glycerin or fluoride. It only contains calcium carbonate, peppermint, stevia leaf, and extracted green tea leaf.

Scope and Coverage of the Dental Bleaching Agent Market Report

Attribute Details
Estimated Dental Bleaching Agent Market Size (2023) USD 1,166.3 million
Projected Dental Bleaching Agent (2033) USD 1,608.9 million
Value-based Industrial Tape Market CAGR (2023 to 2033) 3.3%
Forecast Period 2023 to 2033
Historical Data Available for 2018 to 2022
Market Analysis Value (USD million)
Key Regions Covered North America; Latin America; East Asia; South Asia & Pacific; Western Europe; Eastern Europe; Middle East & Africa
Key Countries Covered United States, Canada, Mexico, Brazil, Chile, China, Japan, South Korea, India, Association of Southeast Asian Nations Countries, Australia and New Zealand, Germany, Italy, France, United Kingdom, Spain, BENELUX, Nordic Countries, Russia, Hungary, Poland, Saudi Arabia, Türkiye, South Africa, and Other African Union
Key Market Segments Covered Product, Active Ingredients, Form, Distribution Channel, and Region
Key Companies Profiled

Koninklijke Philips N.V.; Dentsply Sirona; Ivoclar Vivadent; Ultradent Products Inc.; SDI Pola; VOCO GmbH; OraTech; BIOLASE, Inc.; FGM Dental Group; MYEZGOSMILE;Laser Glow Spa; Beyond International Inc.

Report Coverage Market Forecast, Competition Intelligence, Market Dynamics and Challenges, Strategic Growth Initiatives

Top Segments Studied in the Dental Bleaching Agent Market

By Product:

  • Syringes
  • Strips
  • Tubes
  • Bottles

By Active Ingredients:

  • Carbamide Peroxide with Potassium Nitrate and Fluoride
  • Carbamide Peroxide
  • Hydrogen Peroxide

By Form:

  • Liquid
  • Gel
  • Powder

By Distribution Channel:

  • Institutional Sales
    • Dental Hospitals
    • Dental Clinics
    • Group Dental Practices
  • Retail Sales
    • Retail Pharmacies
    • Drug Stores
    • Hypermarkets and Supermarkets
    • Online Sales

By Region:

  • North America
  • Latin America
  • East Asia
  • South Asia and Pacific
  • Western Europe
  • Eastern Europe
  • Middle East and Africa

Table of Content

  • 1. Executive Summary
  • 2. Market Overview
  • 3. Key Market Trends
  • 4. Value-Added Insights
  • 5. Market Background
  • 6. Global Market Demand (in Volume) Analysis 2018 to 2022 and Forecast, 2023 to 2033
  • 7. Global Market - Pricing Assessment
  • 8. Global Market Demand (in Value or Size in US$ million) Analysis 2018 to 2022 and Forecast, 2023 to 2033
  • 9. Global Market Analysis 2018 to 2022 and Forecast 2023 to 2033, By Product
    • 9.1. Syringes
    • 9.2. Strips
    • 9.3. Tubes
    • 9.4. Bottles
  • 10. Global Market Analysis 2018 to 2022 and Forecast 2023 to 2033, By Active Ingredients
    • 10.1. Carbamide Peroxide with Potassium Nitrate and Fluoride
    • 10.2. Carbamide Peroxide
    • 10.3. Hydrogen Peroxide
  • 11. Global Market Analysis 2018 to 2022 and Forecast 2023 to 2033, By Form
    • 11.1. Liquid
    • 11.2. Gel
    • 11.3. Powder
  • 12. Global Market Analysis 2018 to 2022 and Forecast 2023 to 2033, By Distribution Channel
    • 12.1. Institutional Sales
      • 12.1.1. Dental Hospitals
      • 12.1.2. Dental Clinics
      • 12.1.3. Group Dental Practices
    • 12.2. Retail Sales
      • 12.2.1. Retail Pharmacies
      • 12.2.2. Drug Stores
      • 12.2.3. Hypermarkets and Supermarkets
      • 12.2.4. Online Sales
  • 13. Global Market Analysis - Cross-Sectional Assessment By Product vs Distribution Channel
  • 14. Global Market Analysis 2018 to 2022 and Forecast 2023 to 2033, By Region
    • 14.1. North America
    • 14.2. Latin America
    • 14.3. East Asia
    • 14.4. South Asia and Pacific
    • 14.5. Western Europe
    • 14.6. Eastern Europe
    • 14.7. Middle East and Africa
  • 15. North America Market Analysis 2018 to 2022 and Forecast 2023 to 2033
  • 16. Latin America Market Analysis 2018 to 2022 and Forecast 2023 to 2033
  • 17. East Asia Market Analysis 2018 to 2022 and Forecast 2023 to 2033
  • 18. South Asia and Pacific Market Analysis 2018 to 2022 and Forecast 2023 to 2033
  • 19. Western Europe Market Analysis 2018 to 2022 and Forecast 2023 to 2033
  • 20. Eastern Europe Market Analysis 2018 to 2022 and Forecast 2023 to 2033
  • 21. Middle East and Africa Market Analysis 2018 to 2022 and Forecast 2023 to 2033
  • 22. Market Structure Analysis
  • 23. Competition Analysis
    • 23.1. Koninklijke Philips N.V.
    • 23.2. Dentsply Sirona
    • 23.3. Ivoclar Vivadent
    • 23.4. Ultradent Products Inc.
    • 23.5. SDI Pola
    • 23.6. VOCO GmbH
    • 23.7. OraTech
    • 23.8. BIOLASE, Inc.
    • 23.9. FGM Dental Group
    • 23.10. MYEZGOSMILE
    • 23.11. Laser Glow Spa
    • 23.12. Beyond International Inc.
  • 24. Assumptions and Acronyms Used
  • 25. Research Methodology

List of Tables

Table 01: Global Market Size (US$ million) Analysis, By Product, 2018 to 2033

Table 02: Global Market Volume (Units) Analysis, By Product, 2018 to 2033

Table 03: Global Market Size (US$ million) Analysis, By Active Ingredients, 2018 to 2033

Table 04: Global Market Size (US$ million) Analysis, By Form, 2018 to 2033

Table 05: Global Market Size (US$ million) Analysis, By Distribution Channel, 2018 to 2033

Table 06: Global Market, Cross Sectional Analysis of Product Vs Distribution Channel, 2018 to 2033

Table 07: Global Market, Cross Sectional Analysis of Product Vs Distribution Channel, 2018 to 2033

Table 08: Global Market, Cross Sectional Analysis of Product Vs Distribution Channel, 2018 to 2033

Table 09: Global Market, Cross Sectional Analysis of Product Vs Distribution Channel, 2018 to 2033

Table 10: Global Market Size (US$ million) Analysis, By Region, 2018 to 2033

Table 11: Global Market Volume (Units) Analysis, By Region, 2018 to 2033

Table 12: North America Current and Future Market Value (US$ million) Analysis, By Country, 2018 to 2033

Table 13: North America Current and Future Market Value (US$ million) Analysis, By Product, 2018 to 2033

Table 14: North America Current and Future Market Volume (Units) Analysis, By Product, 2018 to 2033

Table 15: North America Current and Future Market Value (US$ million) Analysis, By Active Ingredients, 2018 to 2033

Table 16: North America Current and Future Market Value (US$ million) Analysis, By Form, 2018 to 2033

Table 17: North America Current and Future Market Value (US$ million) Analysis, By Distribution Channel, 2018 to 2033

Table 18: Latin America Current and Future Market Value (US$ million) Analysis, By Country, 2018 to 2033

Table 19: Latin America Current and Future Market Value (US$ million) Analysis, By Product, 2018 to 2033

Table 20: Latin America Current and Future Market Volume (Units) Analysis, By Product, 2018 to 2033

Table 21: Latin America Current and Future Market Value (US$ million) Analysis, By Active Ingredients, 2018 to 2033

Table 22: Latin America Current and Future Market Value (US$ million) Analysis, By Form, 2018 to 2033

Table 23: Latin America Current and Future Market Value (US$ million) Analysis, By Distribution Channel, 2018 to 2033

Table 24: East Asia Current and Future Market Value (US$ million) Analysis, By Country, 2018 to 2033

Table 25: East Asia Current and Future Market Value (US$ million) Analysis, By Product, 2018 to 2033

Table 26: East Asia Current and Future Market Volume (Units) Analysis, By Product, 2018 to 2033

Table 27: East Asia Current and Future Market Value (US$ million) Analysis, By Active Ingredients, 2018 to 2033

Table 28: East Asia Current and Future Market Value (US$ million) Analysis, By Form, 2018 to 2033

Table 29: East Asia Current and Future Market Value (US$ million) Analysis, By Distribution Channel, 2018 to 2033

Table 30: South Asia and Pacific Current and Future Market Value (US$ million) Analysis, By Country, 2018 to 2033

Table 31: South Asia and Pacific Current and Future Market Value (US$ million) Analysis, By Product, 2018 to 2033

Table 32: South Asia and Pacific Current and Future Market Volume (Units) Analysis, By Product, 2018 to 2033

Table 33: South Asia and Pacific Current and Future Market Value (US$ million) Analysis, By Active Ingredients, 2018 to 2033

Table 34: South Asia and Pacific Current and Future Market Value (US$ million) Analysis, By Form, 2018 to 2033

Table 35: South Asia and Pacific Current and Future Market Value (US$ million) Analysis, By Distribution Channel, 2018 to 2033

Table 36: Western Europe Current and Future Market Value (US$ million) Analysis, By Country, 2018 to 2033

Table 37: Western Europe Current and Future Market Value (US$ million) Analysis, By Product, 2018 to 2033

Table 38: Western Europe Current and Future Market Volume (Units) Analysis, By Product, 2018 to 2033

Table 39: Western Europe Current and Future Market Value (US$ million) Analysis, By Active Ingredients, 2018 to 2033

Table 40: Western Europe Current and Future Market Value (US$ million) Analysis, By Form, 2018 to 2033

Table 41: Western Europe Current and Future Market Value (US$ million) Analysis, By Distribution Channel, 2018 to 2033

Table 42: Eastern Europe Current and Future Market Value (US$ million) Analysis, By Country, 2018 to 2033

Table 43: Eastern Europe Current and Future Market Value (US$ million) Analysis, By Product, 2018 to 2033

Table 44: Eastern Europe Current and Future Market Volume (Units) Analysis, By Product, 2018 to 2033

Table 45: Eastern Europe Current and Future Market Value (US$ million) Analysis, By Active Ingredients, 2018 to 2033

Table 46: Eastern Europe Current and Future Market Value (US$ million) Analysis, By Form, 2018 to 2033

Table 47: Eastern Europe Current and Future Market Value (US$ million) Analysis, By Distribution Channel, 2018 to 2033

Table 48: Middle East and Africa Current and Future Market Value (US$ million) Analysis, By Country, 2018 to 2033

Table 49: Middle East and Africa Current and Future Market Value (US$ million) Analysis, By Product, 2018 to 2033

Table 50: Middle East and Africa Current and Future Market Volume (Units) Analysis, By Product, 2018 to 2033

Table 51: Middle East and Africa Current and Future Market Value (US$ million) Analysis, By Active Ingredients, 2018 to 2033

Table 52: Middle East and Africa Current and Future Market Value (US$ million) Analysis, By Form, 2018 to 2033

Table 53: Middle East and Africa Current and Future Market Value (US$ million) Analysis, By Distribution Channel, 2018 to 2033

List of Figures

Figure 01: Global Market Split by Region, 2023 (E)

Figure 02: Global Market Split By Product Type, 2023 (E)

Figure 03: Global Market Split By Active Ingredients , 2023 (E)

Figure 04: Global Market Split By Form, 2023 (E)

Figure 05: Global Market Split By Distribution Channel, 2023 (E)

Figure 06: Global Market Volume (Units) and Y-o-Y, 2018 to 2022

Figure 07: Global Market Volume (Units) and Y-o-Y Growth (%), 2023 to 2033

Figure 08: Syringes Pricing Analysis (US$) , By Region, 2022

Figure 09: Strips Pricing Analysis (US$) , By Region, 2022

Figure 10: Tubes Pricing Analysis (US$) , By Region, 2022

Figure 11: Bottles Pricing Analysis (US$) , By Region, 2022

Figure 12: Global Historical Market Value (US$ million) Analysis, 2018 to 2022

Figure 13: Global Current and Future Market Value (US$ million), 2023 to 2033 and Y-o-Y Growth Trend Analysis

Figure 14: Global Market Absolute $ Opportunity, 2023 to 2033

Figure 15: Global Market Share Analysis (%), By Product, 2023 to 2033

Figure 16: Global Market Y-o-Y Analysis (%), By Product, 2023 to 2033

Figure 17: Market Attractiveness Analysis By Product, 2023 to 2033

Figure 18: Global Market Share Analysis (%), By Active Ingredients, 2023 to 2033

Figure 19: Global Market Y-o-Y Analysis (%), By Active Ingredients, 2023 to 2033

Figure 20: Market Attractiveness Analysis By Active Ingredients, 2023 to 2033

Figure 21: Global Market Share Analysis (%), By Form, 2023 to 2033

Figure 22: Global Market Y-o-Y Analysis (%), By Form, 2023 to 2033

Figure 23: Market Attractiveness Analysis By Form, 2023 to 2033

Figure 24: Global Market Share Analysis (%), By Distribution Channel, 2023 to 2033

Figure 25: Global Market Y-o-Y Analysis (%), By Distribution Channel, 2023 to 2033

Figure 26: Market Attractiveness Analysis By Distribution Channel, 2023 to 2033

Figure 27: Global Market Share Analysis (%), By Region, 2023 to 2033

Figure 28: Global Market Y-o-Y Analysis (%), By Region, 2023 to 2033

Figure 29: Market Attractiveness Analysis By Region, 2023 to 2033

Figure 30: North America Market Share Analysis (%), By Product, 2023 (E)

Figure 31: North America Market Share Analysis (%), By Active Ingredients, 2023 (E)

Figure 32: North America Market Share Analysis (%), By Form, 2023 (E)

Figure 33: North America Market Share Analysis (%), By Distribution Channel, 2023 (E)

Figure 34: North America Market Share Analysis (%), By Country, 2023 (E)

Figure 35: North America Historical Market Value (US$ million) Analysis, 2018 to 2022

Figure 36: North America Current and Future Market Value (US$ million), 2023-2033 and Y-o-Y Growth Trend Analysis

Figure 37: North America Market Attractiveness Analysis (%), By Product, 2023 to 2033

Figure 38: North America Market Attractiveness Analysis (%), Active Ingredients, 2023 to 2033

Figure 39: North America Market Attractiveness Analysis (%), Form, 2023 to 2033

Figure 40: North America Market Attractiveness Analysis (%), Distribution Channel, 2023 to 2033

Figure 41: North America Market Attractiveness Analysis (%), Country, 2023 to 2033

Figure 42: United States Market Share Analysis (%) by Product, 2023 to 2033

Figure 43: United States Market Share Analysis (%) by Active Ingredients, 2023 to 2033

Figure 44: United States Market Share Analysis (%) by Form, 2023 to 2033

Figure 45: United States Market Share Analysis (%) by Distribution Channel, 2023 to 2033

Figure 46: Canada Market Share Analysis (%) by Product, 2023 to 2033

Figure 47: Canada Market Share Analysis (%) by Active Ingredients, 2023 to 2033

Figure 48: Canada Market Share Analysis (%) by Form, 2023 to 2033

Figure 49: Canada Market Share Analysis (%) by Distribution Channel, 2023 to 2033

Figure 50: Mexico Market Share Analysis (%) by Product, 2023 to 2033

Figure 51: Mexico Market Share Analysis (%) by Active Ingredients, 2023 to 2033

Figure 52: Mexico Market Share Analysis (%) by Form, 2023 to 2033

Figure 53: Mexico Market Share Analysis (%) by Distribution Channel, 2023 to 2033

Figure 54: Latin America Market Share Analysis (%), By Product, 2023 (E)

Figure 55: Latin America Market Share Analysis (%), By Active Ingredients, 2023 (E)

Figure 56: Latin America Market Share Analysis (%), By Form, 2023 (E)

Figure 57: Latin America Market Share Analysis (%), By Distribution Channel, 2023 (E)

Figure 58: Latin America Market Share Analysis (%), By Country, 2023 (E)

Figure 59: Latin America Historical Market Value (US$ million) Analysis, 2018 to 2022

Figure 60: Latin America Current and Future Market Value (US$ million), 2023-2033 and Y-o-Y Growth Trend Analysis

Figure 61: Latin America Market Attractiveness Analysis (%), By Product, 2023 to 2033

Figure 62: Latin America Market Attractiveness Analysis (%), Active Ingredients, 2023 to 2033

Figure 63: Latin America Market Attractiveness Analysis (%), Form, 2023 to 2033

Figure 64: Latin America Market Attractiveness Analysis (%), Distribution Channel, 2023 to 2033

Figure 65: Latin America Market Attractiveness Analysis (%), Country, 2023 to 2033

Figure 66: Brazil Market Share Analysis (%) by Product, 2023 to 2033

Figure 67: Brazil Market Share Analysis (%) by Active Ingredients, 2023 to 2033

Figure 68: Brazil Market Share Analysis (%) by Form, 2023 to 2033

Figure 69: Brazil Market Share Analysis (%) by Distribution Channel, 2023 to 2033

Figure 70: Chile Market Share Analysis (%) by Product, 2023 to 2033

Figure 71: Chile Market Share Analysis (%) by Active Ingredients, 2023 to 2033

Figure 72: Chile Market Share Analysis (%) by Form, 2023 to 2033

Figure 73: Chile Market Share Analysis (%) by Distribution Channel, 2023 to 2033

Figure 74: East Asia Market Share Analysis (%), By Product, 2023 (E)

Figure 75: East Asia Market Share Analysis (%), By Active Ingredients, 2023 (E)

Figure 76: East Asia Market Share Analysis (%), By Form, 2023 (E)

Figure 77: East Asia Market Share Analysis (%), By Distribution Channel, 2023 (E)

Figure 78: East Asia Market Share Analysis (%), By Country, 2023 (E)

Figure 79: East Asia Historical Market Value (US$ million) Analysis, 2018 to 2022

Figure 80: East Asia Current and Future Market Value (US$ million), 2023-2033 and Y-o-Y Growth Trend Analysis

Figure 81: East Asia Market Attractiveness Analysis (%), By Product, 2023 to 2033

Figure 82: East Asia Market Attractiveness Analysis (%), Active Ingredients, 2023 to 2033

Figure 83: East Asia Market Attractiveness Analysis (%), Form, 2023 to 2033

Figure 84: East Asia Market Attractiveness Analysis (%), Distribution Channel, 2023 to 2033

Figure 85: East Asia Market Attractiveness Analysis (%), Country, 2023 to 2033

Figure 86: China Market Share Analysis (%) by Product, 2023 to 2033

Figure 87: China Market Share Analysis (%) by Active Ingredients, 2023 to 2033

Figure 88: China Market Share Analysis (%) by Form, 2023 to 2033

Figure 89: China Market Share Analysis (%) by Distribution Channel, 2023 to 2033

Figure 90: Japan Market Share Analysis (%) by Product, 2023 to 2033

Figure 91: Japan Market Share Analysis (%) by Active Ingredients, 2023 to 2033

Figure 92: Japan Market Share Analysis (%) by Form, 2023 to 2033

Figure 93: Japan Market Share Analysis (%) by Distribution Channel, 2023 to 2033

Figure 94: South Korea Market Share Analysis (%) by Product, 2023 to 2033

Figure 95: South Korea Market Share Analysis (%) by Active Ingredients, 2023 to 2033

Figure 96: South Korea Market Share Analysis (%) by Form, 2023 to 2033

Figure 97: South Korea Market Share Analysis (%) by Distribution Channel, 2023 to 2033

Figure 98: South Asia and Pacific Market Share Analysis (%), By Product, 2023 (E)

Figure 99: South Asia and Pacific Market Share Analysis (%), By Active Ingredients, 2023 (E)

Figure 100: South Asia and Pacific Market Share Analysis (%), By Form, 2023 (E)

Figure 101: South Asia and Pacific Market Share Analysis (%), By Distribution Channel, 2023 (E)

Figure 102: South Asia and Pacific Market Share Analysis (%), By Country, 2023 (E)

Figure 103: South Asia and Pacific Historical Market Value (US$ million) Analysis, 2018 to 2022

Figure 104: South Asia and Pacific Current and Future Market Value (US$ million), 2023-2033 and Y-o-Y Growth Trend Analysis

Figure 105: South Asia and Pacific Market Attractiveness Analysis (%), By Product, 2023 to 2033

Figure 106: South Asia and Pacific Market Attractiveness Analysis (%), Active Ingredients, 2023 to 2033

Figure 107: South Asia and Pacific Market Attractiveness Analysis (%), Form, 2023 to 2033

Figure 108: South Asia and Pacific Market Attractiveness Analysis (%), Distribution Channel, 2023 to 2033

Figure 109: South Asia and Pacific Market Attractiveness Analysis (%), Country, 2023 to 2033

Figure 110: India Market Share Analysis (%) by Product, 2023 to 2033

Figure 111: India Market Share Analysis (%) by Active Ingredients, 2023 to 2033

Figure 112: India Market Share Analysis (%) by Form, 2023 to 2033

Figure 113: India Market Share Analysis (%) by Distribution Channel, 2023 to 2033

Figure 114: Association of Southeast Asian Nations Countries Market Share Analysis (%) by Product, 2023 to 2033

Figure 115: Association of Southeast Asian Nations Countries Market Share Analysis (%) by Active Ingredients, 2023 to 2033

Figure 116: Association of Southeast Asian Nations Countries Market Share Analysis (%) by Form, 2023 to 2033

Figure 117: Association of Southeast Asian Nations Countries Market Share Analysis (%) by Distribution Channel, 2023 to 2033

Figure 118: Australia and New Zealand Market Share Analysis (%) by Product, 2023 to 2033

Figure 119: Australia and New Zealand Market Share Analysis (%) by Active Ingredients, 2023 to 2033

Figure 120: Australia and New Zealand Market Share Analysis (%) by Form, 2023 to 2033

Figure 121: Australia and New Zealand Market Share Analysis (%) by Distribution Channel, 2023 to 2033

Figure 122: Western Europe Market Share Analysis (%), By Product, 2023 (E)

Figure 123: Western Europe Market Share Analysis (%), By Active Ingredients, 2023 (E)

Figure 124: Western Europe Market Share Analysis (%), By Form, 2023 (E)

Figure 125: Western Europe Market Share Analysis (%), By Distribution Channel, 2023 (E)

Figure 126: Western Europe Market Share Analysis (%), By Country, 2023 (E)

Figure 127: Western Europe Historical Market Value (US$ million) Analysis, 2018 to 2022

Figure 128: Western Europe Current and Future Market Value (US$ million), 2023-2033 and Y-o-Y Growth Trend Analysis

Figure 129: Western Europe Market Attractiveness Analysis (%), By Product, 2023 to 2033

Figure 130: Western Europe Market Attractiveness Analysis (%), Active Ingredients, 2023 to 2033

Figure 131: Western Europe Market Attractiveness Analysis (%), Form, 2023 to 2033

Figure 132: Western Europe Market Attractiveness Analysis (%), Distribution Channel, 2023 to 2033

Figure 133: Western Europe Market Attractiveness Analysis (%), Country, 2023 to 2033

Figure 134: Germany Market Share Analysis (%) by Product, 2023 to 2033

Figure 135: Germany Market Share Analysis (%) by Active Ingredients, 2023 to 2033

Figure 136: Germany Market Share Analysis (%) by Form, 2023 to 2033

Figure 137: Germany Market Share Analysis (%) by Distribution Channel, 2023 to 2033

Figure 138: Italy Market Share Analysis (%) by Product, 2023 to 2033

Figure 139: Italy Market Share Analysis (%) by Active Ingredients, 2023 to 2033

Figure 140: Italy Market Share Analysis (%) by Form, 2023 to 2033

Figure 141: Italy Market Share Analysis (%) by Distribution Channel, 2023 to 2033

Figure 142: France Market Share Analysis (%) by Product, 2023 to 2033

Figure 143: France Market Share Analysis (%) by Active Ingredients, 2023 to 2033

Figure 144: France Market Share Analysis (%) by Form, 2023 to 2033

Figure 145: France Market Share Analysis (%) by Distribution Channel, 2023 to 2033

Figure 146: United Kingdom Market Share Analysis (%) by Product, 2023 to 2033

Figure 147: United Kingdom Market Share Analysis (%) by Active Ingredients, 2023 to 2033

Figure 148: United Kingdom Market Share Analysis (%) by Form, 2023 to 2033

Figure 149: United Kingdom Market Share Analysis (%) by Distribution Channel, 2023 to 2033

Figure 150: Spain Market Share Analysis (%) by Product, 2023 to 2033

Figure 151: Spain Market Share Analysis (%) by Active Ingredients, 2023 to 2033

Figure 152: Spain Market Share Analysis (%) by Form, 2023 to 2033

Figure 153: Spain Market Share Analysis (%) by Distribution Channel, 2023 to 2033

Figure 154: BENELUX Market Share Analysis (%) by Product, 2023 to 2033

Figure 155: BENELUX Market Share Analysis (%) by Active Ingredients, 2023 to 2033

Figure 156: BENELUX Market Share Analysis (%) by Form, 2023 to 2033

Figure 157: BENELUX Market Share Analysis (%) by Distribution Channel, 2023 to 2033

Figure 158: Nordic Countries Market Share Analysis (%) by Product, 2023 to 2033

Figure 159: Nordic Countries Market Share Analysis (%) by Active Ingredients, 2023 to 2033

Figure 160: Nordic Countries Market Share Analysis (%) by Form, 2023 to 2033

Figure 161: Nordic Countries Market Share Analysis (%) by Distribution Channel, 2023 to 2033

Figure 162: Eastern Europe Market Share Analysis (%), By Product, 2023 (E)

Figure 163: Eastern Europe Market Share Analysis (%), By Active Ingredients, 2023 (E)

Figure 164: Eastern Europe Market Share Analysis (%), By Form, 2023 (E)

Figure 165: Eastern Europe Market Share Analysis (%), By Distribution Channel, 2023 (E)

Figure 166: Eastern Europe Market Share Analysis (%), By Country, 2023 (E)

Figure 167: Eastern Europe Historical Market Value (US$ million) Analysis, 2018 to 2022

Figure 168: Eastern Europe Current and Future Market Value (US$ million), 2023-2033 and Y-o-Y Growth Trend Analysis

Figure 169: Eastern Europe Market Attractiveness Analysis (%), By Product, 2023 to 2033

Figure 170: Eastern Europe Market Attractiveness Analysis (%), Active Ingredients, 2023 to 2033

Figure 171: Eastern Europe Market Attractiveness Analysis (%), Form, 2023 to 2033

Figure 172: Eastern Europe Market Attractiveness Analysis (%), Distribution Channel, 2023 to 2033

Figure 173: Eastern Europe Market Attractiveness Analysis (%), Country, 2023 to 2033

Figure 174: Russia Market Share Analysis (%) by Product, 2023 to 2033

Figure 175: Russia Market Share Analysis (%) by Active Ingredients, 2023 to 2033

Figure 176: Russia Market Share Analysis (%) by Form, 2023 to 2033

Figure 177: Russia Market Share Analysis (%) by Distribution Channel, 2023 to 2033

Figure 178: Hungary Market Share Analysis (%) by Product, 2023 to 2033

Figure 179: Hungary Market Share Analysis (%) by Active Ingredients, 2023 to 2033

Figure 180: Hungary Market Share Analysis (%) by Form, 2023 to 2033

Figure 181: Hungary Market Share Analysis (%) by Distribution Channel, 2023 to 2033

Figure 182: Poland Market Share Analysis (%) by Product, 2023 to 2033

Figure 183: Poland Market Share Analysis (%) by Active Ingredients, 2023 to 2033

Figure 184: Poland Market Share Analysis (%) by Form, 2023 to 2033

Figure 185: Poland Market Share Analysis (%) by Distribution Channel, 2023 to 2033

Figure 186: Middle East and Africa Market Share Analysis (%), By Product, 2023 (E)

Figure 187: Middle East and Africa Market Share Analysis (%), By Active Ingredients, 2023 (E)

Figure 188: Middle East and Africa Market Share Analysis (%), By Form, 2023 (E)

Figure 189: Middle East and Africa Market Share Analysis (%), By Distribution Channel, 2023 (E)

Figure 190: Middle East and Africa Market Share Analysis (%), By Country, 2023 (E)

Figure 191: Middle East and Africa Historical Market Value (US$ million) Analysis, 2018 to 2022

Figure 192: Middle East and Africa Current and Future Market Value (US$ million), 2023-2033 and Y-o-Y Growth Trend Analysis

Figure 193: Middle East and Africa Market Attractiveness Analysis (%), By Product, 2023 to 2033

Figure 194: Middle East and Africa Market Attractiveness Analysis (%), Active Ingredients, 2023 to 2033

Figure 195: Middle East and Africa Market Attractiveness Analysis (%), Form, 2023 to 2033

Figure 196: Middle East and Africa Market Attractiveness Analysis (%), Distribution Channel, 2023 to 2033

Figure 197: Middle East and Africa Market Attractiveness Analysis (%), Country, 2023 to 2033

Figure 198: Saudi Arabia Market Share Analysis (%) by Product, 2023 to 2033

Figure 199: Saudi Arabia Market Share Analysis (%) by Active Ingredients, 2023 to 2033

Figure 200: Saudi Arabia Market Share Analysis (%) by Form, 2023 to 2033

Figure 201: Saudi Arabia Market Share Analysis (%) by Distribution Channel, 2023 to 2033

Figure 202: Türkiye Market Share Analysis (%) by Product, 2023 to 2033

Figure 203: Türkiye Market Share Analysis (%) by Active Ingredients, 2023 to 2033

Figure 204: Türkiye Market Share Analysis (%) by Form, 2023 to 2033

Figure 205: Türkiye Market Share Analysis (%) by Distribution Channel, 2023 to 2033

Figure 206: South Africa Market Share Analysis (%) by Product, 2023 to 2033

Figure 207: South Africa Market Share Analysis (%) by Active Ingredients, 2023 to 2033

Figure 208: South Africa Market Share Analysis (%) by Form, 2023 to 2033

Figure 209: South Africa Market Share Analysis (%) by Distribution Channel, 2023 to 2033

Figure 210: Other African Union Market Share Analysis (%) by Product, 2023 to 2033

Figure 211: Other African Union Market Share Analysis (%) by Active Ingredients, 2023 to 2033

Figure 212: Other African Union Market Share Analysis (%) by Form, 2023 to 2033

Figure 213: Other African Union Market Share Analysis (%) by Distribution Channel, 2023 to 2033

Frequently Asked Questions

How large was the global dental bleaching agent market in 2022?

The global market was valued at around USD 1,129.3 million in 2022.

What would be the global dental bleaching agent market outlook?

The global market is set to reach USD 1,608.9 million by 2033.

Which product is set to lead the dental bleaching agent market?

The syringe segment is set to lead the dental bleaching agent market.

What was the historical CAGR of the global market?

The dental bleaching agent market surged at a 2.2% CAGR from 2018 to 2022.

What value is the global market estimated to reach by 2023?

The dental bleaching agent market is set to reach USD 1,166.3 million by 2023.

What is the United States market outlook?

The United States generated around 31.6% share of the global market in 2022.

Explore Similar Insights

Future Market Insights

Dental Bleaching Agent Market